Georgia State University
ScholarWorks @ Georgia State University
Geosciences Theses Department of Geosciences
5-10-2019
Groundwater Inundation and Wastewater
Treatment in the Coastal Plain of Georgia
Ben Hodges
Follow this and additional works at:https://scholarworks.gsu.edu/geosciences_theses
This Thesis is brought to you for free and open access by the Department of Geosciences at ScholarWorks @ Georgia State University. It has been accepted for inclusion in Geosciences Theses by an authorized administrator of ScholarWorks @ Georgia State University. For more information, please [email protected].
Recommended Citation
Hodges, Ben, "Groundwater Inundation and Wastewater Treatment in the Coastal Plain of Georgia." Thesis, Georgia State University, 2019.
GROUNDWATER INUNDATION AND WASTEWATER TREATMENT IN THE COASTAL PLAIN OF GEORGIA
by
BEN HODGES
Under the Direction of Brian Meyer, P.G., PhD
ABSTRACT
Sea level rise as a function of climate change is projected to have profound impacts on
coastal environments, and groundwater inundation is expected to follow. In this study, Bryan
County, Georgia (USA) was evaluated using ground penetrating radar to determine future
impacts of groundwater inundation to onsite wastewater treatment systems (OWTS). Also known
as septic fields, OWTSs were mapped using handheld GPS units. These locations were then
compared to groundwater projections of 0.2, 0.5, and 1.0-m heights above the seasonal
high-water table. OWTS depths were modeled at 0.45 and 0.9 m, based on similar studies in North
Carolina (Manda et al., 2015). These conditions create an environment where OWTSs will be a
danger to water resources in the area. Modeling shows OWTS groundwater inundation ranging
from 99% in Upper Bryan County to 100% in Lower Bryan County at seasonal high-water tables
and 1 m of groundwater rise.
INDEX WORDS: Sea Level Rise, Groundwater Inundation, Onsite Wastewater Treatment
GROUNDWATER INUNDATION AND WASTEWATER TREATMENT IN THE COASTAL PLAIN OF GEORGIA
by
BEN HODGES
A Thesis Submitted in Partial Fulfillment of the Requirements for the Degree of
Master of Science
in the College of Arts and Sciences
Georgia State University
Copyright by John Benjamin Hodges
GROUNDWATER INUNDATION AND WASTEWATER TREATMENT IN THE COASTAL PLAIN OF GEORGIA
by
BEN HODGES
Committee Chair: Brian Meyer
Committee: Luke Pangle
Dajun Dai
Electronic Version Approved:
Office of Graduate Studies
College of Arts and Sciences
Georgia State University
iv
DEDICATION
I would like to dedicate this work to my parents, Karen and John Hodges who helped
raise me with an awe of science and gave me the means to make this possible. My lovely wife,
Clara, who has put up with me and given insight and practical advice throughout, a scientist in
v
ACKNOWLEDGEMENTS
I would like to thank the Carl Vinson Institute of Government (CVIOG) at the University
of Georgia for providing the data necessary for comparison to our modeled surfaces, as well as
the logistical support from the Center for Research and Education at Wormsloe (CREW). I
would like to thank Albert “Scoot” Killingsworth, IV and Tim Herold for their contributions to
data collection in the field. I would also like to thank my fellow employees at Golder Associates,
James Jones for input on geographic information systems and hydrogeologic modeling, Chris
Bryant for input and assistance with the selection of ground penetrating radar systems, and
vi
TABLE OF CONTENTS
ACKNOWLEDGEMENTS ... V
LIST OF TABLES ... VIII
LIST OF ABBREVIATIONS ... XI
1 INTRODUCTION ... 1
1.1 Research Framework ... 1
1.2 Research Objectives ... 6
1.3 Study Area ... 6
1.4 Geology ... 6
1.5 Topography ... 9
1.6 Climate ... 10
2 EXPERIMENT ... 13
2.1 Hydrogeologic Framework ... 13
2.2 Aquifer Characterization and Groundwater Monitoring ... 13
2.3 Ground Penetrating Radar (GPR) ... 15
2.4 Data Processing ... 16
3 RESULTS ... 23
3.1 Modeled Results... 23
4 DISCUSSION ... 23
vii
4.2 Discussion of Impacts of Research ... 24
5 CONCLUSIONS ... 29
REFERENCES ... 30
APPENDICES ... 33
viii
LIST OF TABLES
Table 1: GPR Velocity Calculations ... 18
Table 2: Rates of Septic System and Ground Surface Inundation in Seasonal High and Low
Water Table Scenarios at 0.2, 0.5, and 1.0m of Sea Level Rise ... 23
ix
LIST OF FIGURES
Figure 1: NOAA Projected Sea Level Rise of Three Feet in Lower Bryan County (Created using
NOAA Sea Level Rise Viewer Model, March 2019) ... 2
Figure 2: NOAA Sea Level Rise Projections of the Georgia Bight versus Global Sea Level Rise Projections... 3
Figure 3:Locations of Paleoshoreline Terraces of the Georgia Bight (Modified from Hoyt) ... 8
Figure 4: LiDAR Map of Upper and Lower Bryan Study Areas ... 10
Figure 5:Daily Precipitation in Lower Bryan County, GA (http://nwis.waterdata.usgs.gov/) ... 11
Figure 6: Daily Discharge at the Ogeechee River in Lower Bryan Study Area (Negative values are functional of incoming tidal flows) (http://nwis.waterdata.usgs.gov/) ... 12
Figure 7: Daily Gage Height Variation in Lower Bryan Study Area (Negative values are below daily average) (http://nwis.waterdata.usgs.gov/) ... 12
Figure 8: Location of Wormsloe Historic Site Where Shallow Groundwater Wells Were Used to Calibrate GPR and Create Seasonal Water Tables ... 14
Figure 9: Wormsloe Site Water Level Transducer Data used for Seasonal Water Table Measurements ... 15
Figure 10: MALA GPR System, controller, and 450 MHz antenna ... 16
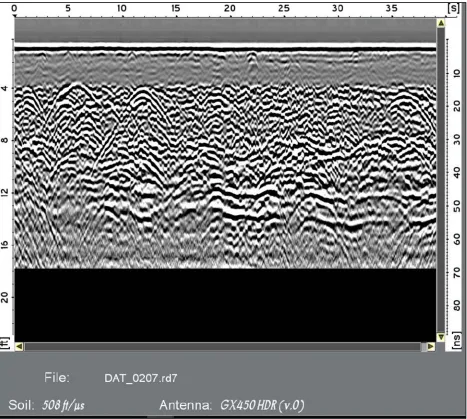
Figure 11: GPR Pass Taken July 17,2018 (Orchard Rd Upper Bryan County) ... 17
Figure 12 Measured Groundwater Elevations vs. Surface Elevations (as compared to LiDAR values and extracted from ArcGIS) ... 20
Figure 13: Locations of Groundwater GPR Survey ... 21
Figure 14:Study Area with LiDAR and Mapped Onsite Waste Treatment Systems ... 22
x
xi
LIST OF ABBREVIATIONS
GPR-Ground Penetrating Radar GPS-Global Positioning System
OSWTs- On Site Wastewater Treatment Systems m-meter
ft-foot
1
1 INTRODUCTION
1.1 Research Framework
The coastal regions of the U.S. are among the nation’s most economically productive and
ecologically diverse areas. Based on 2010 U.S. Census data, coastal counties account for 39% of
the nation’s population and include many of the largest cities and fastest growing counties
(Wilson and Fischetti, 2010). Climate change and sea level rise are significant concerns to the
coast of Georgia and to the population and infrastructure (Nicholls and Cazenave, 2010).
Projections show sea-level rise ranging from 0.2 to more than 1 meter by the end of the century
(Jevrejeva et al, 2012). Adverse effects of sea level rise include marine inundation of the
surficial aquifer and salt water intrusion into freshwater groundwater resources (Cooper et al.,
2013). However, increases in water table elevation and subsequent groundwater inundation are
also major concerns that are less understood. This occurs in coastal areas where groundwater
tables rise to land surface and cause flooding that is not associated with the overflow of streams.
This rise in groundwater is caused as gradients in freshwater resources decrease. As sea levels
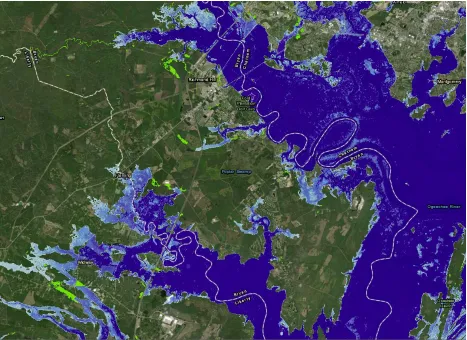
rise, rivers and streams will face higher base gradients that will cause them to back up and
2
Figure 1: NOAA Projected Sea Level Rise of Three Feet in Lower Bryan County (Created using NOAA Sea Level Rise Viewer Model, March 2019)
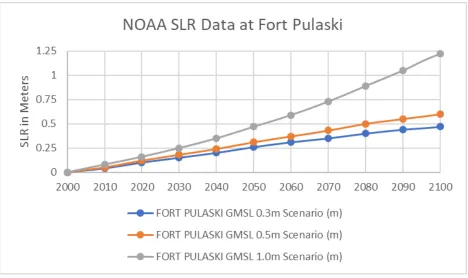
Sea Level Rise does not occur uniformly across the globe (NOAA, 2017). Based on sea
level rise projections published by the United States National Oceanic and Atmospheric
Administration, sea levels will actually rise faster in the Georgia Bight than global mean sea
level projections. Based on these projections, by 2100 the coast of Georgia will see more than a
quarter of a meter more sea level rise than the global average in a one meter sea level rise
3
Figure 2: NOAA Sea Level Rise Projections of the Georgia Bight versus Global Sea Level Rise Projections (NOAA, 2017).
There are several issues of concern that occur due to groundwater inundation including
loss of habitable dry land, chronic and repetitive flooding, geomorphological variation due to
changes in stream drainage, creation of wetlands, and persistently saturated soils (Nicholls,
1995). In a state like Georgia, where agriculture dominates the economy, these effects are
especially concerning. The occurrence of these phenomena will not be severe in the short term or
as overwhelming as many natural disasters but will require engineering and policy decisions to
be made far in advance. These decisions will be costly and will require significant political will
and investment. Approximately 60% of the world’s population live within 150 km of the
coastline and these mitigation strategies will be necessary (Nicholls, 1995).
Areas such as the Georgia Barrier Islands and Coastal Plain may not be overwhelmed by
forecasted sea level rise, but when combined with the loss of habitat from coastal inundation the
4
water table in Georgia’s coast is shallow enough that even moderate groundwater level rise could
lead to inundation of low-lying areas. This impact could affect more than just septic waste
disposal systems. Development near the coast is often marked by the use of underground utilities
in higher income areas. Roads, bridges, cemeteries, and train lines would be impacted, as well as
other types of developments such as golf and outdoor resorts.
Onsite wastewater treatment systems (OWTS), also known as septic systems, are used for
the disposal of wastewater (Hanchar, 1991; Humphrey et al., 2012; Graham and Polizzotto,
2013). Traditionally these systems consist of a tank, a distribution box, and a piped drainfield
(Manda et al., 2015). These are installed in the surficial lithologic unit above the surficial aquifer
in the vadose zone, such that they are a considerable distance from the water table. This allows
the system to operate in ideal (aerobic) conditions and protects local groundwater from site
contamination (Manda et al., 2015).
As much as 25% of the population of the United States use onsite wastewater treatment
systems for removal of domestic and commercial wastes (Conn et al, 2006). When septic fields
are not allowed the necessary distance above water sources, the aerobic bacteria that are used to
break down the pathogens in the sewage are not able to perform their function. As bacteria are
limited to a reduced vadose (unsaturated) zone or when sewage enters ground or surface waters,
dissolved oxygen is depleted by the bacteria and anoxic zones occur. This can lead to impacts in
wetlands, streams, and local ecosystems (Minnesota Pollution Control Agency, 2009).
There are also major concerns regarding the spread of disease that are associated with
poor disposal of sewage. Poor wastewater treatment is a cause of disease all over the world, and
strong correlations have been shown in diarrheal diseases (Levy et al, 2016). Flooding of septic
5
affected as microbes in the limited vadose zone are unable to fully biodegrade wastes. Pathogens
can then be transferred through tidal or conductive groundwater forces to shallow irrigation wells
used for agriculture or to surface water bodies. As groundwater continues to rise or during flood
events, the wastes that are no longer able to be removed from homes and commercial buildings
will back up and spread. In many cases, there may not be alternative means of waste removal.
Common pathogens detected in wastewater include E. Coli, N. Meningitidis, S. dysenteriae, and
V. cholerae (Cai and Zhang, 2013)
These systems are not limited to biological wastes, and the threats that they pose to
groundwater and nearby surface water bodies are considerable. Waste streams that reach septic
fields are not limited to excrement. Excrement wastes are known as black water and include
refuse from toilets. Often these include discarded antidepressants, steroids, stimulants, and other
pharmaceutical compounds (Conn et al, 2006). Waste streams also include what is known as
grey water. Grey water is any water that is collected from runoff drains, sinks, showers, washing
machines, appliances, and other commercial equipment. These can include disinfectants,
antimicrobial agents, and metal chelating agents such as ammonia and various phenolic
substances (Conn et al, 2006)
The Georgia Rules of the Department of Public Health do not have a required depth for
OSWTs, only stating that “A minimum earth cover of six inches (0.15m) over the tank is
recommended” (Environmental Health Onsite Manual, 2016). However, best practices in the
industry generally require drain field depth to range from 0.45m to 0.9m below grade. In nearby
North Carolina, state regulations mandate that drain field trenches must be installed no deeper
6
wettest season of the year is at least 24 inches (0.6m) below the bottom surface of the
drainfield.” (State of Florida, Department of Health, Chapter 64E-6).
1.2 Research Objectives
The objectives of this research are to (1) create a model of the seasonal high-water table
heights anticipated under a range of future scenarios and evaluate their impacts at projected
groundwater levels to OWTS, and (2) to use this research to extrapolate other possible
infrastructure and development impacts that will occur due to groundwater inundation.
1.3 Study Area
Bryan County is located in coastal Georgia near the center of the Georgia Bight and
southwest of Savannah. Bryan County’s largest population centers include Richmond Hill and
Pembroke. The county is bisected by Fort Stewart, a US Army base that splits the county and
research areas into what are referred to in the results as Upper and Lower Bryan County Study
Areas. As of the 2010 census, Bryan County was home to 30,233 people and as of 2017 the
county had registered 37,060 people (https://www.census.gov). Bryan county has a total area of
1,180 square km of which 47 square kilometers (4%) is water (https://www.census.gov). Fort
Stewart is almost as large as the surrounding county at 1,100 square kilometers and completely
separates the county into two parts. In order to reach Upper Bryan County from Lower Bryan
County on public roads, one must leave the county.
1.4 Geology
The dunes and swales of the lower Coastal Plain of Georgia were first described in a
formal manner and mapped by LaForge and Cook (1925). In 1950, MacNeil completed a
regional study and descriptions of the coastal stratigraphic units. In this report, MacNeil
7
approximately 29-30 meters above MSL. These included the Wicomico, ~29-30 m (~98 ft);
Penholoway, ~23 m (~75 ft); Talbot, ~12-14 m (~39-46 ft); Pamlico, ~8 m (~26 ft); Princess
Anne, ~4.5m (~14 ft); and Silver Bluff, ~1.5 m (~5 ft). The upper elevation limit of Quaternary
sea level in Georgia is considered to be the coastal sediments attributed to the Wicomico Terrace
or paleoshoreline position. The lowest and easternmost of these shorelines being the Silver Bluff.
The Lower Bryan County Study Area and Wormsloe are situated in the Princess Anne
and Pamlico shoreline deposits and the Upper Bryan County Study Area is located in the
8
9
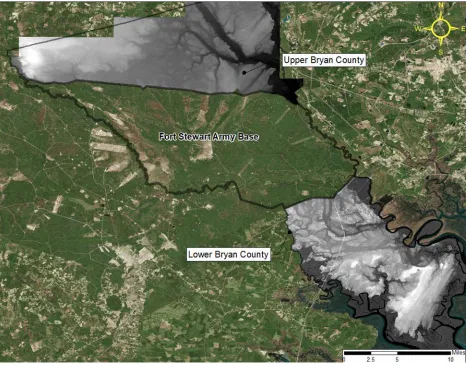
1.5 Topography
A digital elevation model (DEM; vertical accuracy=0.25m and spatial resolution=6.1m)
derived from Light Detection and Ranging (LiDAR) data (Bryan County GIS) clearly displays
the Holocene/Pliocene age dune ridges and swales of Lower Bryan County and to a lesser extent
Upper Bryan County (Figure 3). Like many intercoastal areas, the landscape is dominated by
shore parallel ridges with the smallest ridges and least elevation variance in the northwestern
study (Upper Bryan). Lower Bryan varies from 0m along the intercoastal river areas to 16m in
dune ridges. Upper Bryan elevations range from 4m to 49m as you move inland. In Upper Bryan
County, the Ogeechee River lies on a gradient of approximately 4.9 x 10⁻⁴ m/m and 5.1 x 10⁻⁵
10
Figure 4: LiDAR Map of Upper and Lower Bryan Study Areas
1.6 Climate
Bryan County is located in a subtropical zone with high humidity, temperatures, and
precipitation. The average temperature ranges from 9.4 to 27.2 degrees Celsius, and average
yearly rainfall is 129.5cm.
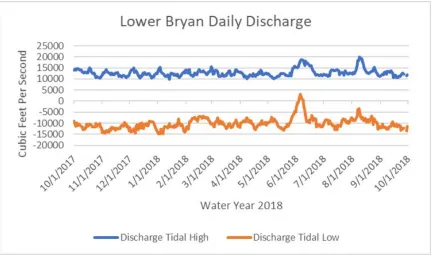
(http://bryancountyga.org/about-us/living-here/statistics-demographics). Rainfall is fairly consistent throughout the year in Bryan (Figure 3) though
discharge increases during winter months due to lower evapotranspiration (Figure 4). In Lower
11
figures below is 7.8 miles from the marine water boundary in the marsh just south of
Montgomery, GA. (Figure 5) (http://nwis.waterdata.usgs.gov/)
12
Figure 6: Daily Discharge at the Ogeechee River in Lower Bryan Study Area (Negative values are functional of incoming tidal flows) (http://nwis.waterdata.usgs.gov/)
[image:25.612.90.522.395.653.2]13
2 EXPERIMENT 2.1 Hydrogeologic Framework
The surficial aquifer in Bryan County is composed of Holocene to Pliocene aged
sediments and ranges in thickness from over 67m (220 ft) in the southeastern portion of the
county to approximately 43m (140 ft) in the northern portion of the county (Clarke et al., 1999).
The aquifer system is in direct contact with the surface and is connected with surface water and
tidal streams. The sediments that comprise the surficial aquifer system are dominated by fine to
medium quartz sands with minor occurrences of clays and silts. Geoprobe drilling and GPR
surveys (160 MHz antenna) at the Wormsloe study area indicate that upper confining clay layer
is situated at 20-25 feet below land surface. This clay layer overlies the Upper Floridan Aquifer
which is in communication with the surficial aquifer in this area of Southeast Georgia (USGS
Scientific Investigations Report 2006-5058). Hydraulic conductivity data obtained via slug
testing of shallow wells at the Wormsloe study area yielded values of 1.4 x 10⁻⁵ cm/sec to 1.6 x
10-4 cm/sec (n=5) with a mean value of 5.8 x 10⁻⁵ cm/sec, a value that is representative of a fine
sand (Fetter, 2001). In addition, lateral saltwater intrusion has been documented to occur in the
shallow aquifer system at limited distances from the intertidal environment (Bush et al., 2016).
2.2 Aquifer Characterization and Groundwater Monitoring
A conceptual hydrogeological model was constructed using data from previous studies of
the surficial aquifer system in study areas that are located in near proximity to the subject study
14
Figure 8: Location of Wormsloe Historic Site Where Shallow Groundwater Wells Were Used to Calibrate GPR and Create Seasonal Water Tables
Groundwater data was utilized from the Wormsloe State Historic Site in Chatham
County, located to the immediate northeast of Bryan County where a monitoring well network
collects shallow water level data on a 1-hour frequency or sampling interval. The groundwater
data from Wormsloe was used to determine the timing and magnitude of the seasonal high-water
15
Figure 9: Wormsloe Site Water Level Transducer Data used for Seasonal Water Table Measurements
2.3 Ground Penetrating Radar (GPR)
In Bryan County a MALA GPR system with a Ramac X3M controller was paired with
160 MHz and 450 MHz antennae. These are shielded antennae that incorporate both transmitter
and receiver in one unit at a fixed spacing. The controller-antenna system can be used for GPR
profiling in either cart or sled mode for the 450 MHz antenna, but required sledding for the 160
16
was pulled by hand directly over ground surface and the 160 MHz sled was pushed on a cart in
contact with ground surface that took advantage of a wheel odometer to distinguish distance.
One hundred and forty-five (145) locations in Upper and Lower Bryan County were
surveyed by a team of Georgia State graduate students and Dr. Brian K. Meyer. Fifty-eight (58)
locations were sampled in Lower Bryan County due to difficulty with access in the more coastal
[image:29.612.127.485.236.506.2]region, with the remaining eighty-seven (87) profiles collected in Upper Bryan County.
Figure 10: MALA GPR System, controller, and 450 MHz antenna
2.4 Data Processing
Processing of the data was performed to remove ambient noise and surface normalization
was performed using the LiDAR data to compensate for topography. GPR profile locations were
recorded using a Trimble GeoExplorer XH handheld GPS device accurate to within 0.15m. In
the Coastal Plain of Georgia, dry sands are optimal for the use of GPR devices. Groundwater
17
causes a loss of return signal and clay soils attenuate radar until it will not produce viable returns
(Daniels, 2004). The water table was identified by the change in velocity associated with the
interface of unsaturated and water saturated sands (water table) and compared against the
[image:30.612.76.543.181.600.2]preliminary or conceptual groundwater model.
18
Profiles were calibrated using known groundwater depths at the shallow monitoring wells
at the Wormsloe study area. After calibrating the profiles of the antennae to known groundwater
depths, a mean value velocity of 508 ft/µs was used to best identify the change or reversal in
phase created when waves passed from unsaturated surficial soils to groundwater. This velocity
was chosen using the median value of six calibration passes over areas with known groundwater
depths and four passes using a hyperbola fit method available in the MALA software. When a
continuous layer of attenuated radar was found in the return, it was considered likely to be
groundwater. The vertical resolution of the profiles used to estimate the depth of groundwater
[image:31.612.70.542.328.660.2]was approximately 0.15m (6-inches) and were recorded as such.
Table 1: GPR Velocity Calculations
Velocity Calculation Reference
Date Location
Profile ID
Velocity (ft/us)
Velocity
(cm/ns) Source
7/10/2018 MW-01 97 564 17.2
water level measurement (depth calibration)
7/10/2018 MW-02 99 539 16.4
water level measurement (depth calibration)
7/10/2018 MW-03 102 538 16.4
water level measurement (depth calibration)
7/11/2018 Profile 119 434 13.2 hyperbola fit
7/12/2018 Profile 130 450 13.7 hyperbola fit
7/16/2018 Profile 145 515 15.7 hyperbola fit
7/16/2018 Profile 161 418 12.7 hyperbola fit
7/19/2018 MW-01 239 532 16.2
water level measurement (depth calibration)
7/19/2018 MW-02 240 490 14.9
water level measurement (depth calibration)
7/19/2018 MW-03 241 501 15.3
water level measurement (depth calibration)
Minimum 418 12.7
Maximum 564 17.2
Mean 498.1 15.2
Geometric
Mean 495.8 15.1
19
The elevation of the water table was calculated at each GPR profile location (n=145) by
using the LiDAR surface elevation minus the GPR depth to groundwater (GWEL = LANDEL –
GWDepth). Upon comparison to LiDAR data of Upper and Lower Bryan County, a relationship
was determined to exist between surficial groundwater and ground surface that was highly
consistent. Using ESRI’s ArcMap 10.4.1, points were created from LiDAR values at the
locations mapped where GPR profiles were collected. Groundwater elevations at these locations
were then compared to ground surface elevations from LiDAR. In Upper Bryan County the
relationship between groundwater elevation and surface elevation indicated a linear relationship
with a r-squared value of 0.9996 (y = 1.0012x - 4.5616). In Lower Bryan County the
relationship between groundwater elevation and surface elevation also indicated a linear
relationship with a r-squared value of 0.9923 (y = 1.0087x - 5.1848). Due to these linear
relationships, modeling of the water table surface was assumed to strongly follow topography in
20
Figure 12 Measured Groundwater Elevations vs. Surface Elevations (as compared to LiDAR values and extracted from ArcGIS)
Raster surfaces of the water table were then generated to model the seasonal low and
seasonal high-water table surface. LiDAR topographic raster values were converted using the
slope of the line equation from the topography-water table elevation linear relationship. The
relationship between the seasonal low water table (SLWT) and seasonal high-water table
(SHWT) were evaluated in the model using long-term groundwater monitoring data from the
Wormsloe monitoring well network. Tidal influences were not considered for the model as
MW-02 at Wormsloe Historic Site is sufficiently removed from tidal influence and septic locations
were assumed to be as well. However, additional tidal influences may affect some locations in
Bryan County located near waterways.
GPR measurements coverage varied from 2.0 to 9.6 meters in Lower Bryan County and
5.8 to 47.3 meters in Upper Bryan County. OWST locations ranged from 0.2 to 9.5 meters in
21
spatially distributed to cover each section of the county as completely as possible, avoiding tight
[image:34.612.75.508.120.674.2]groupings. (See Figure 13)
22
Using OWTS data provided by the Carl Vinson Institute of Government (CVIOG) at the
University of Georgia, locations of the OWTS and associated metadata were added to the GIS
geodatabase. The systems were modeled at assumed depths of 0.45 and 0.9 meters below ground
surface based on local regulations and best practices. These assumptions are bracketed by the
fact that shallow groundwater as mapped in the area would provide a practical limit to septic
field depth. Using these rasters, data was pulled at the locations of the OSWTs, and compared to
projected depths of the sanitation systems. Based on groundwater level rise projections in coastal
environments (Jevrejeva et al, 2012) these elevations at the OWTS locations were projected
using a “bathtub model”. In this model, groundwater level rise projections of 0.2m, 0.5m, and
[image:35.612.90.524.344.683.2]1m were modeled and compared with current OSWT depths.
23
3 RESULTS 3.1 Modeled Results
Modeling of the mapped locations of OSWTs showed that the majority of these systems
would be inundated by groundwater at the very least during seasonal high groundwater periods
in even modest sea level rise scenarios. This amounted to a projected 98% of Upper Bryan
County OSWTs and 99% of Lower Bryan County systems at one meter of sea level rise,
regardless of drainfield depth. In the nearer term, nearly 80% of Lower Bryan County OWTSs
[image:36.612.72.536.318.525.2]will be inundated at only 0.2m of sea level rise if buried at a depth of 0.9m.
Table 2: Rates of Septic System and Ground Surface Inundation in Seasonal High and Low Water Table Scenarios at 0.2, 0.5, and 1.0m of Sea Level Rise
Upper Bryan Lower Bryan
Depth 0.2M Seasonal Low 0.5M Seasonal Low 1M Seasonal Low 0.2M Seasonal Low 0.5M Seasonal Low 1M Seasonal Low
Ground 0.30% 0.54% 3.09% Ground 0.00% 0.05% 0.12%
0.45M 0.91% 2.57% 75.69% 0.45M 0.10% 0.12% 6.30%
0.9M 6.54% 66.12% 98.18% 0.9M 0.19% 2.63% 99.76%
0.2M Seasonal High 0.5M Seasonal High 1M Seasonal High 0.2M Seasonal High 0.5M Seasonal High 1M Seasonal High
Ground 0.91% 2.57% 75.69% Ground 0.10% 0.12% 6.30%
0.45M 6.54% 66.12% 98.18% 0.45M 0.22% 2.63% 99.76%
0.9M 89.83% 98.03% 99.49% 0.9M 78.29% 99.68% 100.00%
Notes:
M = meters
Seasonal Low = average seasonal low water table (01 May – 01 August)
Seasonal High = average seasonal high water table (01 December – 01 February) 0.45M = assume OSWTs construction of 0.45 meters below land surface
0.9M = assume OSWTs construction of 0.9 meters below land surface
4 DISCUSSION
4.1 Research Limitations
Future research and modeling will be required to determine the region of Bryan County
24
relationship may be. This is because stream gradients in the two portions of the county are
variable by an order of magnitude, and that elevation change over distance is not comparable. It
is likely that interdune swales in the Pamlico or Princess Anne paleoshorelines may be the last
regions of the coast not in immediate communication with streams that are likely to be
inundated. These may create future marshes or wetlands, but more modeling and research will be
necessary to define those limits. Additionally, due to the simplicity of this model, groundwater
adjacent to streams and surface waters is likely closer to ground surface than is modeled, but for
the purposes of this research the outcome is a more conservative product. The assumption used
in this case is that septic systems are likely not located in areas where groundwater is already
near surface.
It is important to note that in the few locations where groundwater did not follow
topography very closely, these were locations were in non-native soil and/or fill material. An
example location would be a service station located on the exit ramp from Interstate 16. At this
site, water levels were found to be at eighteen feet below ground surface. This location was
clearly developed far above grade in order to facilitate an overpass over the interstate. This likely
leads to the conclusion that transportation and other infrastructure that are built above grade in
the study area will likely not be affected at the same rates that OWSTs will be. Careful attention
was paid in the GPR survey to avoid taking readings in roadways or other non-native ground.
4.2 Discussion of Impacts of Research
In addition to complete or seasonal inundation, these systems will no longer be removed
from the water table in the way in which they were designed in even the more conservative
models. Loss of the required drainage space in the vadose zone and the aerobic conditions that
25
associated with septic systems. The pathogens released in sewage waste will not only produce a
disease pathway but can quickly affect nearby streams and/or shallow wells used for irrigation.
Considering that the average storage capacity of a fine sand, as was noted in the research
area, is 6.95 x 10⁻³ cubic meters (0.21 ft3) of water (Fetter, 2001), the impending loss of up to
1.5m of groundwater storage capacity will have massive effects on the built infrastructure of the
coast and how its drainage is engineered. Retention ponds, drainage basins, and other hydraulic
systems need to be engineered with long term goals in mind. Stream flashiness and mitigation of
flooding under current groundwater storage conditions will be greatly affected by the loss of the
storage in groundwater.
These levels of seasonal inundation combined with reduced storage in the surficial
aquifer could lead to severe groundwater quality issues. Additionally, the backflows of sewage
and wastewater could pose a danger to commercial and residential structures throughout the
Georgia Coast. The average water level depth in Upper and Lower Bryan County was 1.4m
(4.6ft) and 1.5m (5ft) from ground surface, respectively. Ground water level rise of any
significance will have major impacts on life in the Lower Coastal Plain of Georgia.
In Lower Bryan County alone, UGA mapped 4,114 sites of known onsite wastewater
treatment systems. Often these systems are tightly clustered into communities. (Figure 11)
Unfortunately, these communities are often built very near streams or tidal areas due to
commercial fishing or for the attraction of their natural beauty. This tendency toward tight
grouping, and their proximity to freshwater resources present special dangers. As dry areas and
vadose zone capable of aerobic degradation decrease, concentrations of hazardous chemicals
near sensitive receptors will increase. Also, the dilution that might occur if these conditions were
26
negative feedback model is created. This could have catastrophic effects on human health and
[image:39.612.92.523.122.657.2]the environment.
27
Due the property values of these areas, and in some cases, economic inability to rebuild
elsewhere, these communities are unlike to relocate based on groundwater inundation. Defense
of shorelines is expensive and may not be viable at all as groundwater inundation occurs.
Thankfully, this density also provides opportunities for development of small to mid-size public
treatment systems. These systems will face a similar challenge that electrical and other
underground utilities will face in the future. The gravity fed drainage systems and lift stations
will likely need to be installed and designed based on projections. Dewatering and other
engineering difficulties that would be faced under future conditions would make these solutions
economically impossible. However, pump design and improvement can be done incrementally as
water levels rise. This will only be a first step in an organized retreat.
In many cases, rural areas and isolated properties may never be viable options for
addition to public utilities. Our research suggests that regulations should be put into place that
require all future installations of septic systems in the lower coastal plain of Georgia to be built
above grade. This is the required practice in many states, including nearby Florida, where
groundwater resources are vital to the state economy. These regulations generally require septic
tanks and drainage fields to be installed above current ground level and then bermed with soils
appropriate for proper drainage. This design allows for the necessary drainage required for
effective aerobic biodegradation of wastewater prior to reaching groundwater, or limits
concentrations of hazardous compounds in wastes to a manageable limit.
There are numerous projection models for sea level rise in the next century. Our models
are based on fairly conservative versions of these, and many show greater than 1m of sea level
rise by 2100. Similar projections show regional sea level rise will likely be even more prolific
28
rise, will be the determining factor in how our coastal areas will manage future development,
infrastructure, and emergency management. Our research shows that sea level rise alone will not
be the only threat to these areas, and that the inland coastal plain will likely be as much affected
29
5 CONCLUSIONS
In discussion of future sea level rise, options for future land use are often limited to three
choices, adapt, defend, and retreat. Due the slow-moving nature of sea level rise, combined with
population increase and high property values for coastal real estate, these options are sure to be
contentious. Government planning does not typically work on these time scales. However, as
flood insurance rates and mortgage banks begin to react to continuing research these will have
impacts on the built environment in the Georgia Coastal Plain. This creates a scenario where an
“organized retreat” will be necessary. Private citizens, local, state, and federal governments will
need to be planning in the time range of 30-50 years. These decisions need to be made with an
awareness that these impacts will not be limited to surficial inundation and that rising
30
REFERENCES
Bush, Chelsea E., Farley, Lori A., Meyer, Brian K., Vance, R. Kelly and Reichard, James S.,
2016. Investigation of the Shallow Groundwater System: Wormsloe State Historic Site,
Chatham County, Georgia. Southeastern Section Geological Society of America, 65th
Annual Meeting, Columbia, SC.
Cai, Lin and Zhang, Tong, 2013. Detecting Human Bacterial Pathogens in Wastewater
Treatment Plants by a High-Throughput Shotgun Sequencing Technique. Environmental
Science and Technology, 47, 5433-5441
Clarke JS, Hacke CM, Peck MF. 1999. Geology and Ground-Water Resources of the Coastal
Area of Georgia. Bulletin 113, Georgia Geological Survey, Department of Natural
Resources.
Conn, Kathleen E., Barber, Larry B., Brown, Gregory K., and Siegrist, Robert L., 2006.
Occurrence and Fate of Organic Contaminants During Onsite Wastewater Treatment.
Environmental Science and Technology, 40, 7358-7366.
Cooper HM, Fletcher CH, Chen Q, Barbee MM. 2013. Sea level rise vulnerability mapping for
adaptation decisions using LiDAR DEMs. Progress in Physical Geography 37: 745–766.
Hails, J.R. and J.H. Hoyt, 1969. An Appraisal of the Evolution of the Lower Atlantic Coastal
Plain of Georgia, U. S. A. Transactions of the Institute of British Geographers, No. 46:
53-68.
Horton BP, Rahmstorf S, Engelhart SE, Kemp AC. 2014. Expert assessment of sea-level rise by
AD 2100 and AD 2300. Quaternary Science Reviews 84: 1–6.
Hoyt, J.H., and J.R. Hails. 1967. Pleistocene shoreline sediments in coastal Georgia: depositional
31
http://bryancountyga.org/about-us/living-here/statistics-demographics (Accessed 18th January,
2019)
Jevrejeva S, Moore JC, Grinsted A. 2012. Sea level projections to AD2500 with a new
generation of climate change scenarios. Global and Planetary Change 80–81: 14–20.
LaForge, L., and Cooke, C.W., 1925. Physical Geology of Georgia, Georgia Geological Survey
Bulletin 42, 189 pp.
Levy, Karen, Woster, Andrew P., Goldstein, Rebecca S., and Carlton, Elizabeth J., 2016.
Untangling the Impacts of Climate Change on Waterborne Diseases: a Systematic Review of
Relationships Between Diarrheal Diseases and Temperature, Rainfall, Flooding, and
Drought. Environmental Science and Technology, 50, 10, 4905-4922.
Manda AK, Sisco MS, Mallinson DJ, Griffin MT. 2015. Relative role and extent of marine and
groundwater inundation on a dune-dominated barrier island under sea-level rise scenarios.
Hydrological Processes 29: 1894-1904.
MacNeil, F.S., 1950. Pleistocene Shore Lines in Florida and Georgia. United States Geological
Survey Professional Paper No 221-F, 107 p.
Minnesota Pollution Control Agency, 2009. Low Dissolved Oxygen in Water: Causes, Impact on
Aquatic Life., Water Quality/Impaired Waters, 3.24, February 2009.
Nicholls, Robert J. and Cazenave, Anny, 2010. Sea Level Rise and Its Impact on Coastal Zones.
Science, Vol. 328, Issue 5985, pp. 1517-1520. January 2017.
Nicholls, Robert J., 1995. Coastal Megacities and Climate Change. Geojournal, 37, 3, 369-379.
NOAA Technical Report NOS CO-OPS 083. Global and Regional Sea Level Rise Scenarios for
32
Ogeechee River at US 17, near Richmond Hill, GA
https://nwis.waterdata.usgs.gov/nwis/inventory/?site_no=02203536&agency_cd=USGS&am
p; (Accessed: 19th December, 2018)
Provost, Alden M., Payne, Dorothy F., and Voss, Clifford I. Simulation of Saltwater Movement
in the Upper Floridian Aquifer in Savannah, Georgia-Hilton Head Island, South Carolina
Area, Predevelopment-2004, and Projected Movement for 2000 Pumping Conditions. United
States Geologic Study, Scientific Investigations Report 2006-5058.
Rotzoll K, Fletcher CH. 2013. Assessment of groundwater inundation as a consequence of
sea-level rise. Nature Climate 3: 477–481.
State of Florida, Department of Health, Chapter 64E-6, Florida Administrative Code, Standards
for Onsite Sewage Treatment and Disposal Systems, cited January 27, 2019.
State of Georgia, Department of Public Health, Environmental Health Section, Manual for
On-Site Sewage Management Systems
US Census Bureau. Census.gov at: https://www.census.gov/. (Accessed: 18th January, 2019)
"US Gazetteer files: 2010, 2000, and 1990". United States Census Bureau at
https://www.census.gov/, 2011-02-12. (Accessed: 18th January, 2019)
Wilson, Steven G. and Fischetti, Thomas R., 2010. Coastline Population Trends in the United
33
APPENDICES