International Journal of Emerging Technology and Advanced Engineering
Website: www.ijetae.com (ISSN 2250-2459, ISO 9001:2008 Certified Journal, Volume 4, Issue 7, July 2014)
590
Intelligent Pothole Detection System
Himanshu Punjabi
1, Ruchika Nanwani
2, Aakash Vaswani
3, Raunak Jotwani
4, Dr. Ashwini Kunte
5 1,2,3,4Thadomal Shahani Engineering College
2
Vice-principal and Head of Department Thadomal Shahani Engineering College
Abstract—This paper aims at proposing a versatile Pothole Detection System which assists the driver in avoiding potholes on the roads, by giving prior warnings. The basic idea of this system is to detect the pothole at a distance from which driver is driving the vehicle, to alert the driver if pothole is arriving in the way to reduce the speed of the vehicle or take another path. This paper presents a detailed description of the system based on image processing developed to process and analyze the dataset captured using the camera mounted on the car that gives high efficiency and accuracy compared to the conventional methods of pothole detection.
Keywords— Edge, False Rejection Rate, Filters, Pothole, Segmentation, True Acceptance Rate
I. INTRODUCTION
The ever increasing apathy of the road development authorities is one of the major reasons for the increasing road mishaps. Potholes trigger majority of such mishaps. While driving in the night just the headlights might not suffice in assisting the driver to detect the presence of the pothole. Many other unexpected hurdles on road apart from potholes may cause severe consequences. Abysmal road conditions cause wastage of precious fuel, wear and tear of the tyre and damage to the vehicle. All these reasons demand that it is important to collect information of such bad road conditions and through a series of processing and
analyzing the obtained information, appropriate
conclusions are derived which in turn, warn the driver. In the information gathering phase, a vehicle with a camera mounted on its front end travels along the road, thereby capturing images of the road. Henceforth in the analyzing phase, this data will be processed by an algorithm to detect potholes along the path travelled earlier by the vehicle. It is this algorithm which will determine the reliability of the pothole detection by the system in place. For this purpose, the algorithm has to identify edges that are caused exclusively by potholes on the road. However, unwanted disturbances that are treated by the system as noise would affect the ultimate outcome. To overcome this problem, the dataset has to be pre-processed before the algorithm can use the dataset to detect potholes. The system would then evaluate an index which would clearly differentiate the pothole and the non-pothole road. On the basis of this evaluated index, an alert will be generated by the system.
A. Dataset
Video has been captured using a camera mounted on the car. Frames of the video are extracted and the individual frame is considered as an image which is further processed. Resolution of the plain road image and the pothole image has been kept the same to ensure compatibility and minimum processing time. While capturing the images, the maximum horizontal distance between camera and the road is maintained at approximately 5 meters i.e. 196.8 inches and maximum vertical distance between the camera and the ground level at approximately 0.25 meters i.e. 9.84 inches.
II. METHODOLOGY AND IMPLEMENTATION
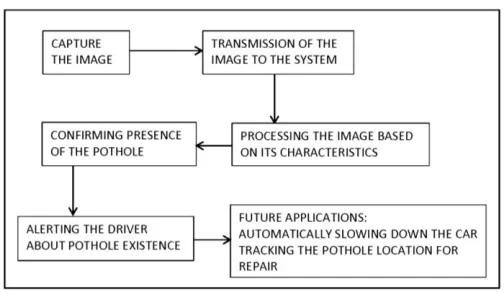
A. Block Diagram of the System
Figure 1 represents the basic flow of the Intelligent Pothole Detection System.
Figure 1 Functional Block Diagram Of The Intelligent Pothole Detection System
B. Flow Chart of the System
Figure 2 represents the functional algorithm of the Intelligent Pothole Detection System.
C. Approaches for Pothole Detection using Segmentation
In computer vision, image segmentation is the process of partitioning a digital image into multiple segments (sets of pixels, also known as super pixels). The goal of
segmentation is to simplify and/or change the
[image:1.612.324.576.408.555.2]International Journal of Emerging Technology and Advanced Engineering
Website: www.ijetae.com (ISSN 2250-2459, ISO 9001:2008 Certified Journal, Volume 4, Issue 7, July 2014)
591
[image:2.612.52.276.150.417.2]Image segmentation is typically used to locate objects and boundaries (lines, curves, etc.) in images. More precisely, image segmentation is the process of assigning a label to every pixel in an image such that pixels with the same label share certain visual characteristics. [1]
Figure 2 Functional Flow Chart Of The Intelligent Pothole Detection System
The result of image segmentation is a set of segments that collectively cover the entire image, or a set of contours extracted from the image. Each of the pixels in a region is similar with respect to some characteristic or computed property, such as color, intensity, or texture. [1]
Edge detection is a well-developed field on its own within image processing. Region boundaries and edges are closely related, since there is often a sharp adjustment in intensity at the region boundaries. Edge detection techniques have therefore been used as the base of another segmentation technique. The edges identified by edge detection are often disconnected. To segment an object from an image however, one needs closed region boundaries. The desired edges are the boundaries between such objects. [1]
Sobel Edge detection and Prewitt Edge Detection are the two techniques which have been implemented on the captured dataset.
Algorithm used for the Pothole Detection using Segmentation is as follows:
STEP 1: Convert captured images of both plain road and pothole from a color image to GREY image as eye is more sensitive to luminance components and processing of image becomes faster.
STEP 2: Nonlinear (nl) filter is used to remove unwanted disturbance i.e. low frequency components and to preserve high frequency components, which is the edge of the pothole image.
Nonlinear filters can be described in a mathematical sense as an operator L(.), which maps a signal x into a signal y as y=L(x), where the operator L is not linear. The
lack of satisfaction of the superimposition or
proportionality principles or both does not allow obtaining the output of a nonlinear filter by convoluting the input with its impulse response function. For this reason different families of nonlinear filters have been studied, each of which has a different characterization which makes the filters in this class amenable to some form of mathematical analysis.
The simplest possible nonlinear transformation of the form of y=L(x) corresponds to a memory less nonlinearity that maps the signal x to y. Such transformations have been used extensively in image processing and are called grey scale transformations. [2]
STEP 3: Next step is to detect an edge. Sobel edge detection technique as well as Prewitt Edge Detection is used (as noise is completely removed from these techniques.)
Standard Approaches: Figure 3 demonstrates the segmented images obtained after application of the Prewitt and Sobel edge detection techniques.
(A) (B)
(C) (D)
[image:2.612.329.558.494.687.2]International Journal of Emerging Technology and Advanced Engineering
Website: www.ijetae.com (ISSN 2250-2459, ISO 9001:2008 Certified Journal, Volume 4, Issue 7, July 2014)
592
Out of the two methods used above, P rewitt is considered to be the best suitable technique for image segmentation as it removes noise from an image completely and gives the sharp edge of the pothole. This operator does not place any emphasis on pixels that are closer to the center of the mask. Prewitt operator measures two components i.e. horizontal edge component which is
measured as kernel Gx and the vertical edge component
which is measured as kernel Gy. Magnitude of Gx and Gy
gives the intensity of the gradient in the current pixel. [1]
The mask for Prewitt Edge Detection Technique is as (Gx
and Gy respectively): [1]
Gx = (z7+z8+z9) - (z1+z2+z3)
Gy = (z3+z6+z9) - (z1+z4+z7)
D. Parametric Approaches for Pothole Validation
Edge of the pothole is previously detected, now comparison of plain road image with the captured image is done to validate the presence of a pothole. For that the following are the Parametric Approaches undertaken:
1. The first parametric approach is Pixel Information
Calculation.
2. Second approach is calculating 1st order moment
3. Third approach is calculating 2nd order moment.
4. Fourth approach is calculating cross-correlation between
two images.
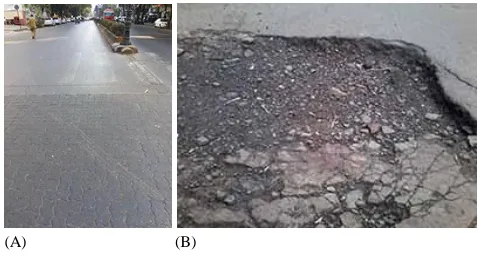
Figure 4 demonstrates the image of plain road which is the reference image and the image of the pothole road.
(A) (B)
Figure 4 (A) Plain Road And (B) Pothole Road
Pixel Information Calculation: The number of pixels having specific grey level in the plain road image in the dataset and the captured image of the road is calculated.
Based on the predefined threshold value, the presence of a pothole is determined.
1st Order Moment: In this method, the 1st order moment
of the plain road image and the 1st order moment of the
image of the road in consideration are calculated. If the 1st
order moment value of the road image in consideration is lesser than the predefined threshold value, then image on the road is a pothole image and driver is given an alert message to reduce speed of vehicle.
2nd Order Moment: In this method, the 2nd order
moment of the plain road image and the 2nd order moment
of the image of the road in consideration are calculated. If
the 2nd order moment value of the road image in
consideration is greater than the predefined threshold value, then image on the road is a pothole image and driver is given an alert message to reduce speed of vehicle.
The central moments of third order are given by the equation 2.1 as:
---(2.1)
where f(x,y) is the intensity value at (x,y) coordinates of
the image. [3]
Cross-Correlation: Cross-correlation is carried out between the binary plain image in the dataset and the captured image of the road. If the cross-correlation value is greater than threshold, the image on the road is pothole image.
The cross-correlation of two real continuous functions, xy given by the equation 2.2 as:
[image:3.612.58.276.244.295.2] [image:3.612.48.287.531.661.2]International Journal of Emerging Technology and Advanced Engineering
Website: www.ijetae.com (ISSN 2250-2459, ISO 9001:2008 Certified Journal, Volume 4, Issue 7, July 2014)
593
In the discrete domain, the correlation of two real time series
xi,i = 0, 1, …, M-1 and
yj,j = 0, 1, …, N-1
is given in equation 2.3 as:[4]
---(2.3)
III. RESULT AND ANALYSIS
Image segmentation technique and all the four parametric approaches have been applied on the images from the dataset. Figure 5 enlists the Pothole Images and Figure 6 enlists the Plain Road Images on which the processing has been carried out.
Image 1 Image 2 Image 3 Image 4
[image:4.612.308.579.155.434.2]Image 5
Figure 5 Sample images of Pothole Road
Image 6 Image 7 Image 8
Figure 6 Sample Images of Plain Road
A. Observations
Table I lists the observations. Values obtained after 2nd
order moments have been normalized. Image 8 is used as a
reference image for Cross-Correlation approach. Cxy (MIN)
= 0.0988.
Table I
Results observed after the comparison of the two types of images captured based on Parametric Approaches
Image No. /
Parametric Approach
Normalized
Cross-Correlation values (CXY - CXY(MIN) )
1st Order
Moment
(Mean)
Normalized
2nd Order
Moment
(Variance)
Pixel Information Calculation
Image 01 0.0244 0.9684 0.2512 1301
Image 02 0 0.9654 0.97603 1427
Image 03 0.0238 0.9655 0.65862 1423
Image 04 0.0174 0.9644 0.40979 1466
Image 05 0.0193 0.9688 0.29036 1367
Image 06 0.0526 0.9942 0.0086235 214
Image 07 0.0228 0.9922 0.01917 566
Observations obtained from the processing of the dataset will be investigated by reliable decisions of False and True outcome rates. The test idea based on calculating the ratio of correctness matches to the total samples as True Rate (TR) or the True Acceptance Rate (TAR), while the False Rate (FR) or the False Acceptance Rate (FAR) was taken as results of false matches to the total samples. These parameters are required to calculate and compare the efficiency of the four parametric approaches. [5]
[image:4.612.55.281.336.549.2]International Journal of Emerging Technology and Advanced Engineering
Website: www.ijetae.com (ISSN 2250-2459, ISO 9001:2008 Certified Journal, Volume 4, Issue 7, July 2014)
594
True Acceptance Ratio (TAR) can be defined as the ratio of number of potholes that are detected by the algorithm as pothole images successfully to the number of total pothole images. False Acceptance Ratio (FAR) can be defined as the ratio of number of plain road images which are detected as pothole images to the number of plain road images. [6]
Threshold can be defined as a boundary value to distinguish between a pothole and a plain road image.
[image:5.612.325.573.118.264.2]Table II given below illustrates the observations from the analysis of the results obtained based on parametric approaches. A Threshold Value for each of the four parametric approaches has been decided based on the results cited in Table I. According to the threshold decided, True Acceptance Rate, False Acceptance Rate and Efficiency of the parametric approaches have been obtained, considering the images in the database. Figure 7 gives the graphical analysis of the efficiencies of the parametric approaches.
Table II
Observations after Parametric Approaches
Parametric
Approach Title.
Threshold True Acceptance
Ratio
(TAR)
False
Acceptance
Ratio
(FAR)
Efficiency
(%)
Pixel
Information
Calculation
750 15/15 1/15 93%
1st Order
Moment
0.98 15/15 0/15 100%
C r o s s
-Correlation
Calculation
-0.06 15/15 4/15 73%
2nd Order
Moment
1x10⁻⁴ 15/15 0/15 100%
Figure 7 Observations After Parametric Approaches
IV. CONCLUSION
Prewitt Edge Detection technique was used for pre-processing as it proved to be the most efficient noise removal technique. Considering the results obtained after
the analysis, it is concluded that 1st Order Moment
Calculation and 2nd Order Calculation are two parametric
approaches that give the best efficiency for validation of the pothole from the considered samples of Plain Road Images as well as Pothole Road Images.
A. Advantages
1. The Intelligent Pothole Detection System instructs the
driver to reduce the speed of vehicle if there is a pothole on the road.
2. The Pothole Detection System directly or indirectly
saves the life of many human beings.
3. The Pothole Detection System gives a clear indication
of number of potholes in the city to Municipality and gives a clear indication for maintenance of roads.
4. Intelligent Pothole Detection System via GPS
technology can upload the area where the pothole is intense so that other drivers can be alerted before they come across such roads.
B. Limitations
[image:5.612.43.293.358.613.2]International Journal of Emerging Technology and Advanced Engineering
Website: www.ijetae.com (ISSN 2250-2459, ISO 9001:2008 Certified Journal, Volume 4, Issue 7, July 2014)
595
REFERENCES
[1] Rafael C. Gonzalez, Richard E. Wood, Steven L. Eddins, Digital Image Processing Using Matlab.
[2] Ioannis Pitas, Anastasios N. Venetsanopoulos, Nonlinear Digital Filters.
[3] Sabyasachi Dey, Bhargab B. Bhattacharya and Malay K. Kundu , Tinku Acharya, ―A Simple Architecture for computing Moments and Orientation of an Image‖.
[4] Cross-Correlation
http://www.ocean.washington.edu/courses/ess522/2010/lectures/08_ xcorr.pdf
[5] Al Tarawneh Mokhled, ―Fingerprint Image Processing For Generating Biometric Cryptographic Key‖.