Effects of Size and Allocation Method on Stock Portfolio Performance:
A Simulation Study
Keat-Yung Ng and Kim-Leng Goh
Faculty of Economics & Administration, University of Malaya, Kuala Lumpur, Malaysia
Abstract.
This paper examines the performance of portfolios of stocks listed in the Malaysian exchange through a simulation study. The effects of different portfolio sizes and fund allocation methods on return per unit of risk, or risk reward, were analyzed. Risk rewards increase with the inclusion of a larger number of stocks in a portfolio but at a decreasing rate. The results show that a portfolio size of 11 stocks is generally sufficient to generate reasonable risk rewards. The results, confirmed by holdout validation, also suggest that the conditional optimal and minimized variance allocation methods yield high risk reward, while the equal weight method has the poorest performance.Keywords:
optimization, return, risk reward, simulation.1.
Introduction
The number of stocks to be included and the method to allocate funds among the selected stocks are two important criteria in forming a stock portfolio. Many of the studies conducted to find optimal portfolio size did not reach a consensus, and some even suggested that large portfolios with 30 stocks or more may not be well diversified [1, 2]. Another dimension of problem to portfolio formation is that the unconstrained portfolio optimization as implied in the Markowitz’s mean-variance approach introduces difficulty in arriving at an optimal solution that is practical [3]. Constrained optimization methods are recommended to avoid complex unrealistic solutions. Taking these difficulties into consideration, this study explores for strategies for creating portfolios consisting of stocks listed in the Malaysian stock market. Using a simulation study, we attempt to determine the preferred portfolio size and method of fund allocation. Many studies [2, 4] compared the risk performance of portfolio in the context of the modern portfolio theory where risk (typically the variance) is minimized for a given level of expected return. We propose the use of risk reward in our analysis of portfolio performance because evaluation of portfolio based on variance has a weakness in its implicit assumption of a constant mean return. Further, both mean returns and variance were shown to decline [5] as portfolio size increases.
2.
Data and Sample Period
The sample of this study is the component stocks of the Kuala Lumpur Composite Index (KLCI). A portfolio created from the component stocks of KLCI has the advantages of liquidity, protection and diversification (see [5]). The price data were obtained from the Perfect Analysis database, while data on dividends and capital changes were extracted from the Perfect Analysis database, KLSETRACKER.COM and Bursa Malaysia Company Announcements. The average one-month fixed deposit interest rate was used as the risk-free rate, and stock returns were adjusted for capital changes including rights issue, bonus issue, capital repayment, share split and reverse split. Monthly data from January 2000 through May 2006 (estimation period) were used to determine the weight for each stock in the portfolio. The data from June 2006 through May 2007 were used for holdout validation (holdout period). A total of 83 component stocks were selected and the remaining 17 stocks were excluded because of incompleteness due to new listing or suspension over a long period.
3.
Performance Measure and Allocation Methods
The portfolio return is computed as
∑
=
= N
J J J P w R
R 1
where 1 100%
1 1
1+ ×
− = ∑ = − − T i i i i J P D P P T
R , J = 1, 2, ...,
N,
w
J is the proportion of investment on stock J in the portfolio,P
i is the end-of-month price of stock J in month i,D
is dividend, Nis the number of stocks in the portfolio andT
is the total number of observations.The portfolio risk is measured by standard deviation given by
∑ ∑
= =
= N
J N
K J K JK P w w S
S 1 1 where ) 1 /( ) )( (
1 − − −
=
∑
= R R R R T
S T
i Ji J Ki K
JK , J = K = 1, 2, ..., N,
R
Ji andR
Ki are the monthly returns of stock J andstock K in month i respectively. The risk reward for measuring portfolio performance is defined the average return per unit of risk given by Rp/Sp.
Conditional optimal, equal weight, minimized variance and minimized standard error allocation methods were considered. The conditional optimal allocation method maximizes (Rp−Rf)/Sp, where Rf is the risk free rate, subject to:
1 1 =
∑
= N J Jw (1)
2 . 0 1 ×
≥ N
wJ (2)
7 . 0
3 ≤
= then wJ
N
if (3)
6 . 0
5 ≤
= then wJ
N
if (4)
) / 5 , 5 . 0 ( minimum
7 then w N
N
if ≥ J ≤ (5)
Constraint (2) is set to avoid small weights so that no stock in the portfolio is under represented. Constraints (3), (4) and (5) are to eliminate excessively big weights being assigned to one single stock. Constraint (5) is to keep the weights no greater than five times of the equal weight, but subject to a maximum of 50 percent.
The equal weight allocation method assigns a weight of
N
wJ = 1 . The weight for the minimized variance
allocation method is given by (1 )/( (1 ))
1 2 2
∑
= = N K K JJ S S
w . The minimized standard error allocation method uses
the weight (1 )/( (1 ))
1
∑
= = N K K JJ SE SE
w where SEKis the standard error of the capital asset pricing model
estimated by regressing the returns of individual stock on the market returns computed from KLCI.
4.
Simulation and Results
A simulation was performed to examine how portfolio size and allocation method affect risk reward. Stocks were selected randomly and portfolios with size 3, 5, 7, 9, 11, 13, 15, 18, 20, 25, 30, 35, and 50 were formed. The simulation assumes that investors will make a monthly adjustment on the allocation of their portfolios following any price changes so that the initial proportion of fund allocation in the portfolio is maintained. The simulation process was repeated for replication sizes of 10, 30, 50, 100, 200, and 500.
The weight for each stock in the portfolio was derived according to the four allocation methods using data for the estimation period. The risk rewards were computed for each portfolio. The same proportions of allocation to each stock in the portfolio were used in the holdout validation to examine the robustness of the results.
with those of the within-sample analysis. While the conditional optimal method yields the highest risk reward, its superiority does not hold for the holdout period. The second best minimized variance method in the estimation sample turned to yield the highest risk reward for the portfolios constructed for the holdout sample.
[image:3.595.59.538.415.618.2]Fig. 1: 95% Confidence interval for risk rewards of portfolios by number of stocks – Ex-post analysis
Fig. 2: 95% Confidence interval for risk rewards of portfolios by number of stocks – Ex-ante analysis
variance and minimized standard error allocation methods require at least 20 and 11 stocks, respectively. Overall, the optimal size is higher than that suggested from the within-sample analysis.
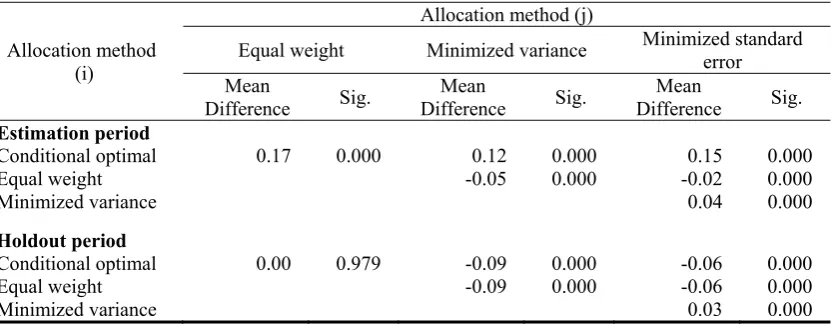
[image:4.595.66.505.237.514.2]The results in Table 2 show that a portfolio’s risk reward is related to the method of allocation. The Games-Howell comparison procedure indicates that the mean difference of risk reward between each allocation method is highly significant, and this is true of both the sample periods. For the estimation period, the conditional optimal method is the best, followed by the minimized variance allocation method. In contrast, the equal weight method provides the lowest risk reward. When extended to the holdout sample period, the minimized variance method generates the highest value of risk reward.
Table 1: Groups of portfolio with homogeneous risk rewards using Games-Howell procedure
Group Conditional optimal Equal weight Minimized variance Minimized standard error Estimation period
1 3 3, 5 3 3
2 5 5, 7, 9, 11, 13, 15 5, 7, 9 5, 7, 9, 11, 13, 15, 20
3 7 7, 9, 11, 13, 15, 18, 20 7, 9, 11, 13 7, 9, 11, 13, 15, 18, 20
4 9 7, 11, 13, 15, 18, 20, 25 7, 11, 13, 15 7, 11, 13, 15, 18, 20, 25, 30, 35
5 11, 13 11, 18, 20, 25, 30, 35 11, 13, 15, 18, 20 7, 11, 18, 20, 25, 30, 35, 50
6 13, 15 30, 35, 50 15, 18, 20, 25
7 18, 20 18, 20, 25, 30, 35
8 25 25, 30, 35, 50
9 30, 35
10 50
Holdout period
1 3 3 3 3
2 5, 7, 9 5, 7 5 5, 7
3 7, 9, 11 7, 9 7, 9 7, 9
4 11, 13, 15 9, 11 11, 13, 15 9, 11
5 13, 15, 18 11, 13, 15 18, 20, 25 11, 13, 15
6 15, 18, 20 13, 15, 18 20, 25, 30 18, 20, 25
7 18, 20, 25, 18, 20, 30 25, 30, 35 20, 25, 30, 35
8 35, 50 20, 25, 30, 35 30, 35, 50 35, 50
9 25, 35, 50
Table 2: Mean difference (i – j) of risk rewards between allocation methods using Games-Howell procedure
Allocation method (i)
Allocation method (j)
Equal weight Minimized variance Minimized standard error Mean
Difference Sig.
Mean
Difference Sig.
Mean
Difference Sig. Estimation period
Conditional optimal 0.17 0.000 0.12 0.000 0.15 0.000
Equal weight -0.05 0.000 -0.02 0.000
Minimized variance 0.04 0.000
Holdout period
Conditional optimal 0.00 0.979 -0.09 0.000 -0.06 0.000
Equal weight -0.09 0.000 -0.06 0.000
[image:4.595.64.482.573.735.2]5.
Conclusion
This paper shows that both portfolio size and allocation method affect the performance of a portfolio. Increasing portfolio size yields higher return per unit of risk, albeit at a decreasing rate. While the simulation suggests an optimal portfolio size that ranges from 5 to 20 stocks, most of the allocation methods yield reasonably high risk reward with a portfolio size of about 11 stocks. The allocation method of minimized variance generates a high risk reward, while the equal weight method has the poorest performance.
6.
References
[1] D.L. Domian, D.A. Louton, M.D. Racine. Diversification in portfolios of individual stocks: 100 stocks are not enough. Finan. Rev. 2007, 42(4): 557-570.
[2] M. Statman. How many stocks make a diversified portfolio. J. Finan. Quant. Anal. 1987, 22(3): 353-363. [3] T. J. Chang, N. Meade, J.E. Beasley, and Y.M. Sharaiha. Heuristics for cardinality constrained portfolio
optimisation. Comput. Oper. Res. 2000, 27(13): 1271-1302.
[4] W. H. Wagner and S.C. Lau. The effect of diversification on risk. Financ. Anal. J. 1971, 27(6): 48-53.