PID Control for Anesthesia Using Genetic
Algorithms
Hugo Araujo, Bo Xiao, Chuang Liu, Yanbin Zhao, H. K. Lam
Department of Informatics, King’s College London, London, UK
Email: [email protected], [email protected], [email protected], [email protected], [email protected]
Received 19 March 2014; revised 19 April 2014; accepted 25 April 2014
Copyright © 2014 by authors and Scientific Research Publishing Inc.
This work is licensed under the Creative Commons Attribution International License (CC BY). http://creativecommons.org/licenses/by/4.0/
Abstract
This paper presents the automatic drug administration for the regulation of bispectral (BIS) index in the anesthesia process during the clinical surgery by controlling the concentration target of two drugs, namely, propofol and remifentanil. To realize the automatic drug administration, real clini- cal data are collected for 42 patients for the construction of patients’ models consisting of pharma- cokinetic and pharmacodynamic models describing the dynamics reacting to the input drugs. A nominal anesthesia model is obtained by taking the average of 42 patients’ models for the design of control scheme. Three PID controllers are employed, namely linear PID controller, type-1 (T1) fuzzy PID controller and interval type-2 (IT2) fuzzy PID controller, to regulate the BIS index using the nominal patient’s model. The PID gains and membership functions are obtained using genetic algorithm (GA) by minimizing a cost function measuring the control performance. The best train- ed PID controllers are tested under different scenarios and compared in terms of control perfor-mance. Simulation results show that the IT2 fuzzy PID controller offers the best control strategy regulating the BIS index while the T1 fuzzy PID controller comes the second.
Keywords
Anesthesia, Propofol, Remifentanil, BIS, PID, Fuzzy, Control, Simulation, Close-Loop
1. Introduction
covery [1]. The depth of anesthesia (DOA) represents the level of consciousness [2], which is to be controlled through the process of anesthesia for varieties of control targets such as steady error, settling time, and overshoot. In general, control strategies can be categorized into two classes: open-loop control and closed-loop control. In open-loop control, based on the knowledge and experience, anesthetists manually adjust the drug dosage to maintain the DOA assisted by some clinical indices of patients. In closed-loop control, the drug dosage is auto- matically adjusted according to some indices of DOA, which makes control input continuous and responsive [3]. Closed-loop control is also expected to avoid over- and under-dosage and suppress the adverse effect of inter- individual differences [4]. Despite of its advantages, the stability of closed-loop control needs to be ensured due to the automated process without supervision [5].
To achieve the stabilization based on closed-loop control, the following components are required [6]: 1) a pa-tient model, with an output as the index of DOA; 2) a controller for stabilization, such as proportional-integral- differential (PID) controllers. Therefore, to begin with, an estimated patient model is required to represent real patients supporting the control design and performance evaluation. A widely employed mathematical model consists of a linear pharmacokinetic (PK) model and a nonlinear pharmacodynamic (PD) model [7]. The PK mo- del uses the drug dosage as the input and the drug concentration as the output. In what follows, the PD model exploits the drug concentration as the input and exports the index of DOA.
As stated above, the control input of the overall patient model is the drug dosage. According to the types of drugs, the anesthesia can be classified to inhalational and intravenous anesthesia. Inhalational anesthesia has been used since the mid-19th century with for instance nitrous oxide, isoflurane, and halothane as commonly used drugs [8]. In contrast, intravenous anesthesia with propofol and remifentanil as commonly used drugs [9] has the following advantages [10]: separate provision of anesthesia from ventilation, reduced atmospheric pollution, rapid and clear-headed recovery, and so on. While inhalational anesthesia is still frequently used for children, in- travenous anesthesia becomes more and more popular due to the rapid and safe transition [11].
Main difficulties involved in modeling are the determination of PD model parameters and the selection of the output index. In general, the parameters of PK and PD models need to be determined beforehand. For the PK mo- del, parameters can be estimated depending on sex, age, and weight of patients. Nonetheless, for the PD model, it is not possible to estimate the parameters for certain patient. Accordingly, it requires the controller to be ro-bust in a domain of PD model parameters [12]. Although PK model parameters are varied with patients and PD model parameters are even changing for one patient, a general index can be designed to evaluate the DOA for all patients [13]. The bispectral (BIS) index [14] is an extensively accepted index to measure the DOA. It is a uni- variate dimensionless parameter from 0 to 100, which is devised from a large set of electroencephalogram (EEG) data [15].
With regard to the controllers for stabilization, several control problems are faced for the closed-loop control of anesthesia: stability, which is the basic control objective; robustness, which overcomes the uncertainty of PD model parameters, measurement noise, surgical stimulation, and so forth; adaptiveness, which makes the troller adaptive to different patients rather than only one patient. Commonly used controllers include PID con-trollers, model-based concon-trollers, and knowledge-based controllers [6].
To close the loop of control systems, classical PID controller is a doubtless option due to its successful appli-cations in other areas. For stabilization, it is necessary to tune the parameters of PID controllers for a certain pa-tient model. While the tuning process is an empirical manner, some tuning schemes were even developed to gua- rantee the robustness [16] [17]. Combined with patient model identification from the induction phase of anesthe- sia [18], the adaptiveness can be further achieved. In addition, combined with genetic algorithm (GA), the para- meters of PID controllers can also be online optimized [19].
Despite of various causes of the changes in PK and PD model parameters, the model-based controller relies on the current model which reflects the patient’s current pharmacological behavior. For this reason, the patient model needs to be updated through the overall process of anesthesia. This online adaptation can be achieved by several approaches such as Kalman filter algorithm [20], Bayesian-based adaptive control [21], and adaptive ge- netic fuzzy clustering algorithm [19]. Alternatively, the variability of PK and PD models between individuals as well as surgical stimulation and anesthetic-analgesic interaction can be explicitly considered offline such that the stability is mathematically guaranteed [22]. Additionally, a Lyapunov-based adaptive controller was developed to attain partial asymptotic regulation [23].
Due to the advantages of closed-loop control, in this paper, we aim to implement the closed-loop control for anesthesia model. The performance of controllers is ensured by simulation and optimization. For the anesthesia model used in this paper, while existing anesthesia model is utilized, the parameters of PD model are specially obtained from clinical data collected from 42 patients. Following the same design procedure, these tailor-made controllers can be redesigned for other patients as long as clinical data have been collected. In the anesthesia model, the co-administration of both propofol and remifentanil is investigated. To realize the drug administra-tion, we propose two groups of strategies: two fuzzy PID controllers and one fuzzy PID controller with scaling factors. For each group of strategies, linear PID controller, type-1 (T1) fuzzy PID controllers and IT2 fuzzy PID controllers are designed. To draw a distinction from existing IT2 fuzzy PID controllers, we combine IT2 fuzzy PID controllers with GA. All PID gains, scaling factors and parameters of membership functions are optimized by GA in an offline manner subject to a performance index (cost function) which quantifies the performance of the controllers. A BIS training profile which sets different local targets for regulation considering the real anes-thesia situation is employed for training purposes. The trained PID control strategies will be tested by a testing profile to verify their performance towards unseen working conditions. Comparisons are made among all con-trollers to demonstrate the characteristics of each control strategy.
Following sections are organized in this sequence: in Section 2, a multivariable anesthesia model used in this paper is described; in Section 3, the control background of linear PID controller, T1 fuzzy PID controllers and IT2 fuzzy PID controllers is introduced; in Section 4, we design all the control strategies and overall procedure and necessary information of the simulation; in Section 5, simulation results are provided and comparison and analysis are carried out; finally in Section 6, a conclusion is drawn.
2. Multivariable Anesthesia Modeling
In this section, the anesthesia model with two drugs is introduced. As shown inFigure 1, the anesthesia model consists of the target controlled infusion (TCI) system, the PK model, and the PD model, where Cptprop and
remi
Cpt are plasmatic concentration targets, Ip and Ir are infusion rates, Cpprop and Cpremi are plasmatic concentrations, Ceprop and Ceremi are effect-site concentrations, and the subscript prop and remi are for propofol and remifentanil, respectively. Details of each module are described in the following subsections. The clinical protocol for obtaining the parameters of PD model is also described.
2.1. Pharmacokinetic Modeling
PK model is applied to reckon the relation from the drug infusion rate and the amount of drugs to plasmatic concentration
( )
Cp and effect-site concentration( )
Ce . In this paper, we utilize the PK model from Marsh [27]and Minto [28] for propofol and remifentanil, respectively. A three-compartmental structure of these PK models is presented in Figure 2which can be formulated by the following dynamic system:
Figure 2. Structure of a three-compartmental PK model with effect-site com- partment [29].
( )
( )
( )
,( )
( )
,x t =Fx t +Gr t y t =Cx t (1)
( )
( )
( )
( )
( )
( )
( )
( )
10 12 13 21 31 1 12 21 2 13 31 3 0 0 1 1 0 0 0 1
where , , 0 0 ,
60
0 0
1
1
0 0 0
0 1
, ; 0
60
0 0 0 1
0 p e e e e
k k k k k
m t
k k
C t m t
y t x t F k k
C t m t
k k C t V V G C − − − − = = = − − = =
( )
t s is the continuous time; r t
( ) (
mg min)
is the drug infusion rate; kij(
min−1)
is the rate constant for dis- tribution and elimination of the anesthetic drug; V l1( )
is the volume of central compartment; and(
)
1
0 min
e
k −
is a scalar describing the delay on time of the plasmatic-effect-site drug concentration equilibration.
2.2. Pharmacodynamic Modeling
After Cp and Ce are obtained from PK model, PD model maps Ce to the BIS value which reflects the anesthetic condition of patients. In general, PD model is established by a sigmoid Emax model named as Hill curve for single drug. Based on the Hill curve, a response surface model was proposed by Minto et al. [30] to characterize drugs’ interaction for multi-drugs. The PD model for representing propofol and remifentanil can be formulated as follows [31]:
(
)
(
)
( )
( )
50
0 max 0
50 Effect , 1 , prop remi prop remi prop remi U U U
Ce Ce E E E
U U U γ γ θ θ + = + − + + (2)
where E0 is the clinical effect when no drug is infused; Emax is the maximum drug effect; γ is the steep-ness of the concentration-response curve;θis the ratio of the two drugs defined in Equation (3); Uprop and
remi
In this paper, let us define E0 and Emax as 98 and 0, respectively. Ce50,prop, Ce50,remi, β and are
pa-tient-dependent parameters which are estimated by clinical data explained in the following subsection.
2.3. Target Controlled Infusion System
TCI system transfers the plasmatic concentration targets
( )
Cpt to corresponding drug infusion rates. Practical-ly, the infusion can be realized by Alaris PK syringe pumps which incorporates the TCI system. These pumps are able to infuse adequate amount of drugs according to predefined Cpt. Furthermore, they can predict the realistic concentration based on PK model.The TCI system consists of a bolus-elimination-transfer (BET) infusion scheme designed from the PK model so the Cpt is achieved. The initial bolus, loading dose (LD), is calculated according to Equation (6) where
( )
1
V l is the volume of central compartment represented on Figure 2. The LD bolus will ensure the Cpt is achieved however it needs to be followed by a continuous infusion, r t
( )
, defined by Equation (7) to ensureCpt is maintained due to elimination and compartmental transfer of the drug [32]. 1 ,
LD=V Cpt (6)
( )
(
21 31)
10 12e 13e ,
k t k t
r t =LD k +k − +k − (7)
where t s
( )
is the continuous time; kij(
min 1)
−
is the rate constant for distribution and elimination of the anesthetic drug defined in Section 2.1.
TCI systems are also able to deal with Cpt changes. When Cpt increases an initial additional loading dose (ADDLD), Equation (6) and Equation (7) will become the following equations to maintain the new
(
)
Cpt NCpt .
(
)
1 ,
ADDLD=V NCpt Cpt− (8)
( )
(
21( ) 31( ))
(
( )
21( )( )
31( ))
1 10 12e 13e 21 2 e 31 3 e ,
k t k t k t k t
r t =V NCpt k +k − −τ +k − −τ − k m τ − −τ +k m τ − −τ (9)
where τ is the time of Cpt change;
(
1)
min
ij
k − are the rate constant for distribution and elimination of the
anesthetic drug; m2
( )( )
τ mg is the amount of anesthetic drug in the second compartment at the time of targetchange; m3
( )( )
τ mg is the amount of anesthetic drug in the third compartment at the time of target change. The new continuous infusion rate formula takes into account the amount of drug already present in the peri-pheral compartments and which will be redistributed.In the case when the Cpt decreases, no additional bolus is necessary, however the infusion of anesthetic drug is halted until NCpt is achieved on central compartment due to elimination of drug presented on the PK model. Once this NCpt is achieved the continuous infusion restarts according to Equation (9) where τ is the time NCpt is achieved on central compartment through the elimination process.
2.4. Clinical Protocol
The parameters of PD model in this paper are determined by clinical data obtained from 42 elderly patients who had major vascular surgery of the lower limb. The information of these patients is summarized as follows (in the format of “mean ± standard deviation”): 35 males and 7 females, age 72 ± 8 years old, height 169 ± 10 cm and weight 73 ± 14 kg.
settled and a radial arterial line was inserted to receive baseline readings on all clinical monitors. Two Alaris PK syringe pumps were employed to implement the total intravenous anesthesia (TIVA) with propofol [27] and re- mifentanil [28] TCI. To begin with, Cptremi was set to be 3 ng/ml. Once Ceremi reached 2 ng/ml, Cptremi was altered to 2 ng/ml and Cptprop was started with 3 µg/ml. From then on, Cptremi and Cptprop were adjusted
by anesthetists according to readings of different clinical apparatuses to maintain the BIS value within [40,60] for an appropriate DOA. Among these readings, cardiac output (CO) was monitored and stabilized at or near pre-induction level by anesthetists through all periods of the surgery.
3. PID Controllers
In this Section, 3 types of PID controllers, namely linear PID controller, T1 fuzzy PID controller and IT2 fuzzy PID controller, are introduced. These 3 types of PID controllers are employed to regulate the output BIS index of the anesthesia model.
3.1. Linear PID Controller
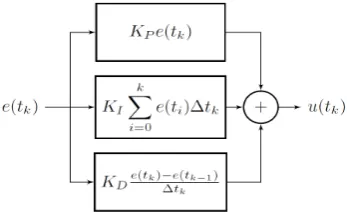
A linear PID controller is shown in Figure 3, which consists of 3 elements, namely proportional, integral and derivative blocks. The output of the linear PID controller in discrete time is given as
( )
( )
( )
( ) ( )
10
, k
k k
k P k I i k D
i k
e t e t
u t K e t K e t t K
t −
=
−
= + ∆ +
∆
∑
(10)where tk = ∆k tk, 0,1, 2,k= , is the sampling time; ∆tkis the interval of sampling time; u t
( )
k ∈R is the output; KP∈R, KI∈R, and KD∈R are constant proportional, integral and derivative gains, respectively, to be determined.3.2. Type-1 Fuzzy PID Controller
In view of the linear PID controller [33], as the proportional, integral and derivative gains are constant, it is not able to handle well a highly nonlinear system. It motivates the use of T1 fuzzy PID controller [34] [35] of which the gains are changing according to the operating domains. By applying different sets of gains in different oper-ating domains, more appropriate PID controller is employed to deal with the nonlinear system resulting in an improvement of control performance.
A T1 fuzzy PID control system is shown in Figure 4, which consists of a T1 fuzzy PID controller and a pa-tient’s model (detailed in Figure 1) connected in a closed loop. Unlike the linear PID controller having a set of constant gains, the T1 fuzzy PID controller has a fuzzy inference system providing a set of feedback gains through a reasoning process according to the operating condition.
The behavior of the fuzzy inference system is governed by a set of fuzzy rules of the following format:
( )
( )
( )
(
)
1 1
Rule : IF is AND AND is THEN ,
i i
i
i x t M x t M
y t y
Ψ Ψ
=
x
(11)
where x tj
( )
, 1, 2,j= ,Ψ, is a linguistic variable; , 1, 2, , ,i j
[image:6.595.227.401.596.704.2]M j= Ψ is the fuzzy term corresponding to the linguistic variable xj in the ith rule; is a positive integer; y
(
x( )
t)
is the output of the fuzzy inferenceFigure 4. A block diagram of fuzzy PID control system.
system; and yi is the singleton membership function corresponding to the ith rule. The inferred output is gi- ven as
( )
(
)
(
( )
)
1 , p i i iy t w t y
= =
∑
x x (12)
where
( )
t = x t1( )
x2( )
t xΨ( )
t ,x
( )
(
)
1 1, p i i w t = =∑
x (13)( )
(
)
0 ,i
w x t ≥ ∀i (14)
( )
(
)
(
( )
)
( )
(
)
1 1 1 , i l k l M l i p M k l tw t i
t µ µ Ψ = Ψ = = =
∏
∀∑∏
x x x (15)where p>0 denotes the number of rules; wi
(
x( )
t)
is the normalized grade of membership;( )
(
)
, 1, 2, , ,i
Mα t
µ x α = Ψ is the grade of membership corresponding to the fuzzy term i
Mα.
The output of the fuzzy inference system Equation (12) is employed to replace the gains of the linear PID controller turning it to become a T1 fuzzy PID controller. More precisely, 3 fuzzy inference systems are required to implement a T1 fuzzy PID controller. The outputs of the 3 fuzzy inference systems will be employed as KP,
I
K and KD. Consequently, the PID gains are no longer constant but dependent on the operating condition characterized by the membership functions.
3.3. Interval Type-2 Fuzzy PID Controller
Type-2 (T2) fuzzy sets [36]-[39] demonstrate a superior characteristic handing uncertainties compared with the T1 fuzzy sets. Uncertainties are captured by the lower and upper membership functions which form the footprint of uncertainty (FOU). A T2 fuzzy inference system can be considered as a set of infinite number of T1 fuzzy in-ference systems. Consequently, T2 fuzzy inin-ference system is able to outperform the T1 fuzzy inin-ference system in terms of reasoning and generalization capability. In general, the defuzzification process for general T2 fuzzy sets is computational demanding. By using IT2 fuzzy sets [40], the computational demand can be significantly reduced.
By employing interval fuzzy sets for the T1 fuzzy inference system Equation (12), it becomes an IT2 fuzzy inference system. The behavior of an IT2 fuzzy inference system is described by a set of rules of the following format:
( )
( )
( )
(
)
1 1
Rule : IF is AND AND is THEN ,
i i
i
i x t M x t M
y t y
Ψ Ψ
=
x
( )
(
)
(
( )
)
,(
( )
)
,i i i
W x t = w x t w x t (17)
, , 1, 2, , ,
i i i
y =y y i= p
(18)
where
( )
(
)
(
( )
)
1 0, i i Mw t t
α α µ Ψ = =
∏
≥x x (19)
( )
(
)
(
( )
)
1 0, i i Mw t t
α α µ Ψ = =
∏
≥x x (20)
( )
(
)
(
( )
)
0,i i
Mα t Mα t
µ x ≥µ x ≥ (21)
( )
(
)
(
( )
)
0,i i
w x t ≥w x t ≥ (22)
0, , i i
y ≥y ≥ ∀i (23)
in which wi
(
x( )
t)
, wi(
x( )
t)
, µMαi(
x( )
t)
and µMαi(
x( )
t)
denote the lower grade of membership, upper gradeof membership, lower membership function and upper membership function, respectively. Using the center-of- set type reducer, the inferred output of the IT2 fuzzy inference system is given as
( )
(
)
(
( )
)
( )
(
)
( ) ( ) ( ( ))[
]
1 , 1 , ,i i i i
p
i i
i
l r
p w t W t y y
i i
w t y
y t y y
w t = ∈ ∈ = =
∑
=∑
x x x x x
(24)where yl and yr can be obtained using the Karnik-Mendel (KM) algorithms [41]. The final defuzzifized output is given by
( )
(
)
.2
l r
y y
y x t = + (25)
The IT2 fuzzy PID control system [42] can be represented by Figure 4 as well of which the PID gains are given by the outputs of 3 IT2 fuzzy inference systems.
4. Simulation Design
In this section, the simulation environment is presented. First, we design the training profiles and testing profiles which all controllers need to deal with. The purpose of selected target profiles is first described. Then different control strategies are provided for comparison. For fuzzy control strategies, the approach to determine fuzzy rules is offered. Finally, the procedure of using GA for optimization is described, and a performance index is designed as the cost function for optimization.
4.1. Target Profiles
A training profile as shown inFigure 5, which is a series of BIS values required for an appropriate DOA, is em-ployed for the training of the PID control strategies using GA. It defines the target BIS values in different peri-ods that a PID control strategy has to achieve. After the training, a testing profile as shown inFigure 6 is em-ployed to verify if the trained PID control strategies are able to control the BIS value to reach some targets sub-ject to different operating conditions.
Figure 5. Training profile.
Figure 6. Testing profile.
around 50 and the maintenance process starts from tk =1000 seconds.
At tk =1000 seconds, designed controllers replace the predefined controller to achieve the maintenance process. For a suitable anesthesia, it is required that BISt
( )
tk =50 and an acceptable range is BIS∈[
40, 60]
. Hence, the control objective is to maintain the BIS value within [40,60]. In order to make the control difficult enough to differentiate various control strategies, we add more targets into the profiles such as( )
[
)
BISt tk =80, 2000, 4000tk∈ and BISt
( )
tk =20, 6000,8000tk∈[
)
in Figure 5.As for the recovery process, since it is not allowed take the drug out of humans, the cease of controllers is the only and fastest option. These will not exist overshoot either because the target BIS is the maximum value. Therefore, all controllers will perform the same at this stage. It is not necessary to design controllers for the re-covery process which is thus not included in the target profiles. It is noted that although the induction process is not under comparison either, we cannot ignore it. The reason is that it is difficult to find all model parameters describing the state of BISt
( )
tk =50. On the other hand, the parameters for BISt( )
tk =98 are known and it is easy to start from this initial condition.4.2. Control Strategies
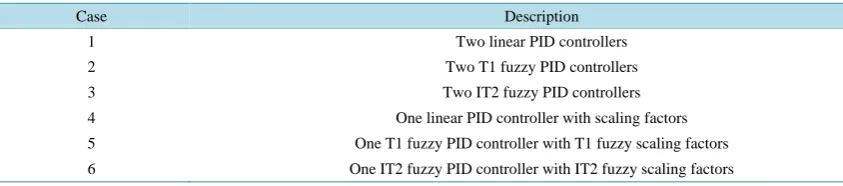
In this paper, we aim to compare different control strategies to achieve a better control performance. All six control strategies are listed in Table 1. These six cases can be separated into two groups: two-controller Cases 1 to 3 and one-controller Cases 4 to 6. In two-controller cases, we control each drug by an independent PID con- troller offering control outputs up
( )
tk and u tr( )
k . In one-controller cases, however, the control output of the PID controller is divided into two control outputs by two scaling factors αr and αp. Apparently, parametersTable 1. Six cases of PID control strategies.
Case Description
1 Two linear PID controllers
2 Two T1 fuzzy PID controllers
3 Two IT2 fuzzy PID controllers
4 One linear PID controller with scaling factors
5 One T1 fuzzy PID controller with T1 fuzzy scaling factors
6 One IT2 fuzzy PID controller with IT2 fuzzy scaling factors
In each of these two groups, we have the following control strategies: linear PID controllers, T1 fuzzy PID controllers, and IT2 fuzzy PID controllers. For fuzzy PID controllers, the block diagram of BIS index regulation using two controllers and one controller with scaling factors are shown in Figure 7 and Figure 8, respectively. Referring to the figures, r t
( )
denotes the desired BIS target value, y t( )
k is the output BIS value from theanesthesia model, e t( )
k denotes the difference between the desired target and actual BIS value at time( ) ( ) ( )
, i.e.k k k k
t e t =r t −y t . The PID gains
(
KP1,KI1,KD1,KP2,KI2 and KD2)
and scaling factors(
αr and αp)
are decided by the fuzzy inference systems. The PID controller will generate the control signals( )
p k
u t and u tr
( )
k for BIS regulation where up( )
tk and u tr( )
k are Cptprop and Cptremi in Figure 1.4.3. Fuzzy Rules
T1 and IT2 fuzzy PID controllers are discussed in Subsections 3.2 and 3.3, respectively. While the number of fuzzy rules and the shape of membership function are predefined, the parameters of input and output member-ship functions are optimized by GA.
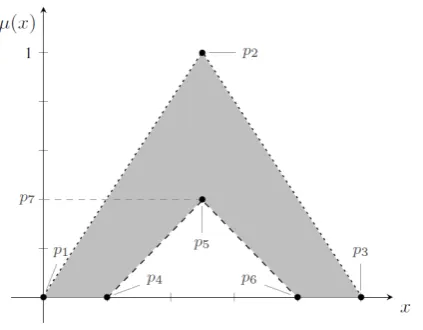
In this paper, the shape of membership functions is defined as triangular shape for simplicity. The triangular IT2 membership functions are shown inFigure 9. For each input IT2 membership functions, the lower and up-per membership functions are characterized by seven points p1 to p7 which are to be optimized by GA. As for T1 fuzzy PID controller, each input membership function is characterized by three points p1 to p3 which are to be optimized by GA. For both T1 and IT2 fuzzy PID controllers, their output membership functions are T1 and IT2 singleton membership functions whose values are to be determined by GA.
In fact, from the determination of membership functions and fuzzy rules, we can find the relation between these control strategies: solutions from linear PID controllers can be implemented by T1 fuzzy PID controllers, and solutions from T1 fuzzy PID controllers can be implemented by IT2 fuzzy PID controllers. In other words, linear PID controller is a subset of T1 fuzzy PID controller, and T1 fuzzy PID controller is a subset of IT2 fuzzy PID controller. By adding some constraints on the membership functions and consequents in fuzzy rules, IT2 fuzzy PID controllers can be reduced to T1 fuzzy PID controllers, and T1 fuzzy PID controllers can be reduced to linear PID controllers.
Three rules are employed for each fuzzy inference system. The premise of each rule takes only one linguistic variable, i.e., ∆BIS
( )
tk =BISt( )
tk −BIS( )
tk where BISt( )
tk is the target BIS value at time tk and( )
BIS tk is the actual BIS value. Three linguistic terms, namely negative (N), zero (Z), and positive (P), are employed to characterize the premise variable ∆BIS
( )
tk . More rules can be used to partition the universe of discourse for a better result. However, it will lead to slower convergence of training and more computational burden. Additionally, the rate of change of ∆BIS( )
tk can also be treated as another linguistic variable together with ∆BIS( )
tk . Likewise, it will cause more fuzzy rules and parameters which increase the computational bur-den and defers the convergence.From the above discussion, triangular membership functions and three rules are employed for both T1 and IT2 fuzzy PID controllers. In the GA optimization, the triangular shape and sequence of membership functions of three rules should be guaranteed. For the sequence, specifically, the same point in membership functions corre-sponding to linguistic terms N, Z and P should be in ascending order (except p7 ). For example,
2 2 2
p p p
Figure 7. BIS index regulation using two fuzzy PID controllers.
Figure 8. BIS index regulation using one fuzzy PID controller with scaling factors.
Figure 9. An example of IT2 membership functions. Dashed line: lower membership function. Dotted line: Upper member- ship function. Gray area: footprint of uncertainty.
Another condition needed to be ensured is that at least one rule is fired for ∆BIS
( )
tk ∈ −[
100,100]
. Between two adjacent membership functions, as long as they intersect each other, there exists one rule to be fired. On the left-hand side of membership function N and the right-hand side of membership function P, there are two ap- proaches to ensure this condition. One is defining Np2 =100 and Pp2 =100, and another is defining1 4
p p
N =N = −∞ and Pp3=Pp6= +∞. It can be found that solutions from the first approach can be imple-
[image:11.595.212.424.425.590.2]Hence, we adopt the second method. For that reason, rules N and P are two shoulder-shape membership func-tions which can be treated as a special case of triangular membership funcfunc-tions. In this approach, it is guaranteed that at least one rule is fired for ∆BIS
( )
tk ∈ −∞ +∞[
,]
, although only[
−100,100]
is concerned practically.Note that under this method the equalities Np1=Np4=Np2 and Pp3=Pp6=Pp2 are temporarily employed
in the optimization.
4.4. Parameters Optimization
The PID gains, scaling factors and membership functions are optimized by GA subject to a cost function re-flecting the control performance. Due to the disparity of each training, GA is run for 10 times for each case of PID control strategies as shown in Table 1. The best set of parameters for each control strategy for each run of GA is recorded for further comparison, analysis and practical application. Statistical information including the worst, mean and best costs and the standard deviation for the 10 runs are collected. Among the 10 runs for each PID control strategy, the best set of parameters given by the best cost is used to implement the corresponding PID controller. During the optimization, the lower and upper bounds (LB and UB) of PID gains and scaling fac-tors are listed in Table 2, which are determined by trial and error for good control performance.
Due to a large number of variables and the highly nonlinear cost function (defined in the following subsection 4.5), especially for fuzzy PID controllers, GA may not be able to reach the global optimal solution. To speed up the training process, we define the initial population for fuzzy PID controllers based on our knowledge on the PID control strategy. It is known that linear PID controller is a subset of T1 fuzzy PID controller, and T1 fuzzy PID controller is a subset of IT2 fuzzy PID controller. It is thus reasonable that the best set of PID gains for lin-ear PID controllers obtained by GA is employed as the initial PID gains for T1 fuzzy PID controllers for all rules. As a result, initially, the T1 fuzzy controller is equivalent to a linear PID controller. Similarly, the best set of PID gains and membership function parameters obtained for T1 fuzzy PID controller is employed as the ini-tial set of PID gains and membership function parameters for IT2 fuzzy PID controller. That is to say, we utilize the “knowledge” on the PID control strategy such that GA starts with a considerable well initial condition. In this way, although there is still the same number of variables to be trained, GA only needs to utilize the addi-tional parameters and new structures (fuzzy rules and membership functions) provided by fuzzy PID controllers in order to obtain a better cost value.
4.5. Performance Index
The performance index is used to judge whether the control objective is achieved and show the merits of various control strategies. Different performance indices can be selected such as settling time, overshoot, steady error, mean absolute error (MAE), and mean square error (MSE). For the GA optimization, a well-defined perfor-mance index is required as the cost function. All parameters of controllers are optimized according to the cost value provided by the cost function. In this paper, we present the following index J mainly based on MAE:
( )
( )
( )
( )
( )
( )
( )
(
( )
)
( )
( )
(
)
1 11 2 3
0 1 0 4 5 0 BIS BIS 1 BIS 1 0.5 , n
prop k prop k
k k
k k
n
prop k
remi k remi k k
n
prop k remi k k
Cpt t Cpt t
t t
t
n T T
Cpt t
Cpt t Cpt t
T
Cpt t Cpt t
J λ λ λ
λ λ − − = − = = − ∆ − ∆ = ∆ + + + + − + − +
∑
∑
∑
(26)where tk =kT k, 0,1, 2,= , ,n is the sampling time, and n is a positive integer; T is the interval of
sam-pling time; ∆BIS
( )
tK =BISt( )
tk −BIS( )
tk , BISt( )
tk is the target BIS value at time tk, and ∆BIS( )
t−1 =0;( )
prop kCpt t and Cptremi
( )
tk are plasmatic concentration targets of propofol and remifentanil, respectively, and( )
1( )
0prop prop
Cpt t− =Cpt t , Cptremi
( )
t−1 =Cptremi( )
t0 ; λ λ1, 2,,λ5 are predefined weights.weights on large and small errors leading to a mild and smooth response.
The three terms after the first term of (26) are the rate of change of ∆BIS
( )
tk , BIS( )
tk , Cptprop( )
tk and( )
remi k
Cpt t , respectively, which are designed to reduce the oscillation for a gentle progress. The last term is to reduce the difference of the concentration of two drugs because they are equally important for different purposes during the anesthesia. Serious bias to either of these two drugs will not provide an adequate anesthesia.
5. Simulation Results
In this section, we implement the simulation on the control of anesthesia using the anesthesia model in Figure 1. Different control strategies in Table 1 are applied to regulate the BIS using the training profiles shown in Figure 5 for training and their control performance are verified by testing profiles shown in Figure 6. PID gains, parameters of scaling factors and membership functions are optimized by GA according to the cost function Equation (26). Comparisons of performance are made between the six cases. It should be noted that the simula-tion was carried out in discrete time. The PK model in Equasimula-tion (1) was discretized by zero-order-hold (ZOH) assumption. The TCI system implemented has also been adjusted to perform under discrete PK model.
A real-coded GA available from Matlab global optimization toolbox is employed for the training. The control parameters of GA are listed in Table 3.
We define the parameters in Equation (26) as follows: n=1000, T =10 seconds, λ λ1= 5=1,
2 3 4 20
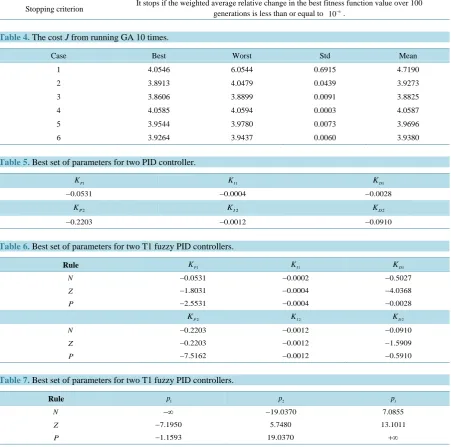
λ =λ =λ = . It is worth to mention that although the weight λ1 is not the largest, the MAE is still the main contribution for the total cost. The bounds of parameters in Table 2 are adopted for the training process of GA. By running GA 10 times for each case inTable 1, we obtain the statistical information of the cost J as shown in Table 4.
Referring to Table 4, comparing with Cases 1 to 3, Case 3 offers the best cost and Case 2 comes to the second which coincides with the theory. The same rank can be found in Cases 4 to 6. Comparing Cases 1 and 4, two- controller case is better than one-controller case, which can be also proved by comparing between Cases 2 and 5, and Cases 3 and 6. The reason is that one-controller case has the constraint on the ratio of control signal between two drugs while two-controller case does not have such constraint. One-controller case is a subset of two-con- troller case. Although one-controller case performs worse, it has less number of parameters to be determined and thus reduces the computational demand and implementation cost of PID control strategy.
In spite of the “Best” cost, the “Std” is descending from linear PID controllers to IT2 fuzzy PID controller ex- cept Case 4. It provides the information that the convergence gets easier for fuzzy PID controllers. The reason is that we use the best set of parameters of previous cases as the initial populations of following training. It also in- dicates that the improvement becomes more and more difficult, and thus 10 times running offer similar results. The “Std” for two-controller cases is larger than the corresponding one-controller cases, which implies that the convergence for two-controller cases is harder due to more variables to be trained.
The best sets of parameters and membership functions are shown in Tables 5-14. Corresponding membership functions are exhibited in Figures 10-13. From the obtained membership functions, it can be summarized that points Np2 and Pp2 are preferred to be around 20 related to the training profiles we define in Figure 5.
By applying the best sets of parameters to the training profile of BIS, the time responses of BIS and corres-ponding drug concentration information are shown in Figures 14-19 for Cases 1 to 6, respectively. By applying the best sets of parameters to the testing profile of BIS, the ones for the testing profile are exhibited in Figures 20-25. The green line is drawn by BIS
( )
tk =BISt( )
tk ±2. From the practical clinical point of view, the acceptable range of BIS is BISt( )
tk −10, BISt( )
tk +10. Therefore, if BIS is stabilized within the region bounded by theTable 3. Control parameters of GA.
Parameter Value
Number of iterations 200
Size of population 100
Selection Stochastic uniform selection function.
Elitism Elitism is implemented. The best two chromosomes are guaranteed to survive to the next population.
Crossover Scattered crossover.
Crossover fraction 0.8
Mutation Gaussian mutation.
Stopping criterion It stops if the weighted average relative change in the best fitness function value over 100 generations is less than or equal to 6 10− .
Table 4. The cost J from running GA 10 times.
Case Best Worst Std Mean
1 4.0546 6.0544 0.6915 4.7190
2 3.8913 4.0479 0.0439 3.9273
3 3.8606 3.8899 0.0091 3.8825
4 4.0585 4.0594 0.0003 4.0587
5 3.9544 3.9780 0.0073 3.9696
[image:14.595.90.537.316.424.2]6 3.9264 3.9437 0.0060 3.9380
Table 5. Best set of parameters for two PID controller.
1
P
K K I1 KD1
0.0531
− −0.0004 −0.0028
2
P
K KI2 KD2
0.2203
[image:14.595.86.539.533.645.2]− −0.0012 −0.0910
Table 6. Best set of parameters for two T1 fuzzy PID controllers.
Rule K P1 K I1 KD1
N −0.0531 −0.0002 −0.5027
Z −1.8031 −0.0004 −4.0368
P −2.5531 −0.0004 −0.0028
2
P
K K I2 KD2
N −0.2203 −0.0012 −0.0910
Z −0.2203 −0.0012 −1.5909
P −7.5162 −0.0012 −0.5910
Table 7. Best set of parameters for two T1 fuzzy PID controllers.
Rule p 1 p 2 p 3
N −∞ −19.0370 7.0855
Z −7.1950 5.7480 13.1011
[image:14.595.90.535.667.722.2]Z [−6.5368, 6.5352− ] [−0.2203, 0.2203− ]
P [−0.0013, 0.0013− ] [−7.5162, 3.7581− ]
2
I
K KD2
N [−0.0012, 0.0012− ] [−0.0910, 0.0451− ]
Z [−0.0012, 0.0012− ] [−1.5909, 1.5870− ]
[image:15.595.87.547.86.669.2]P [−0.0012, 0.0012− ] [−0.5910, 0.5310− ]
Table 9. Best set of membership functions for two IT2 fuzzy PID controllers.
Rule p1 p2 p3 p4
N −∞ −19.0371 7.0975 −∞
Z −7.2069 5.7480 13.4781 −7.1951
P −1.4565 19.0371 +∞ −1.1593
5
p p6 p7
N −19.0371 7.0856 0.9990
Z 5.7480 13.1011 0.9990
P 19.0371 +∞ 0.8135
Table 10. Best set of parameters for one PID controller.
1
P
K K I1 KD1 αP αr
0.9267
[image:15.595.89.536.100.272.2]− −0.0061 −0.6068 0.0598 0.1869
Table 11. Best set of parameters for one T1 fuzzy PID controller with T1 fuzzy scaling factors.
Rule K P1 K I1 KD1 αP αr
N −0.8642 −0.0061 −0.5443 0.0665 0.2189
Z −1.7068 −0.0054 −9.6913 0.0725 0.1869
[image:15.595.88.541.495.560.2]P −8.6575 −0.0061 −6.6119 0.0602 0.1947
Table 12. Best set of membership functions for one T1 fuzzy PID controller with T1 fuzzy scaling factors.
Rule p 1 p 2 p 3
N −∞ −24.6107 −10.1748
Z −11.4184 −6.9156 1.8562
P −9.1078 24.6107 +∞
lower and upper green lines, the performance will be well acceptable.
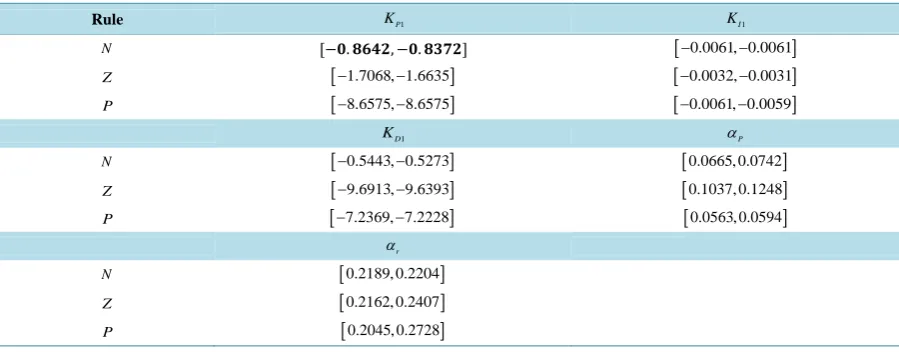
[image:15.595.88.535.585.638.2]Table 13. Best set of parameters for one IT2 fuzzy PID controller with IT2 fuzzy scaling factors.
Rule K P1 K I1
N [−𝟎𝟎. 𝟖𝟖𝟖𝟖𝟖𝟖𝟖𝟖, −𝟎𝟎. 𝟖𝟖𝟖𝟖𝟖𝟖𝟖𝟖] [−0.0061, 0.0061− ]
Z [−1.7068, 1.6635− ] [−0.0032, 0.0031− ]
P [−8.6575, 8.6575− ] [−0.0061, 0.0059− ]
1
D
K αP
N [−0.5443, 0.5273− ] [0.0665, 0.0742]
Z [−9.6913, 9.6393− ] [0.1037, 0.1248]
P [−7.2369, 7.2228− ] [0.0563, 0.0594]
r
α
N [0.2189, 0.2204]
Z [0.2162, 0.2407]
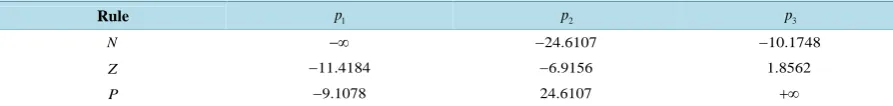
[image:16.595.91.540.295.583.2]P [0.2045, 0.2728]
Table 14. Best set of membership functions for one IT2 fuzzy PID controller with IT2 fuzzy scaling factors.
Rule p 1 p 2 p 3 p 4
N −∞ −24.6105 −5.0849 −∞
Z −13.6412 −6.9156 2.2345 −13.6302
P −9.1233 24.6105 +∞ −9.1078
5
p p 6 p 7
N −24.6105 −7.0984 0.9990
Z −6.9156 1.8562 0.9990
P 24.6105 +∞ 0.9990
Figure 10. Membership functions for two T1 fuzzy PID con- trollers. Dashed line: membership function N. Dotted line: mem- bership function Z. Solid line: membership function P.
the same characteristics as discussed for the corresponding control strategies. Recalling a common controller with two linear PID controllers and predefined parameters is used to achieve the induction process for all cases, the proposed PID control strategies kick in at the start of the maintenance process. The switching point of induc- tion and maintenance process occurs at 1000 seconds which results in a small vibration.
The lower panels of Figures 20-25show the behavior of drug concentration. It can be seen that both Cpand
Figure 11. Membership functions for two IT2 fuzzy PID con- trollers. Dashed line: lower membership functions. Dotted line: upper membership functions. Solid line: the shoulder of membership functions.
Figure 12. Membership functions for one T1 fuzzy PID con- troller with T1 fuzzy scaling factors. Dashed line: membership function N. Dotted line: membership function Z.
Solid line: membership function P.
[image:17.595.206.423.515.671.2]Figure 14. BIS and drug concentration for training profile by two PID controllers.
Figure 15. BIS and drug concentration for training profile by two T1 fuzzy PID controllers.
Figure 16. BIS and drug concentration for training profile by two IT2 fuzzy PID controllers.
0 1000 2000 3000 4000 5000 6000 7000 8000 9000 10000 0
20 40 60 80 100
Time (seconds)
BI
S
0 1000 2000 3000 4000 5000 6000 7000 8000 9000 10000 0
5 10 15 20
Time (seconds)
C
onc
ent
rat
ion
Cpprop (µg/ml) Cpremi (ng/ml) Ceprop (µg/ml) Ceremi (ng/ml)
0 1000 2000 3000 4000 5000 6000 7000 8000 9000 10000 0
20 40 60 80 100
Time (seconds)
BI
S
0 1000 2000 3000 4000 5000 6000 7000 8000 9000 10000 0
5 10 15 20
Time (seconds)
C
onc
ent
rat
ion
Cpprop (µg/ml) Cp
remi (ng/ml) Ceprop (µg/ml) Ceremi (ng/ml)
0 1000 2000 3000 4000 5000 6000 7000 8000 9000 10000 0
20 40 60 80 100
Time (seconds)
BI
S
0 1000 2000 3000 4000 5000 6000 7000 8000 9000 10000 0
5 10 15 20
Time (seconds)
C
onc
ent
rat
ion
[image:18.595.195.430.512.688.2]Figure 17. BIS and drug concentration for training profile by one PID controller with scaling factors.
Figure 18. BIS and drug concentration for training profile by one T1 fuzzy PID controller with T1 fuzzy scaling factors.
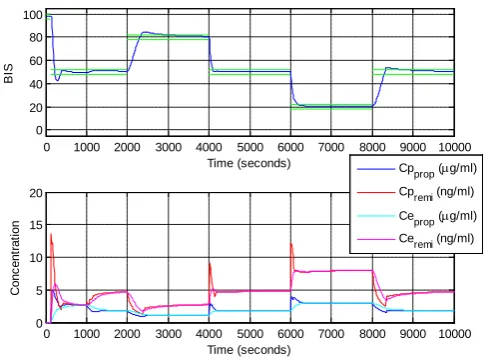
Figure 19. BIS and drug concentration for training profile by one IT2 fuzzy PID controller with IT2 fuzzy scaling factors.
0 1000 2000 3000 4000 5000 6000 7000 8000 9000 10000 0
5 10 15
Times (seconds)
C
onc
ent
rat
ion Ceprop
remi (ng/ml)
0 1000 2000 3000 4000 5000 6000 7000 8000 9000 10000
0 20 40 60 80 100
Time (seconds)
BI
S
0 1000 2000 3000 4000 5000 6000 7000 8000 9000 10000
0 5 10 15 20
Time (seconds)
C
onc
ent
rat
ion
Cpprop (µg/ml) Cpremi (ng/ml) Ceprop (µg/ml) Ceremi (ng/ml)
0 1000 2000 3000 4000 5000 6000 7000 8000 9000 10000 0
20 40 60 80 100
Time (seconds)
BI
S
0 1000 2000 3000 4000 5000 6000 7000 8000 9000 10000 0
5 10 15 20
Time (seconds)
C
onc
ent
rat
ion
Cpprop (µg/ml) Cp
[image:19.595.190.433.509.689.2]Figure 20. BIS and drug concentration for testing profile by two PID controllers.
Figure 21. BIS and drug concentration for testing profile by two T1 fuzzy PID controllers.
Figure 22. BIS and drug concentration for testing profile by two IT2 fuzzy PID controllers.
0 1000 2000 3000 4000 5000 6000 7000 8000 9000 10000 0
20 40 60 80 100
Time (seconds)
BI
S
0 1000 2000 3000 4000 5000 6000 7000 8000 9000 10000 0
5 10 15 20
Time (seconds)
C
onc
ent
rat
ion
Cpprop (µg/ml) Cpremi (ng/ml) Ceprop (µg/ml) Ceremi (ng/ml)
0 1000 2000 3000 4000 5000 6000 7000 8000 9000 10000 0
20 40 60 80 100
Time (seconds)
BI
S
0 1000 2000 3000 4000 5000 6000 7000 8000 9000 10000 0
5 10 15 20
Time (seconds)
C
onc
ent
rat
ion
Cpprop (µg/ml) Cpremi (ng/ml) Ceprop (µg/ml) Ceremi (ng/ml)
0 1000 2000 3000 4000 5000 6000 7000 8000 9000 10000 0
20 40 60 80 100
Time (seconds)
BI
S
0 1000 2000 3000 4000 5000 6000 7000 8000 9000 10000 0
5 10 15 20
Time (seconds)
C
onc
ent
rat
ion
Cp
prop (µg/ml)
[image:20.595.197.426.84.256.2] [image:20.595.190.434.292.471.2] [image:20.595.192.431.512.689.2]Figure 23. BIS and drug concentration for testing profile by one PID controller with scaling factors.
Figure 24. BIS and drug concentration for testing profile by one T1 fuzzy PID controller with T1 fuzzy scaling factors.
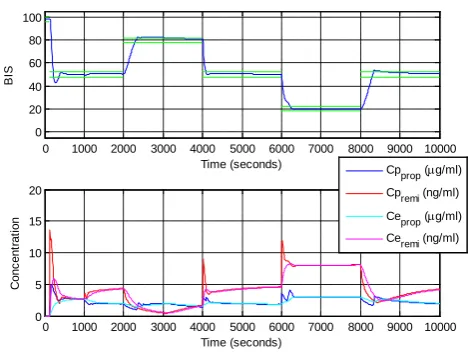
Figure 25. BIS and drug concentration for testing profile by one IT2 fuzzy PID controller with IT2 fuzzy scaling factors.
0 1000 2000 3000 4000 5000 6000 7000 8000 9000 10000 0
5 10 15
Time (seconds)
C
onc
ent
rat
ion
Ceprop (µg/ml) Ceremi (ng/ml)
0 1000 2000 3000 4000 5000 6000 7000 8000 9000 10000 0
20 40 60 80 100
Time (seconds)
BI
S
0 1000 2000 3000 4000 5000 6000 7000 8000 9000 10000 0
5 10 15 20
Time (seconds)
C
onc
ent
rat
ion
Cpprop (µg/ml) Cpremi (ng/ml) Ceprop (µg/ml) Ceremi (ng/ml)
0 1000 2000 3000 4000 5000 6000 7000 8000 9000 10000 0
20 40 60 80 100
Time (seconds)
BI
S
0 1000 2000 3000 4000 5000 6000 7000 8000 9000 10000 0
5 10 15 20
Time (seconds)
C
onc
ent
rat
ion
[image:21.595.195.430.296.471.2] [image:21.595.192.433.509.688.2]Table 15. The cost J for the testing profile.
Case 1 2 3
Cost 4.1175 3.9888 3.9745
Case 4 5 6
Cost 4.1228 4.0408 4.1066
which illustrates that the remifentanil is more favorable to the stabilization of BIS than the propofol. This might be due to the faster action time of remifentanil comparatively to propofol. Although the total amount of remi-fentanil is larger, the cost function takes the difference of the amount of two drugs into consideration such that serious bias to remifentanil is avoided. Even though the slightly bias towards remifentanil can be noticed overall the propofol and remifentanil Ce reached are within acceptable clinical boundaries even when the BIS target was set at 20, a value inferior to the safe interval of 40 to 60.
Overall from a clinical point of view the results and performance obtained are acceptable, considering the lack of significant overshoot, the stability of the controller response and the ability of achieving the desired targets on a short time with clinically acceptable Ce. The controller also provided the expected response when the value of BIS target increases, and it stops infusion of anesthetic drugs but only restarts its infusion in other to avoid an overshoot.
When the PID control strategies with the best set of parameters (offering the best cost of J) are employed to regulate the BIS value using the testing profile in Figure 6, their cost values are listed in Table 15. The rank of which is identical to the sequence of cost values from the training profile. It indicates that the advantage of fuzzy PID controller over linear PID controller exists not only in the training profile, but also in various target profiles.
6. Conclusion
In this paper, drug administration for anesthesia has been realized by various PID control strategies. We have first constructed a multivariable anesthesia model with propofol and remifentanil based on 42 patients’ clinical data. Simulation has been conducted to regulate the output BIS value governed by this model using six control strategies including linear PID controllers, T1 fuzzy PID controllers and IT2 fuzzy PID controllers. These six strategies are separated into two groups, namely two controllers and one controller with scaling factors, to han-dle the co-administration of two drugs. Parameters of these controllers have all been optimized by GA subject to a performance index quantitatively measuring the control performance. In order to make the control sophistica- ted, target profiles have been designed for BIS regulation. Different target profiles have been utilized to test and verify the performance of controllers. It has been demonstrated that the IT2 fuzzy PID controllers offer the best performance, and T1 fuzzy PID controllers come to the second. In the future, further investigation can be carried out to control a general and non-parametric multivariable anesthesia model rather than the model with parame-ters obtained from specific group of patients.
Acknowledgements
The work described in this paper was partly supported by King’s College London, Fundação para a Ciênciae Tecnologia (grant number SFHR/BD/44162/2008) and European Social Fund in the POPH framework.
References
[1] Croft, R. and Washington, S. (2012) Induction of Anaesthesia. Anaesthesia & Intensive Care Medicine, 13, 401-406.
http://dx.doi.org/10.1016/j.mpaic.2012.07.008
[2] Mortier, E.P. and Struys, M.M. (2001) Monitoring the Depth of Anaesthesia Using Bispectral Analysis and Closed- Loop Controlled Administration of Propofol. Best Practice & Research Clinical Anaesthesiology, 15, 83-96.
http://dx.doi.org/10.1053/bean.2000.0137
[3] Biebuyck, J.F., O’Hara, D.A., Bogen, D.K. and Noordergraaf, A. (1992) The Use of Computers for Controlling the De-
livery of Anesthesia. Anesthesiology, 77, 563-581. http://dx.doi.org/10.1097/00000542-199209000-00024
[4] Kern, S.E., Xie, G., White, J.L. and Egan, T.D. (2004) A Response Surface Analysis of Propofol-Remifentanil
Phar-macodynamic Interaction in Volunteers. Anesthesiology, 100, 1374-1381.
http://dx.doi.org/10.1016/j.mpaic.2008.09.021
[9] Kim, D.W., Joo, J.D., In, J.H., Jeon, Y.S., Jung, H.S., Jeon, K.B., Park, J.S. and Choi, J.W. (2013) Comparison of the Recovery and Respiratory Effects of Aminophylline and Doxapram Following Total Intravenous Anesthesia with Pro-pofol and Remifentanil. Journal of Clinical Anesthesia, 25, 173-176. http://dx.doi.org/10.1016/j.jclinane.2012.07.005
[10] Hawthorne, C. and Sutcliffe, N. (2013) Total Intravenous Anaesthesia. Anaesthesia & Intensive Care Medicine, 14, 129-131. http://dx.doi.org/10.1016/j.mpaic.2013.01.006
[11] Westrin, P. (1996) 6 Intravenous and Inhalational Anaesthetic Agents. Baillière’s Clinical Anaesthesiology, 10, 687- 715. http://dx.doi.org/10.1016/S0950-3501(96)80043-2
[12] Grieder, P., Gentilini, A., Morari, M. and Schnider, T. (2001) Robust Adaptive Control of Hypnosis during Anesthesia.
Proceedings of the 23rd Annual International Conference of the IEEE Engineering in Medicine and Biology Society, 2,
2055-2058.
[13] Kissin, I. (1997) A Concept for Assessing Interactions of General Anesthetics. Anesthesia and Analgesia, 85, 204-210.
http://dx.doi.org/10.1213/00000539-199707000-00036
[14] Liu, J., Singh, H. and White, P.F. (1997) Electroencephalographic Bispectral Index Correlates with Intraoperative Re-call and Depth of Propofol-Induced Sedation. Anesthesia and Analgesia, 84, 185-189.
http://dx.doi.org/10.1213/00000539-199701000-00033
[15] Glass, P.S., Bloom, M., Kearse, L., Rosow, C., Sebel, P. and Manberg, P. (1997) Bispectral Analysis Measures
Seda-tion and Memory Effects of Propofol, Midazolam, Isoflurane and Alfentanil in Healthy Volunteers. Anesthesiology, 86,
836-847. http://dx.doi.org/10.1097/00000542-199704000-00014
[16] Panagopoulos, H., Astrom, K. and Hagglund, T. (2002) Design of PID Controllers Based on Constrained Optimization.
IEEE Proceedings of Control Theory and Applications, 149, 32-40.
[17] Dumont, G.A. Martinez, A. and Ansermino, J.M. (2009) Robust Control of Depth of Anesthesia. International Journal
of Adaptive Control and Signal Processing, 23, 435-454.
[18] Soltesz, K., Hahn, J.O., Hägglund, T., Dumont, G.A. and Ansermino, J.M. (2013) Individualized Closed-Loop Control
of Propofol Anesthesia: A Preliminary Study. Biomedical Signal Processing and Control, 8, 500-508.
http://dx.doi.org/10.1016/j.bspc.2013.04.005
[19] Shieh, J.S., Kao, M.H. and Liu, C.C. (2006) Genetic Fuzzy Modelling and Control of Bispectral Index (BIS) for
Gen-eral Intravenous Anaesthesia. Medical Engineering & Physics, 28, 134-148.
http://dx.doi.org/10.1016/j.medengphy.2005.04.023
[20] Sartori, V., Schumacher, P., Bouillon, T., Luginbuehl, M. and Morari, M. (2005) On-Line Estimation of Propofolphar-
macodynamic Parameters. Proceedings of IEEE-EMBS 2005,27th Annual International Conference of the Engineering
in Medicine and Biology Society, 74-77.
[21] De Smet, T., Struys, M.M., Neckebroek, M.M., Van den Hauwe, K., Bonte, S. and Mortier, E.P. (2008) The Accuracy
and Clinical Feasibility of a New Bayesian-Based Closed-Loop Control System for Propofol Administration Using the Bispectral Index as a Controlled Variable. Anesthesia and Analgesia, 107, 1200-1210.
http://dx.doi.org/10.1213/ane.0b013e31817bd1a6
[22] Hahn, J.O., Dumont, G.A. and Ansermino, J.M. (2012) Robust Closed-Loop Control of Hypnosis with Propofol Using
WAVCNS Index as the Controlled Variable. Biomedical Signal Processing and Control, 7, 517-524.
http://dx.doi.org/10.1016/j.bspc.2011.09.001
[23] Haddad, W.M., Hayakawa, T. and Bailey, J.M. (2006) Adaptive Control for Nonlinear Compartmental Dynamical Sys-
tems with Applications to Clinical Pharmacology. Systems & Control Letters, 55, 62-70.
[24] Agrawal, D., Kumar, S., Kumar, A., Gombar, S., Trikha, A. and Anand, S. (2012) Design of an Assistive Anaesthesia
Drug Delivery Control Using Knowledge Based Systems. Knowledge-Based Systems, 31, 1-7.
http://dx.doi.org/10.1016/j.knosys.2012.01.012
[25] Mahfouf, M., Nunes, C.S., Linkens, D.A. and Peacock, J.E. (2005) Modelling and Multivariable Control in
Re-mifentanil. Artificial Intelligence in Medicine, 35, 207-213. http://dx.doi.org/10.1016/j.artmed.2004.12.005
[26] El-Bardini, M. and El-Nagar, A.M. (2011) Direct Adaptive Interval Type-2 Fuzzy Logic Controller for the
Multivaria-ble Anaesthesia System. Ain Shams Engineering Journal, 2, 149-160. http://dx.doi.org/10.1016/j.asej.2011.08.001
[27] Marsh, B., White, M., Morton, N. and Kenny, G.N. (1991) Pharmacokinetic Model Driven Infusion of Propofol in Chi-
ldren. British Journal of Anaesthesia, 67, 41-48. http://dx.doi.org/10.1093/bja/67.1.41
[28] Minto, C.F., Schnider, T.W., Egan, T.D., Youngs, E., Lemmens, H.J., Gambus, P.L., Billard, V., Hoke, J.F., Moore, K.H., Hermann, D.J., Muir, K.T., Mandema, J.W. and Shafer, S.L. (1997) Influence of Age and Gender on the Phar-macokinetics and Pharmacodynamics of Remifentanil. I. Model Development. Anesthesiology, 86, 10-23.
http://dx.doi.org/10.1097/00000542-199701000-00004
[29] Absalom, A. and Struys, M. (2007) An Overview of TCI & TIVA. Academia Press, Gent.
[30] Minto, C.F., Schnider, T.W., Short, T.G., Gregg, K.M., Gentilini, A. and Shafer, S.L. (2000) Response Surface Model for Anesthetic Drug Interactions. Anesthesiology, 92, 1603-1616.
http://dx.doi.org/10.1097/00000542-200006000-00017
[31] Bruhn, J., Bouillon, T.W., Radulescu, L., Hoeft, A., Bertaccini, E. and Shafer, S.L. (2003) Correlation of Approximate Entropy, Bispectral Index, and Spectral Edge Frequency 95 (SEF95) with Clinical Signs of “Anesthetic Depth” during Coadministration of Propofol and Remifentanil. Anesthesiology, 98, 621-627.
http://dx.doi.org/10.1097/00000542-200303000-00008
[32] Alvis, J.M., Reves, J.G., Spain, J.A. and Sheppard, L.C. (1985) Computer-Assisted Continuous Infusion of the
Intra-venous Analgesic Fentanyl during Generalanesthesia—An Interactive System. IEEE Transactions Biomedical
Engi-neering, 32, 323-329. http://dx.doi.org/10.1109/TBME.1985.325545
[33] Ang, K.H., Chong, G. and Li, Y. (2005) PID Control System Analysis, Design, and Technology. IEEE Transactions on
Control Systems Technology, 13, 559-576. http://dx.doi.org/10.1109/TCST.2005.847331
[34] Carvajal, J., Chen, G. and Ogmen, H. (2000) Fuzzy PID Controller: Design, Performance Evaluation, and Stability A-
nalysis. Information Sciences, 123, 249-270. http://dx.doi.org/10.1016/S0020-0255(99)00127-9
[35] Çetin, Ş. and Akkaya, A.V. (2010) Simulation and Hybrid Fuzzy-PID Control for Positioning of a Hydraulic System.
Nonlinear Dynamics, 61, 465-476. http://dx.doi.org/10.1007/s11071-010-9662-1
[36] Hagras, H. (2007) Type-2 FLCs: A New Generation of Fuzzy Controllers. IEEE Computational Intelligence Magazine,
2, 30-43. http://dx.doi.org/10.1109/MCI.2007.357192
[37] John, R. and Coupland, S. (2007) Type-2 Fuzzy Logic: A Historical View. IEEE Computational Intelligence Magazine,
2, 57-62. http://dx.doi.org/10.1109/MCI.2007.357194
[38] Lam, H.K. and Seneviratne, L.D. (2008) Stability Analysis of Interval Type-2 Fuzzy-Model-Based Control Systems.
IEEE Transactions on Systems, Man, and Cybernetics, Part B: Cybernetics, 38, 617-628.
http://dx.doi.org/10.1109/TSMCB.2008.915530
[39] Lam, H.K., Li, H., Deters, C., Wuerdemann, H., Secco, E. and Althoefer, K. (2014) Control Design for Interval Type-2 Fuzzy Systems under Imperfect Premise Matching. IEEE Transactions on Industrial Electronics, 61, 956-968.
http://dx.doi.org/10.1109/TIE.2013.2253064
[40] Mendel, J.M., John, R.I. and Liu, F. (2006) Interval Type-2 Fuzzy Logic Systems Made Simple. IEEE Transactions on
Fuzzy Systems, 14, 808-821. http://dx.doi.org/10.1109/TFUZZ.2006.879986
[41] Mendel, J.M. (2007) Type-2 Fuzzy Sets and Systems: An Overview. IEEE Computational Intelligence Magazine, 2, 20-29. http://dx.doi.org/10.1109/MCI.2007.380672
![Figure 2. Structure of a three-compartmental PK model with effect-site com- partment [29]](https://thumb-us.123doks.com/thumbv2/123dok_us/8041069.771433/4.595.176.458.88.256/figure-structure-compartmental-pk-model-effect-site-partment.webp)