IMPROVING THE PERFORMANCE OF K-MEANS
ALGORITHM USING AN AUTOMATIC CHOICE OF
SUITABLE CODE VECTORS AND OPTIMAL NUMBER OF
CLUSTERS
1MOHAMED ETTAOUIL, 2ESSAFI ABDELATIF, 3FIDAE HARCHLI 123
UFR: Scientific Computing and Computer Sciences, Engineering Sciences
Modeling and Scientific Computing Laboratory Faculty of Sciences and Technology
University Sidi Mohamed Ibn Abdelah, FES, MOROCCO
E-mail: [email protected], [email protected], [email protected]
ABSTRACT
The automatic clustering is a useful tool for data-mining. It‘s a daily necessity for the searcher whatever his specialty. Indeed because of the huge amount of information available on the web-site, the access to relevant information in a suitable time is a difficult task. By grouping those informations in clusters this problem can be surmounted. Many clustering methods exist in the literature but the efficient ones suffer from some drawbacks. The main of them follows from the initialization phase which is performed randomly. Among these algorithms we find the k-means(deterministic and probabilistic version) and the clustering method based on Gaussian mixture. In these algorithms the initial parameters including the number of cluster are chosen randomly. Consequently an improper choice leads to poor clusters. In this paper we propose an approach attempting to overcome these problems. In this method the initial parameters are automatically and suitably identified. To this end, the structure of data is investigated in each iteration. To validate the proposed method a number of experiments are performed.
Keywords: Clustering, K-Means, Evaluation Clustering
1.
INTRODUCTIONActually the site-web is the useful mean to acquire information. The examination of all documents containing the desired information is an impossible task. The clustering presents a suitable solution of this problem. Indeed the goal of the classification is to split the inputs into groups such that the objects of the same group areas similar as possible, while the elements belonging to different groups should be as dissimilar as possible. So the search focuses only on a reduced number of documents. Thereby one reaches to reduce significantly the desired information. The clustering is used as a tool to acquire more understanding about data [14]. So it applied in several domains: Information retrieval, climate, Psychologies and medicine, management and market analysis, risk analysis, web mining and text mining Traffic flow [4][9], combinatorial optimization [20], text summarization, and vector quantization [6][17][12],etc.
According to the technique used by the algorithm and the kind of expected types of clusters, different categories of clustering are distinguished [16]: hierarchical versus partitional, deterministic versus probabilistic (fuzzy clustering), exclusive versus overlapping, complete versus partial, and parametric versus non-parametric.
Partitional clustering: In each iteration of this type of algorithms, the clusters are destroyed and rebuilt again. This process continues until a stabilization of the cluster is realized. As outputs, those algorithms provide clusters with non-overlapping subsets. While the hierarchical systems produce a tree of clusters. It consist of a number of it of iterations, in each of them the most similar clusters are merged (ascending hierarchical) or the dissimilar one are divided (descending hierarchical).
probabilities. This type of algorithm is called fuzzy clustering.
Complete clustering vs partial one: In the complete system all the objects contribute in the clustering. While in the partial one, only a part of data does.
There exists other categorization of clustering. Regardless its type, a clustering algorithm aims to produce clusters with high quality: Indeed, it has to realize an important intra-class similarity and low inter-class similarity. Those indexes measure respectively the homogeneity within the clusters and the separability between them. Many algorithms exist in the literature. These systems process data without possessing any knowledge about them. In addition, they are based on unknown parameters. These latter are chosen randomly in the initialization phase. Hence, the choice of these parameters influences the outcome of these algorithms. For instance the result of the neural Kohonen algorithm depends on the choice of initial weight vectors and initial architecture map; the performance of K-means algorithm is influenced by the choice of initial code vectors and their number and in the EM algorithm the choice of the parameters μ π ε0, ,0 0has a great influence on the quality of the result, the thing which push researchers to find solutions [10]. This affects the performance of those systems.
Dealing with those problems is a difficult task. Although enormous efforts conducted in this vein, the proper solution is not yet realized.
In this work we propose an approach to determine automatically the optimal number of clustering and the suitable initial code vectors in the K-means algorithm. The used process is incremental and it consists of a number of iterations. In each one, the system looks for new code vectors from the area of the high density. Then the standard k-means algorithm is conducted. At the end of each iteration, the quality of obtained clusters is evaluated. This evaluation is performed according to some useful criteria or stopping rule [15]. The optimality of the number of clusters is also tested using some adequate indexes. Depending on the result of the evaluation phase the next iteration will be performed or not.
The rest of this paper is organized as follows: in Section 2 a review of k-means algorithm is represented. In Section 3some existing works are given. Section 4 is reserved to the proposed method. Section 5 is reserved to the validation of
this work. Finally Section 6 concludes the paper and gives some perspectives.
2.
K-MEANS ALGORITHMK-means is a partitional and deterministic algorithm. It’s widely used in scientific and industrial area. As is indicated by its name, in this algorithm the classes Ckis represented by their
centroids
i k
k OεC i
k
1
μ O
C
=
∑
where Ck is thecardinality of the classes Ck .This algorithm attempts to provide a partition of the given data such that the centroids of provided classes are the minima of the following objective function:
( 1 k)
h
h μ , ,μ
h xÎx
min …
∑∑
x -μFinding an exact solution is NP-hard. So a number of algorithms use heuristic approach to solve this problem. The k-means algorithm belongs to the set of those methods. Indeed the underlying of this algorithm is to find the solution of this problem using an iterative process consisting on a number of iterations in each one the classes are destroyed and replaced by their centroids. The news classes are rebuilt using the principle of nearest neighbor i.e. the class Ci is formed by the elements y solution of the following equation:
j
μi =
arg min
y -μjThis process can be summarized in the following steps:
Step 1: determine the coordinates of centroids Step 2: determine the distance between each data point and the centroids of classes
Step 3: group the data points based on minimum distance
The previous stages are repeated until convergence (stability of classes).
2.1.Advantages Of K-Means
Because of its practice properties, K-means algorithm remains the most popular. Among those advantages we present the followings:
1. The comparison is conducted only between the observations and the center of classes
3. Practically it’s very easy to implement this algorithm. Furthermore it’s more convenient when there are a large number of data points (thousands).
2.2.Disadvantages Of K-Means
This algorithm suffers from some shortcomings which affects its efficiency. Among those drawbacks we present the following:
1. The choice of initial parameters: A great number of the initial code vectors leads to some redundant clusters. The presence of number of outliers in the set of initial code vectors provides poor clusters
2. Function chosen to measure the similarity between the objects must be adapted to the investigated data. The Euclidian distance is the useful measure but in certain case it is not the most appropriate
3. It can deal only with spherical and symmetrical point distribution
Figure 1.Illustrate The Process Of K-Means Algorithm
3.
RELATED WORKSAs is reported above the K-means algorithm is an efficient clustering method. It has a certain self-adaptive and can achieve dynamic clustering [7]. Generally it provides satisfactory results, chiefly when the data is large. But its performance is largely dependent on the estimation of some inputs parameters as the initial code vectors including their number. Several approaches attempted to deal with this problem. Most of these latter are post clustering i.e. they choose the set of codes which is the partition and which provides the best partition from a number of alternative ones [22].Searchers choose randomly the number of clusters tried to determine suitable means. To this end they look for some information about the investigated data or they pick iteratively the inputs which decrease the related objective function. Others work focus on determining the optimal number of clusters. In this vein several techniques exist in the literature:
Certain choose the value of caring into count some characteristic of data for example its size by fixing
the value of the ratio k
n where k is the number of
clusters and n is the size of data. In certain case k is required by the user. Some methods use the stability of clusters as techniques to improve the performance of K-means algorithm and to determine the optimal value of k. Some incremental process beginning by a little number of means (one or two) and in each iteration adds as mean the object whose distance to the closest mean is the biggest. Others Techniques are used such Prim [19] [5][2]. In the works [11][21], the author uses the genetic algorithm to check the suitable code vectors set. In [1] authors use an incremental process called fast global k-means. Other authors hybrid K-means algorithm with other to overcome the problems above [3]. Some authors defined functions measuring the validity of the number of clusters k [8]. In [13] the authors find the right number of cluster by extracting the anomalous pattern from the data one by one.
4.
DESCRIPTION OF THE PROPOSED METHODSAs is well known, the k-means algorithm gives reasonably efficient partitions. Furthermore it is easily programmed and computationally economical. These properties imply its feasibility to process large sample. Therefore it is interesting to overcome the shortcomings of this algorithm. The work presented in this paper is part of the works which aims to realize this goal. More precisely we attempt to surmount the problem of the initialization phase which is performed randomly in the original algorithm, and where the user has to choose a suitable initial code vectors and the number of classes.
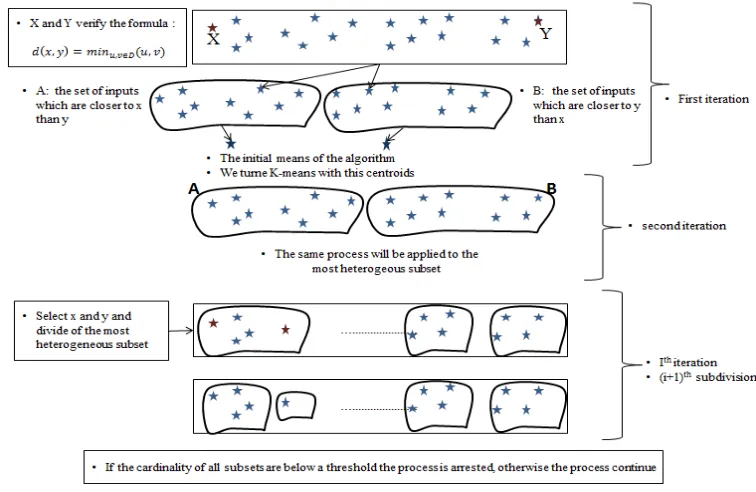
In the first iteration we determine the two elements x and y which verify the following formula:
( )
u,v D( )
d x,y min u,v
∈
=
Where D is the given inputs under treatment. Then we form two subsets𝐶𝑥 formed by the closest objects to x and 𝐶𝑦 formed by those which are closest to the object y. The centroids of these subsets are presented to k-means as initial means which provide some clusters. In the next iteration,
[image:4.612.117.495.224.470.2]the most heterogeneous subset of the previous ones is divided into two groups using the same technique used in the first iteration. Then, the subset whose number of elements is below to a given threshold is removed. If the two subsets verify this condition the same process is conducted to the remaining subsets so on until all the subsets realize this condition or a predefined stop criterion is satisfied. The system is arrested when all the subsets contain a single element.
Figure 2.Shows Different Stages Of The First Proposed Method
The process can be summarized in the following steps:
The first iteration:
1. The search of the two most distant objects x and y
2. Construction of two classes: Using the principle of nearest neighbor we form two classes Cx and Cy
3. Identification of centroids of Cxand Cy denoted respectively x and y
4. Application of K-means algorithm using x and y as an initial means
The (i+1)th iteration:
1. Verification of stopping criterion: if these condition are realized the system is arrested otherwise following operation are conducted
2. Identification of outliers: If all classes obtained in the previous iteration have cardinality below to predefined threshold, the system is arrested .Otherwise the most heterogeneous subset among these obtained in the previous iteration is divided into two subsets using the same technique used in the first iteration
3. Removal of some clusters: If the both new subsets have cardinality below predefined threshold those subsets are removed and the process is applied to the remaining ones. Otherwise the subset which doesn’t verify this condition is added to those obtained in the ith iteration and their
centroids are presented to K-means algorithm
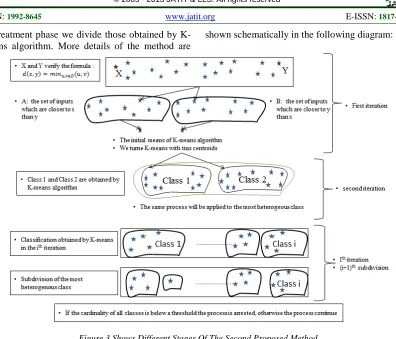
pretreatment phase we divide those obtained by K-means algorithm. More details of the method are
[image:5.612.108.504.65.404.2]shown schematically in the following diagram:
Figure 3.Shows Different Stages Of The Second Proposed Method
5.
ASSESSMENT OF CLASSIFICATION To evaluate the quality of a classification is a delicate task. Generally evaluation of clustering techniques in data mining refers to the assessment of some values such: performance, functionality, usability, ancillary Task Support [18].In the classification area we differentiate between two concepts:
5.1.Evaluation
Since the evaluation of the classification quality plays an essential role in the proposed algorithm, we present some useful assessment criteria for clustering algorithms.
5.1.1. Rand index
This index is measured by calculating the ratio of the objects correctly classified and is defined as
follows: R a b
a b c d + =
+ + +
Where:
( )
( )
( )
( )
{
}
( )
( )
( )
( )
{
}
( )
( )
( )
( )
{
}
( )
( )
( )
( )
{
}
ref ref obt obt ref ref obt obt
ref ref obt obt ref ref obt obt
a i, j \ C i C j C i = C j
b i, j \ C i C j C i C j
c i, j \ C i C j C i C j
d i, j \ C i C j C i C j
= =
= = ≠
= ≠ =
= ≠ ≠
5.1.2. Silhouette index
The average silhouette can be used to measure the quality of clusters and the optimality of their number. It is defined by the following formula:
( )
( ) ( )
( ) ( )
}
{
b i -a i
S i
max a i ,b i
=
which can be written as
:
( )
( )
( )
( ) ( )
( ) ( )
( )
( )
( ) ( )
a i
1 , if a i b i
b i
0 if a i b i
b i
1 if a i b i
a i
S i
− <
=
− >
Where: a i
( )
is the average dissimilarity of xi with all other data within the same cluster and b i( )
is the lowest average dissimilarity to xi of any such cluster.We report that:− ≤1 s i
( )
≤1 More that S i( )
is close to 1 more than xi is correctly classified. In contrast, if S i( )
is close to -1 xi is appropriately clustered. Finally, if this value is about zero, xi is on the border of two natural clusters.We have not used this definition of Rand index or Silhouette index because it not cares into count the number of classes (n). Since in our work we attempt to look for a suitable number of classes, we developed a new indexNi.
(
silhouette)
2Ni n
silhouette 150
=
+
This proposed index establishes a trade-off classification quality and the number of classes. 5.2.Stability
The stability of clusters is a way to investigate or discover the structure of data. It can also be used to look for an optimal number of classes. It is defined as follows:
Let P , ,P1 L be a set of partitions of a data set.
The aim is to find a resultant partition P*which best represents the structure of the given set. There exist two approaches to measuring the stability of a set of partitions: pairwise and non-pairwise.
(
)
( )
p i j
1 i j L
2
S S P ,P
L L 1 ≤ < ≤
=
−
∑
Where S P ,P
( )
i j is the degree of match betweenthe partition Piand Pj. To measure this latter we use the adjusted rand index.
𝐴𝑅
(
𝐴
,
𝐵
) =
∑
∑ �
𝑛𝑖𝑗
2
� − 𝑡
3𝐾𝐵 𝑗=1 𝐾𝐴 𝑖=1
1
2 (
𝑡
1+
𝑡
2)
− 𝑡
3𝑡1=∑ �kAi=1 ni2�;𝑡2=∑ �kBj=1 mj2�;𝑡3=𝑁2𝑡1𝑡2(𝑁−1)
Where A and B two partitions with KAand KB are respectively the cardinality of A and B. ni be
the number of objects in cluster i in partition A and
j
m be the number of objects in cluster j in partition
B. Denote by nij the number of objects which belong simultaneously to cluster i in partition A and cluster j in partition B.
The stability of clusterers is used in this paper as follows:
We use the version of rand index which is mentioned just above, to compare partitions obtained in two successive iterations. When the value returned by the stability criterion remains unchanged the system is arrested. And the best partition is chosen as output of the system.
6.
EXPERIMENTSTo validate our proposed methods, some experiments are performed. In this context we used the data set IRIS. This latter is widely used is the quality classification area. The inputs of this data set are ranked in three groups and they are characterized by four components.
[image:6.612.319.523.497.695.2]In the two proposed methods we have conducted two experiments. In the first one we attempt to determine a suitable number of classes i.e. whose classification quality is the best according to the proposed criterion. The results obtained by this experiment are stored in Table 1(first method) and Table 2(second method) and illustrated in Figure 4(first method) and Figure 5(second method).
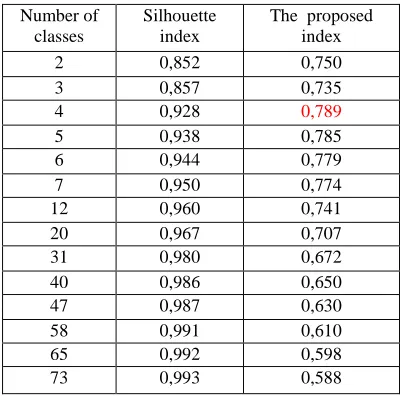
Table 1.Evaluation Of The Classification Quality Versus The Number Of Classes (1st Proposed Method)
Number of classes
Silhouette index
The proposed index
2 0,852 0,750
3 0,857 0,735
4 0,928 0,789
5 0,938 0,785
6 0,944 0,779
7 0,950 0,774
12 0,960 0,741
20 0,967 0,707
31 0,980 0,672
40 0,986 0,650
47 0,987 0,630
58 0,991 0,610
65 0,992 0,598
Figure 4.Illustrates the variation of classification quality according to two indexes versus the number of classes
(1st
[image:7.612.313.523.103.515.2]method)
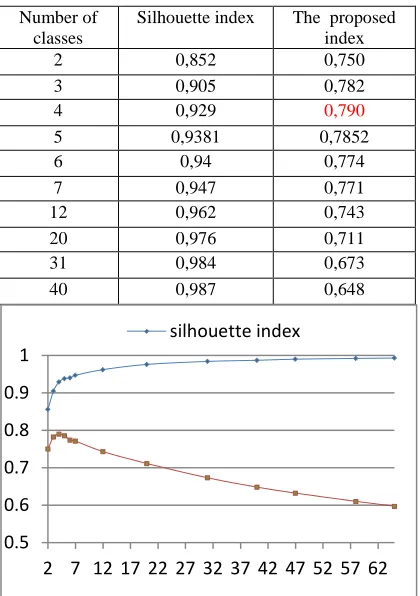
Table 2.Evaluation Of The Classification Quality Versus The Number Of Classes (2nd Proposed Method)
Number of classes
Silhouette index The proposed index
2 0,852 0,750
3 0,905 0,782
4 0,929 0,790
5 0,9381 0,7852
6 0,94 0,774
7 0,947 0,771
12 0,962 0,743
20 0,976 0,711
31 0,984 0,673
40 0,987 0,648
Figure 5.Illustrates the variation of classification quality according to two indexes versus the number of classes
(2nd method)
The examination of the above tables shows that the suitable number of classes is four according to the proposed criteria in the two proposed methods.
By comparing the two methods, we find that the second was more powerful than the first and this is proved by the proposed index.
Table 3.The Measure Of Stability With Successive Partitions
Successive partitions Stability
2,3 0,55
3,4 0,71
4,5 0,87
5,6 0,99
6,7 0,94
7,8 0,89
8,9 0,97
9,10 0,78
10,11 0,96
11,12 0,99
12,13 0,97
13,14 0,91
14,15 0,92
15,16 0,84
16,17 0,96
17,18 0,95
19,20 0,96
20,21 0,99
21,22 0,99
Figure 6.Evaluation Of Classification By Stability Criterion
Figure 6 presents stability between successive partitions obtained by second proposed method. This figure shows that the best stability is obtained when the number of class is closer to the number four. So this criterion can be used to stop the system. Therefore the number of the iteration is reduced.
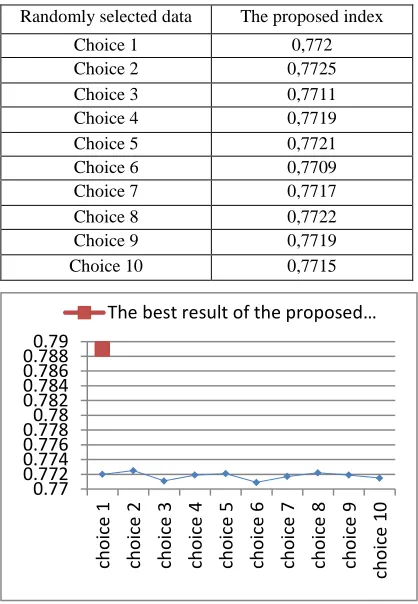
In the second experiment the original K-means algorithm is performed several times. In each one, we use four code vectors chosen randomly aiming to compare the first proposed method with the original one. The classification quality obtained in this experiment is presented in Table 2 and represented in Figure 7.
0.55 0.62 0.69 0.76 0.83 0.9 0.97 1.04
2 7 12 17 22 27 32 37 42 47 52 57 62 67 72 proposed index
0.5 0.6 0.7 0.8 0.9 1
2 7 12 17 22 27 32 37 42 47 52 57 62 silhouette index
0.5 0.7 0.9 1.1
[image:7.612.91.301.303.601.2]Table 4.The Classification Quality Obtained By Original K-Means Using Four Code Vectors Chosen Randomly
Randomly selected data The proposed index
Choice 1 0,772
Choice 2 0,7725
Choice 3 0,7711
Choice 4 0,7719
Choice 5 0,7721
Choice 6 0,7709
Choice 7 0,7717
Choice 8 0,7722
Choice 9 0,7719
Choice 10 0,7715
Figure 7.The Classification Quality Obtained By Original K-Means Using Four Code Vectors Chosen
Randomly
Table 4 and Figure 7 show that the proposed method identifies and generates automatically suitable code vectors and surmounts classical K-means. Therefore it gives a satisfactory classification.
Finally, those experiments show that the proposed methods are able to generate suitable code vectors automatically and to determine a number of classes closer to the real one (the founded number is four and the real one is three).
7.
CONCLUSION AND PERSPECTIVES Because of its excellent property whose some ones are represented above in this paper, K-means algorithm is widely used in classification area. Unfortunately, it suffers from some drawbacks whose main stems from its dependency on initialization phase. In this latter a number of cluster and code vectors are chosen randomly. So an inappropriate choice leads to bad result.In this work, we proposed two methods which aim to overcome this problem by choosing automatically suitable initial code vectors.
The experiments performed to validate this method give satisfactory result.
As perspective, we will integrate other parameters and criteria attempting to more improve the performance of this method and we will apply this approach in other domain as text classification field and text summarization.
REFRENCES:
[1] A. Likas, N. Vlassis, and J. Verbeek, “The global k-means clustering algorithm”, Pattern Recognition, 2003, pp. 451 – 461.
[2] A. Srinivasulu, V. Subba Rao, and V. Saikrishna, “Finding the Number of Clusters in Unlabeled Datasets using Extended Dark Block Extraction”, International Journal of Computer Applications, Vol. 7, No. 3, September 2010.
[3] B.F. Bahmani, T. Niknam, and M. Nayeripour, “A New Evolutionary Algorithm for Cluster Analysis”, World Academy of Science, Engineering and Technology, 2008.
[4] B.H. ChandraShekar, and Dr. G. Shoba, “Classification of Documents Using Kohonen’s Self-Organizing Map”,
International Journal of computer Theory and Engineering, Vol. 1, No. 5, December 2009. [5] C. Ordonez, E. Omiecinski, “Efficient
Disk-based K-means clustering for Relational Databases”, IEEE Transactions on Knowledge and Data Engineering, Vol. 16, No. 8, August 2004.
[6] DR. H.B. kekre, Ms. Tanuja, and K. Sarode, “Vector Quantized Codebook Optimization Using K-Means”, international journal on computer science and engineering, Vol. 3, 2009, pp. 283-290.
[7] D. Shifei, Li Xu, Z. Hong, and Z. Liwen, “Research and Progress of Cluster Algorithms based on Granular Computing”, International Journal of Digital Content Technology and its Applications, Vol. 4, No. 5, August 2011. [8] D.T. Pham, S.S. Dimov, and C.D. Nguyen,
“Selection of k in K-means clustering”, J. Mechanical Engineering Science, Vol. 219, September 2004, pp. 103-119.
[9] H. Chunchun, L. Nianxue, Y. Xiaohong, and S. Wenzhong, “Traffic Flow Data Mining and Evaluation on Fuzzy clustering Techniques”,
0.77 0.772 0.774 0.776 0.7780.78 0.782 0.784 0.786 0.7880.79 ch oi ce 1 ch oi ce 2 ch oi ce 3 ch oi ce 4 ch oi ce 5 ch oi ce 6 ch oi ce 7 ch oi ce 8 ch oi ce 9 ch oi ce 10
International Journal of Systems, Vol. 13, No. 4, December 2011.
[10]I. Meilijson, “A Fast Improvement to the EM Algorithm on its Own Terms”, J.R. Statist. Sac. B, Vol. 51, No. 1, 1989, pp. 127-138. [11]K. Krishna, and M.N. Murty, “Genetic
K-means Algorithm”, IEEE Transactions on Systems, part b: cybernetics, Vol. 29, No. 3, June 1999, pp. 433-439.
[12]M. Ettaouil, M. Lazaar, Y. Ghanou, “Vector Quantization by Improved Kohonen Algorithm”, journal of computing, Vol. 4, No. 6, June 2012, pp. 111-117.
[13]M. Ming-Tso chiang, and B. Mirkin “Intelligent Choice of the Number of Clusters in K-Means Clustering: An Experimental Study with Different Cluster Spreads”, Journal of Classification, 2009.
[14]N.P. Tan, M. Steinbach, and V. Kumar, “Introduction to Data Mining” Pearson Education, 2007.
[15]O. Ammor, N. Raiss, and K. Slaoui, “Détermination du nombre optimal de classes présentant un fort degré de chevauchement”,
Revue MODULAD, No. 37, 2007, pp. 31-42. [16]P. Rai, and S. Siingh, “A survey of Clustering
Techniques”, International Journal of Computer Applications, Vol. 7, No. 12, October 2010, pp. 0975-8887.
[17]P. Stuart Lloryd, “Least squares quantization in PCM”, IEEE Transactions on Information Theory, Vol. 28, No. 2, March 1982, pp. 129-137.
[18]Q. Manying, S. Davis, F. Ikem, “Evaluation of clustering Techniques in Data Mining Tools”,
Issues in Information systems, Vol. 5, No 1, 2004, pp. 254-260.
[19]R.C. Prim, “Shortest connection networks and some generalizations”, Bell System Technical Journal, November 1957, pp. 1389–1401. [20]R. Nallusamy, K. Duraiswamy, R.
Dhanalaksmi, and P. Parthiban, “Optimization of Non-Linear Multiple Traveling Salesman Problem Using K-Means Clustering, Shrink Wrap Algorithm and Meta-Heuristics”,
International Journal of Nonlinear Science, Vol. 8, No. 2, 2009, pp. 480-487.
[21]S. Sharma, and S. Rai, “Genetic K-Means Algorithm – Implementation and Analysis”
International Journal of Recent Technology and Engineering (IJRTE), Vol. 1, No. 2, June 2012, pp. 117-120.
[22]W.G. Milligan, and M.C. Cooper, “An Examination Of Procedures For Determining The number Of Clusters In Data set”,