ISSN: www.jatit.org E-ISSN:
AN EXTENDED ARTIFICIAL IMMUNE SYSTEM FOR
VOLTAGE PROFILE OPTIMIZATION USING UNIFIED
POWER FLOW CONTROLLER
K.A. RANI FATHIMA #1, T.A. RAGHAVENDIRAN *2
# Department of Electrical and Electronics Engineering, Sathyabama University, Chennai, India
* Department of Electrical and Electronics Engineering, Anand Institute of Higher Technology, Chennai, India
E-mail:[email protected], [email protected]
ABSTRACT
Unified Power Flow Controller (UPFC) is a most versatile device to control the power flow in transmission lines efficiently by injecting active and reactive voltage components in series with transmission lines using power converter modules and dependent on an external dc-link voltage. This proposed novel method is capable of minimizing the overall system losses and simultaneously improves the voltage stability, by effectively controlling the power flow. These multiple constraints are satisfied by tuning the UPFC parameters using optimization algorithm. In this paper the EAIS-[Extended Artificial Immune System technique] is used to optimise the parameters of the unified power flow controller in order to improve the voltage profile. EAIS is a novel approach with minimum iterations that combines partial solution to reach the final solution. In this study, EAIS optimization engine is developed , where the control variables of the Unified power flow controller is embedded into the system’s data. This algorithm is implemented in MATLAB environment and tested in IEEE-30 BUS system. The Extended Artificial Immune System gives comparatively promising results than the existing techniques of AIS.
Keywords: FACTS, Power Control, Power Systems, Power Optimization, Transmission Lines, UPFC, VP.
1. INTRODUCTION
Recently, the complexity and size of the power systems are growing unanimously and demands for interconnection to assure the reliability of power supply in any situation even during contingencies by sharing the spinning reserves. Due to these constraints load frequency control and power flow necessitates decentralization to ensure the reliability and quality of power control. In this paper enhancement of voltage profile is performed by EAIS optimization technique. EAIS is extended from AIS, where AIS extended from immune system. The algorithm is developed with the basic knowledge, theory and the components of the immune system [1]. The parameters of the UPFC system can alter and adjust the transmission variables and effectively modify the power flow in the transmission lines. The transmission line values are altered by introducing the UPFC in series and the performance is evaluated on the IEEE 30-bus system. This novel methodology is proposed for voltage profile enhancement after rigorous review of earlier research papers and hence the EAIS optimization method is adopted.
The detailed literature review of this paper is given below.
A Direct Power Control which based on an instantaneous power theory can help to apply the full potential of the power converter. The direct power control is an efficient technique to control the UPFC [1]. UPFC included transmission line can also be checked for detecting the fault location in proposed technique [2]. In this the fault interval is taken for analysis. It uses the synchronous data collected from both the ends of the transmission line. The transient behavior of UPFC is examined in paper[3] where the phase-shift transformers are replaced using the voltage-source converters. The voltage profile can be controlled and improved [4] by checking the impedance value of the transmission lines. This paper examines the relay performance during power swing for the un-compensated and un-compensated transmission with the UPFC. A new technique introduced for controlling the UPFC is the ANFIS algorithm [5].
ISSN: www.jatit.org E-ISSN: Flow Oscillations, a linear model having,
synchronous machine is connected to more number of buses with UPFC [6]. Also this paper used ANN damping controller compared with the lead-lag controller. Unbalanced voltage sag containing phase jumps due to UPFC with real low power injection is mitigated by a proposed approach [7]. In this paper the main objective was to get the minimum real power injection using UPFC. A MATLAB based UPFC application combined with Power Oscillation Damping controller was developed for damping the oscillations. In this paper an EAIS based optimized voltage profile optimization algorithm is developed to enhance the efficiency of the UPFC.
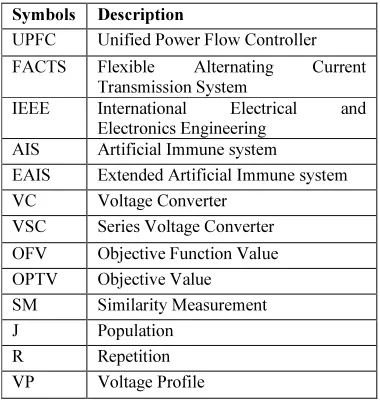
[image:2.595.303.515.71.262.2]1.1 NOMENCLATURE
Table 1.Unified Power Flow Controller
Symbols Description
UPFC Unified Power Flow Controller
FACTS Flexible Alternating Current Transmission System
IEEE International Electrical and Electronics Engineering
AIS Artificial Immune system
EAIS Extended Artificial Immune system
VC Voltage Converter
VSC Series Voltage Converter
OFV Objective Function Value OPTV Objective Value SM Similarity Measurement
J Population
R Repetition
VP Voltage Profile
Several types of FACTS devices are available namely SVC, VAR, TCSC and UPFC. One of the most technically adaptive devices in the FACTS family is UPFC and it is able to regulate the voltage and phase angle simultaneously in a power system. This can be achieved by injecting reactive power into the transmission lines.
[image:2.595.93.283.335.536.2]1.2 UPFC OPERATION PRINCIPLES The UPFC model is depicted in Figure-1 and it consists of two voltage source converters – [VSC], which connected back to back through a DC link capacitor.
Fig-1: Upfc Model
The power flow is controlled by injecting voltage in series with the transmission line, and this injected voltage can be varied with respect to phase and amplitude in accordance with the real and reactive power requirement. The series voltage source converter is connected to the transmission line through a series transformer while the shunt converter is a three leg three phase Graetz bridge converter with a DC side and a three phase AC side. The three phase AC side is connected across the three phase AC transmission lines at the PCC through a voltage transformer as shown in figure 1.
Fig-2: Upfc-Series Model
It easy to control the amplitude and phase of the series voltage in the UPFC and it is assumed that the Vs is linked in series to the transmission among the bus i and bus j.
Fig-3: Sample Series Branch Circuit
ௌ
[image:2.595.314.516.445.548.2] [image:2.595.310.521.621.731.2]
ISSN: www.jatit.org E-ISSN:
2, ! "
#"
$" !"!%.
The voltage source & is replaced by the current
source '( )$& to obtain the series branch
model where the current source is parallel with reactance % [6].
There are two current sources injects '* and
+* into the buses " ) and it can be
represented as:
*̅( -. '̅/ ∗ --- Equation [1]
*̅( -. '̅/ --- Equation [2]
1 * ( -2 . )$- 3 ∗ ---- Equation
[3]
( $ sin 4 )$!4
Let assume5 ( 5 5 ; 7,
*̅( -8)$-
ം 9*
= ( $-sin:5; 4< ; )$-cos .5;
4/ ---Equation [4]
From the Equations given above, - is defined
as;
-( - ; 1 0 @ @ 1;
According to the Equation [1] and [2], the voltage dependent loads are considered from series voltage source. So that the %’s equivalency will adjust or
modify the actual parameter of the transmission line. This creates the stimulus to the quantity of power flow through the line, which successively giving impact to the voltage at the receiving bus. According to the requirement and the financial capacity many UPFC can be installed in the system improve the power flow optimization.
2. INTRODUCTION TO ARTIFICIAL IMMUNE SYSTEM
Artificial Immune System is an immune system from biological field and it can be adapted, distributed and paralleled. Also it is an adaptive system enthused by imaginary immunology and experiential immune functions, ideologies and representations which are smeared to multifaceted problem domains. AIS are applied primarily to optimization problems also data mining and information security systems. AISs are influential when a population of answer is vital either during the search or as an outcome. Also, the problem has to have some notion of ‘matching’. Lastly, because at their heart AISs are evolutionary algorithms, and AIS have appropriate solutions for difficulties
that arise over time, and fairly it is needed to be solved every time, rather than extraordinary optimizations. In general, there are four decisions have to be taken to implement the AIS, they are Indoctrination pattern, Likeness Measure, Choice and Optimization. Once the Pattern has been generated likeness measurement is found out, and the best choice is chosen and optimization algorithm is applied for the best choice [17].
2.1 Algorithm Of AIS
Generally the AIS functionality is defined as a step wise process:
Initial population process.
Cloning process. The AIS will produce the same number of clones for each individual.
The affinity maturation procedure which will result a population of matured clones.
Determine the affinity of the matured clones in conjunction with the objective function whether to maximize or minimize.
Compare the affinity of the memory population, if converge the optimization is achieved, if diverge the algorithm go back to 2. The VP optimization can be obtained by considering some control variable namely;
1, 2 " 3 representing the reactances of the
UPFC which is available in the transmission lines. The result of the study generated three random values in the initialization step according to the objective function 7 for improving the VP in the selected transmission line of the power system and those values are inserted into 25, 28 and 30 line-data of the IEEE-bus RTS. The output voltage greater than the input voltage set are set as the inequality constraint and the voltage set is computed by executing the load flow program, it is iteratively tested at various loading conditions.
2.2 Implementation Of Ais Algorithm
ISSN: www.jatit.org E-ISSN:
1. '"C ##" C + D 3 7 1, 2, 3
2. E 1! 7 @ _._/ 3. !! E 7 ! _ " + D 3
4. H I $I " 7 ! "
5. K I " , ! $ 7 _ 7 + D 3 6. MN#" !" 7 M, $I " $ " 7 +, $ ##"
M!" " $ "O " !$" 1, 2, 3. H C 7 M ##" I .
7. !" I 7 ! M, " "$I 7 +. 8. M" " 1 1 " "1 # 1, 2, 3. H 1 ! !" $ #! $I .
ISSN: www.jatit.org E-ISSN: 2.3 AIS Flowchart
Fig-4: AIS Flowchart
Set population size J generate the random population for a1, a2, a3
For I = 1 to J; for j = 1 to R [number of iteration]
Next i, Next j
Create new copies of a1, a2, a3as named S
For each E do reverse change
Elect the random parameters and find the OFV and similarity measurement sm with election rate E, arrange it in ascending order
If a1, a2, a3 satisfy the unequal constraint Set OFV as a1, a2,
a3
Do pair wise change in E and find OFV
If a1, a2, a3 satisfy the unequal
constraint
E = final E [ not changed E] Set OFV as a1,
a2, a3
New S after election and changes
Sort the changed s, arrange in uphill order due to OFV and eliminate K% of E
Generate the new S [i.e., a1, a2, a3] for next iteration
ISSN: www.jatit.org E-ISSN: 2.4 AIS ALGORITHM
T" U#" +
K # V"" U!
H T'* 1 "$
7 !" 7 ! " .
H 77"I " #!
1! 1 " ##" 7 !".
K" 77"I 7
!" " !")"!" 1 $)! 7"!" 1 NC "C.
V# 77"I 7
##", 7 !" #C" ! , 7
$!W # 1.
2.5 EXTENDED ARTIFICIAL IMMUNE SYSTEM – [EAIS]
The AIS algorithm converges slowly to find global minimum and has many limitations. AIS finds minimum solution from problems directly, but the EAIS is applied to find the best optimum voltage value from a combined small size solutions. The use of small size solutions is to improve the efficiency of the algorithm. The creditability of the proposed approach is evaluated by simulations, and it is showing the performance of the proposed approach achieves better results comparatively with the AIS [3].
In this paper, an algorithm is developed in accordance with artificial immune system and that has been extended to include the creation process of a multitude of antigens, which are potential solution candidates. In a highly constrained problem, the sum of all constraints implicitly represents the set of all valid and attractive solutions. The challenge is to find an explicit representation for elements of this set. This can be achieved by constructing large partial solutions through aggregating building blocks until a final solution is found. Hence, our concept consists of two parallel, cooperating processes. The first one corresponds to the interaction between antigens and antibodies as found in traditional AIS. The second process encompasses the creation of new antigens. Sets building blocks, which can be interpreted as partial solutions, correspond to antigens in our model.
2.6 ALGORITHM OF EAIS
1. T + "$ 7 ##" "
S "$ 7 "
2. X "!" 7 +.
3. " # 7 , , " .
4. " " ##" 7 ! " " +
5. K S, + "$ 7 "
! M. Where E = { a1, a2, a3..}
6. 7" I " *Y 7 ! " " $)! !!" T" ! " !!" *Y, 1 !" M ##" *Y 7. 7 . ".E.M// Z E.T'*//
8. H" EUH ( E.M/ 9. M
10. EUH ( E.T'*/ 11. M"
12. !" M $I #1 !"" " " 7" E
13. 7 2 *.[M/ (
( *.M/" M" * 7 M3 2 M" *.M/ (( N.E.M//3 14. S# 6
15. !" M $I # 1 " 7" E 16. S# 6
17. S "N M 7 U
18. S# 5, " $" $ E " " " X 19. #I E 2X3 1 !#"" " * 20. #
2.7 PSEUDO CODE FOR EAIS 1. Let parameters be a1, a2, a3. 2. Let J be the population where J 3. optv= OFV(AIS) //
4. Let R be the number of Iteration 5. For I = 1 to J
6. Generate random set E = {x1, x2, x3} 7. End
8. For a = 1 to R 9. For b = 1 to J 10. For k = 1 to J step \ 11. Calculate OFV(E) 12. If ( OFV(E) <= optv ) 13. Optv = OFV(E) 14. End
15. Eliminate E <- max(OFV(E)
16. Optimization similarity of each NE, to generate a matured antibody of the P by inverse, pair wise optimizations
17. If ( strcmp(NE, E))
18. Eliminate string S from NE and Goto step 14
ISSN: www.jatit.org E-ISSN: 23. Display E, OFV (E) as the best sequence
and OFV.
3. NUMERICAL ILLUSTRATION
Three of the control variable [a1, a2, a3] is the parameters of priority importance used for the implementation of EAIS. Several UPFCs are inserted in series with the transmission lines. In this paper the three random numbers are generated while initializing the objective function which is optimizing the VP at subjected bus. The achieved results must be greater than the _, then only this is set as the inequality constraint. The
_ is computed by running the load flow program by implementing the EAIS procedure. Tests were performed at several loading conditions. The Extended AIS algorithm for
_#7 optimization is given in the Numerical Illustration given below.
Step 1: Set the voltage constraints, i. e. V
@ Voltage. Means the generated random
populations J
Satisfy all the inequality constraints. Step 2: generate the random numbers a1, a2 and a3
are considered
as parents and they are generated with respect to the following constraints:
X (
m n n n n
oxx xx xx
x x x
x x x
. . . .
x x xq
r r r r s
where: j
( Number of population Matrix size: 2 J x 33 Step
3: find for the constraints violations. If violated, go to step 2; otherwise go to the next step 4.
Step 3. Find for constraints violations. If violated, go to Step 2;
otherwise go to the next step 4.
Step 4. Fill in the population pool according to the required value.
Step 5. If the pool is not full, go back to step 2; otherwise go step 4.
Step 6. Determine the x_min and x_max. Step 7. Assign the x1, x2 and x3 in the system line data.
Step 8. Calculate fitness 1 by running the load flow program in order to evaluate the voltage values.
Step 9. Determine the voltage ౣ౮. ese
properties are required in the mutation process. Step 10. Clone the parents. This process copies all the populations
by multiple of 10. The size of matrix becomes 10 times of the original
row size, with the original number of columns.
2} 3 (
m n n n n n n n n n n n n n
o~ ~ ~
~ ~ ~ ~ ~ ~ : : : ~ ~ ~ ~ ~ ~ ~ ~ ~ : : : ~ ~ ~ ~ ~ ~ ~ ~ ~ : : : ~ ~ ~ ~ ~ ~
~ ~ ~ qr
r r r r r r r r r r r r s
Step 11. Mutate the parents. This will breed off springs. Where the off
springs are written in the mathematical equation.
2Γ3 =
m n n n n
o λ λ λ
λ λ λ
λ λ λ
. . . .
λ! λ! λ!
λ" λ" λ"q
r r r r s
Matrix size ( 2.jx10/ 33 Step 12. Recalculate fitness using the off
springs.
Step 13. Selection of offsprings. In this process, selection can be performed wise comparison.
Step 14. Define next generation to be the parents for next evolution Step 15. If solution converges, stop the process otherwise;
repeat step 10 to 14. Step 16. Stop the EAIS process.
ISSN: www.jatit.org E-ISSN:
#$%( R ; jX ---- [1]
&'(( R ; j.X %)*+,/--- [2]
Where
→ '#"! 7 H S → S"! 7 H % → S!"! 7 H
%)*+,
→ !#!I !"! 7 UV " H
4. SIMULATION PROCESS
To simulate the EAIS, an Evaluation Program is developed using Matlab environment which optimizes the computation which comes under Artificial Intelligence hierarchy. This approach proves to be a fast search technique which performs step by step calculation and fine tunes the results. This optimization approach is based on the mechanics of natural selection cloning, pair wise interoptimization competition and evaluation [20-22]. In general, the flowchart is shown in Figure-5. It is based on the survival of the fittest; which involves initialization, mutation, fitness computation and tournament selection prior to the prescription of the next iteration. The overall functionality of the evaluation program is given
Random Number Generation for
Population P
Fitness Calculation and Evaluation
Alteration
The initialization process generates a series of random number in uniformly distribution manner. The main purpose is maximizing the VP in the system. However, in this study the locations are selected arbitrarily due to the fact that, this implementation is looking towards the effectiveness of VP optimization. In this case, the locations of the UPFC are the same as those implemented in the EAIS.
The load bus voltage is taken as the fitness function, and the objective is to maximize the fitness function. .The ac load flow can be solved and the best solution is obtained by calling the load flow function into the evaluation program. Subsequently, evaluation of maximum, minimum, sum and average of fitness are carried out which will be utilized in the mutation process. The mutation is performed on the generated random numbers xi to produce the off-springs. The
mutation process was implemented based on the following equation:
~-./, ( ~-, ; ., /
( :~
/12 ~ /-<
-/12
Where:
~-./, 2 3
~3
¡ ¢
¢, Z £ Z 1
~ /12 ~
¤
~ /-
¤
- 45
/12 ~
In order to obtain better convergence, the scale £ is adjusted manually. The scale range of the £ is 0 to 1, which can also be considered as another parameter to be optimized. For cloning the mutation, 10 opponents were generated randomly for each combined populations. Opponents underwent tournament process with the combined populations via pair wise comparison and number of wins was calculated for every element in the combined population. These populations were sorted in descending order according to the number of wins. The first half population is then transcribed for the next generation. Comparing the two selection strategies; the priority selection provides better results and therefore it is employed in the selection process for the developed evaluation program.
Convergence test is important to determine the stopping criteria of the evolution. The pre- determined accuracy is normally dependent on the problem orientation. The convergence criterion is duly specified by the difference between the maximum and minimum
@ . ¥. the mathematical
equation is given as:
~6-4788 6-4788 @
. ¥equ no
ISSN: www.jatit.org E-ISSN:
Fig.5: Upfc Controller
A Unified Power Flow Controller (UPFC) is utilized to control the force stream in a 500 kv transmission framework. The UPFC placed at the left end of the 75-km line L2, between the 500 kv transports B1 and B2, is utilized to control the dynamic and responsive forces coursing through transport B2 while controlling voltage at transport B1. It comprises of two 100-MVA, three-level, 48-beat GTO-based converters, one joined in shunt at transport B1 and one associated in arrangement between transports B1 and B2. The shunt and arrangement converters can trade control through a DC transport. The arrangement converter can infuse a most extreme of 10% of ostensible line-to-ground voltage (28.87 kv) in arrangement with line L2.
5. RESULTS AND DISCUSSION
The simulation has been conducted by installing the UPFC in various locations of the transmission system and tests were performed at buses 9, 17, 24 and 30 at different loading conditions. The size of the population is also monitored and identified from the proposed theory, for which population the simulation obtained the optimal value.
ISSN: www.jatit.org E-ISSN:
Loading condition MVar
Voltage [p.u] UPFC values [p.u]
Without UPFC With UPFC X1 X2 X3
10 1.043 1.0442 0.4826 0.3529 0.2195
20 1.0291 1.0305 0.4357 0.3716 0.3869
30 1.0167 1.0223 0.4357 0.3716 0.3869
40 1 1.0058 0.4357 0.3716 0.3869
50 0.9913 0.9932 0.4357 0.3716 0.3869
60 0.9750 0.9878 0.4357 0.3716 0.3803
70 0.9611 0.9437 0.4902 0.2939 0.3593
80 0.9498 0.9387 0.3133 0.2669 0.3373
Table-1: At Bus 9- VP Optimization
From the above Table-1, the improved VP at Qd=60, 70 MVar is highlighted where the p.u value increased from 0.9750 to 0.9878 p.u. This is due to the fact that the installation of UPFC has modified the effective reactance of the transmission line which subsequently improved the VP in the system. The size of UPFCs
determined by the EAIS to achieve this increment is 0.4357, 0.3716 and 0.3869 p.u. respectively as indicated in the table. Suppose a power system operator attempts to do UPFCs installation at this loading condition, these values should be taken as the optimal values for the UPFCs sizing.
Fig-5: Results for VP at bus 9optimization with and without UPFC 0.84
0.86 0.88 0.9 0.92 0.94 0.96 0.98 1 1.02 1.04 1.06
1 2 3 4 5 6 7 8
VP
[p
.u
]
Loading Condition 10 to 80 [MVar] VP Improvement at Bus 9
Without UPFC
ISSN: www.jatit.org E-ISSN: Table-2: VP optimization at bus 17
Loading Condition(MVar)
Voltage(p.u) UPFC values(p.u)
Without UPFC With UPFC x1 x2 x3
10 1.0328 1.0348 0.4357 0.3716 0.3869
20 1.0156 1.0178 0.4357 0.3716 0.3869
30 0.9996 1.0021 0.4357 0.3716 0.3869
40 0.9806 0.9834 0.4357 0.3716 0.3869
50 0.9577 0.9632 0.4357 0.3716 0.3869
60 0.9272 0.9304 0.4357 0.3716 0.3869
70 0.9046 0.9083 0.3767 0.3077 0.3662
*80 [AIS] 0.8728 0.8769 0.3133 0.2669 0.3873
*80 [EAIS] 0.8512 0.8693 0.3089 0.2576 0.3783
The results for VP optimization when loading condition variation is subjected to bus 9 are illustrated in Figure-5. With UPFCs installed in the system, voltage at bus 9 had been increased accordingly. However, the increment is not obviously indicative because VP does not vary linearly with respect to the loading increment.
On the other hand, the results for VP optimization for bus 17 are tabulated in Table 2.
From the table, similar trend can be noticed. Voltage at bus17 increases as the reactive power loading at this bus is increased. Once UPFCs are installed in the system, VPs of the bus for all loading conditions have been improved significantly. These phenomena can be observed from the table.
Fig-6: Results for VP at bus 17 without UPFC and with UPFC
From the above table at Qd17 = 80 MVar, voltage is increased from 0.8728 p.u. to 0.8795p.u. as highlighted in the table. The size of UPFCs determined by the EAIS to achieve this increment is 0.3089, 0.2576 and 0.3783p.u respectively as indicated in the table. The results for VP optimization when loading condition variation is subjected to bus 17 are illustrated in Figure-6.
0 0.2 0.4 0.6 0.8 1 1.2
10 20 30 40 50 60 70 80
VP
[p
.u
]
Loading Condition MVar VP at bus 17 without UPFC and with UPFC.
Voltage(p.u) Without UPFC
ISSN: www.jatit.org E-ISSN: Table-3: VP optimization at bus 24
Loading Condition(MVar)
Voltage(p.u) UPFC values(p.u)
Without UPFC With UPFC x1 x2 x3
10 1.0149 1.0348 0.3069 0.1213 0.3059
20 0.9921 0.9964 0.3069 0.1213 0.3059
30 0.9703 0.9767 0.3069 0.1213 0.3059
40 0.9451 0.9622 0.4929 0.163 0.3941
50 0.9111 0.9383 0.3069 0.1213 0.3059
60 0.8748 0.9049 0.3069 0.1213 0.3059
70 0.8367 0.8738 0.3069 0.1213 0.3059
*80 [AIS] 0.7877 0.8551 0.4112 0.1592 0.3966
*80[EAIS] 0.8551 0.8711 0.4432 0.1673 0.4019
The outputs for VP optimization when loading condition variation is subjected to bus 24 are shown in Table-3. From the above table, it is observed that the voltage at bus 24 also increases when the reactive power loading is increased, as those observed in previous cases. For instance, at Qd24 = 80 MVar, the voltage is increased from
0.7877 p.u. to 0.8551 p.u. The size of UPFCs determined by the AIS to achieve this increment is 0.4432, 0.1673 and 0.4029p.u. The results for VP optimization when loading condition variation is subjected to bus 24 are illustrated in Figure-7.
Fig-7: Results for VP without UPFC and with UPFC at bus 24
It is observed that, the installation of UPFCs has significantly increased the VP at bus 24, particularly at higher loading condition region. However, at lower loading the difference is submissive. This indicates that any attempt to improve the VP at this bus, recommendation should be given for higher loading condition. Also the VP optimization obtained by AIS is
improved using EAIS by repeatedly applying the optimization steps described in this approach.
5.2 EAIS VS. AIS A COMPARATIVE STUDY
Comparative studies were conducted with respect to the results obtained using Evolutionary Programming. The results are tabulated in Tables 3 and 4 for loading 0
0.2 0.4 0.6 0.8 1 1.2
10 20 30 40 50 60 70 80
V
P
[
p
.u
]
Loading Condition [MVar] VP improvement at bus 24
Voltage(p.u) Without UPFC
ISSN: www.jatit.org E-ISSN: conditions subjected to buses 17and 24. From
both tables, it is observed that AIS are better than EP in terms of VP optimization in all loading conditions. This is suspected due to the fact that in EP, combination between parents and off-springs is done; while in AIS only cloning process is done with the exclusion of combination process. Combination process between both; the parents and off-springs will
cause inaccuracy due to the difference in population variables. On the other hand, in AIS; cloning process is introduced which can lead the system to converge to an accurate solution due to the fact that in AIS each individual is cloned into 10 identical populations. This has helped the optimization process to converge to an accurate solution.
Table-4: VP optimization at Bus 17 performed using AIS, EAIS and EP
VP [Mvar]
Voltage(p.u)
Without UPFC AIS EPAIS EAIS EPEAIS
30 0.9996 1.0021 1.0007 1.0003 0.9987
40 0.9806 0.9834 0.9819 0.9832 0.9827
50 0.9577 0.9632 0.9616 0.9654 0.9613
60 0.9272 0.9304 0.9287 0.9156 0.9102
70 0.9046 0.9083 0.9064 0.8945 0.8901
*80 [AIS] 0.8728 0.8769 0.8749 0.8543 0.8521
*80 [EAIS] 0.8728 0.8732 0.8689 0.8498 0.8493
In Table-4, at loading condition of 80 MVAR; AIS managed to improve the VP from 0.8728 p.u.to 0.8769 p.u. where the EAIS improve the VP from 0.8728 to 0.8732, while the Evaluation Program only managed to improve the VP to 0.8689 p.u.. This implies that the cloning process introduced in EAIS has enabled the solution to
search for better results over EP than the solution obtained from AIS. Looking at other loading conditions, results obtained using EAIS are higher than in EP indicating the capability of EAIS is maintained throughout the process and it also depicted in Figure-8.
Fig-8: Evaluation of EAIS comparing with AIS 0.75
0.8 0.85 0.9 0.95 1 1.05
1 2 3 4 5 6
O
b
ta
in
ed
p
.u
]
EAIS, EPEAIS VP comparison [MVar]
VP Improvement at bus 17 by EAIS and Evaluation Program result
EAIS
ISSN: www.jatit.org E-ISSN: Table-5: VP optimization at Bus 24 performed using AIS and EP
Loading condition(Mvar)
Voltage(p.u) Without
UPFC AIS EPAIS EAIS EPEAIS
10 1.0149 1.0348 1.0184 1.0348 1.0184
30 0.9703 0.9797 0.9799 0.9797 0.9799
50 0.9111 0.9383 0.9628 0.9383 0.9628
60 0.8748 0.9049 0.8974 0.9049 0.8974
70 0.8367 0.8738 0.8696 0.8738 0.8696
*80 0.7877 0.8551 0.855 0.8551 0.855
Similar scenario can be observed for the results of bus 24. In Table-5, at loading condition of 80 MVar; EAIS managed to improve the VP from 0.7877 p.u., to 0.8550 p.u., while EP only managed to improve the VP to 0.8550 p.u.. This implies that the cloning process introduced in
EAIS has able the solution to search the better results over EP. Looking at other loading conditions, most of the results performed using EAIS are higher than that in EP indicating the capability of EAIS is maintained throughout the process is also depicted in Figure-9.
Fig-9: Evaluation of EAIS comparing with AIS at Bus 24
5.3 PERFORMANCE
EVALUATION
To prove that the optimization of VP obtained by the EAIS is better than the AIS method,Matlab Simulink model was developed and experimented at different loading conditions
and comparative bar charts were plotted . All the values of p.u, without UPFC and the random population variables x1, x2, x3 are improved in such a manner that they provides the optimum solution to control the VP for UPFC.
0 0.2 0.4 0.6 0.8 1 1.2
1 2 3 4 5 6
o
b
ta
in
ed
p
.u
ISSN: www.jatit.org E-ISSN:
Fig-10: VP Optimization At Bus 9 EAIS Compared With AIS
Fig-11: VP Optimization At Bus 24 EAIS Compared With AIS
Fig-12: VP Optimization At Bus 17 0.866
0.868 0.87 0.872 0.874 0.876 0.878
without upfc with upfc
o
b
ta
in
ed
p
.u
AIS vs. EAIS
VP improvement at bus 9 EAIS compared with AIS
0.7 0.72 0.74 0.76 0.78 0.8 0.82 0.84 0.86 0.88
1 2
O
b
ta
in
ed
p
.u
AIS vs. EAIS
VP improvement at bus 24 EAIS compared with AIS
Series1
Series2
0.75 0.8 0.85 0.9 0.95 1 1.05
1 2 3 4 5 6
v
o
lt
a
g
e
p
.u
Loading condition 30 to 80 [MVar]
VP Improvement at bus 17 comparing EAIS vs AIS
AIS
EAIS
EPAIS
ISSN: www.jatit.org E-ISSN:
Fig-13: VP Optimization At Bus 24
7. CONCLUSION
A novel approach for VP optimization using UPFC via EAIS as the optimization technique is presented in this paper. The programming codes for EAIS technique were developed to determine the objective value for UPFC in order to maximize the VP in the transmission lines. The comparative results show that the EAIS based VP improve the objective value as compared from results obtained from AIS. Results obtained from the study indicate that the implementation of EAIS have improved the VP of the system proving to be evidently a feasible technique to perform the voltage optimization process. Comparative studies with the results obtained from EP indicated that EAIS is better than EP in terms of ability to produce the more accurate results.
8. LIMITATIONS OF THE STUDY
In this paper the UPFC controller is used as an optional FACTs system with 500 kV, 100 MVA. The pair wise controller can be operated in three modes. At the point when working in UPFC mode, the extent of the arrangement infused voltage is differed by fluctuating the Sigma conduction plot, thus producing higher symphonious substance than the shunt converter.
9. FUTURE WORK
Once optimized parameters are obtained for voltage profile optimization, the power, impedance and other factors is also considered for designing and implementing a best UPFC for current
industries. The optimal placement, optimized power control can be obtained by various Artificial Intelligence techniques. The UPFC model can be connected and verified using Energy Conversion Models.
REFERENCES:
[1]. Ismail Musirin, NurDianahMohd, “Voltage Profile Optimization Using Unified Power Flow Controller via Artificial Immune
System”, WSEAS TRANSACTIONS on
POWER SYSTEMS, ISSN: 1790-5060, Issue 4, Volume 3, April 2008
[2]. AlirezaFarhangfar, S. JavadSajjadi and SaeedAfsharnia, “Power Flow Control and LossMinimization with Unified Power Flow Controller(UPFC)”, Niagara Falls, May 2004. [3]. RaminJavadzadeh., Zahra Afsahi and
MohammadRezaMeybodi, “Improved
Artificial Immune System Algorithm with Local Search “,World Academy of Science, Engineering and Technology 59 2011
[4]. Jan Verveckken, Fernando Silva, Dionísio Barros, Johan Driesen, “Direct Power Control of Series Converter of Unified Power-Flow Controller With Three-Level Neutral Point Clamped Converter”, IEEE TRANSACTIONS ON POWER DELIVERY, VOL. 27, NO. 4, OCTOBER 2012
[5]. Mahdi GhazizadehAhsaee and JavadSadeh,” New Fault-Location Algorithm for Transmission Lines Including Unified Power-Flow Controller”, IEEE TRANSACTIONS ON POWER DELIVERY, VOL. 27, NO. 4, OCTOBER 2012.
0 0.2 0.4 0.6 0.8 1 1.2
1 2 3 4 5 6
o
b
ta
in
ed
p
.u
ISSN: www.jatit.org E-ISSN: [6]. J. Pourhossein, G. B. Gharehpetian, and S. H.
Fathi, “Unified Interphase Power Controller (UIPC) Modeling and Its Comparison With IPC and UPFC”, IEEE TRANSACTIONS ON POWER DELIVERY, VOL. 27, NO. 4, OCTOBER 2012
[7]. Z. Moravej, M. Pazoki, M. Khederzadeh, “Impact of UPFC on Power Swing Characteristic and Distance Relay Behavior”,
IEEE TRANSACTIONS ON POWER
DELIVERY, VOL. 29, NO. 1, FEBRUARY 2014
[8]. Mohamed E. A. Farrag, Ghanim A. Putrus, “Design of an Adaptive Neurofuzzy Inference Control System for the Unified Power-Flow Controller”, IEEE TRANSACTIONS ON POWER DELIVERY, VOL. 27, NO. 1, JANUARY 2012
[9]. SanguRavindra, V.C.Veera Reddy, S.Sivanagaraju, “Artificial Neural Networks based UPFC for Damping Low Frequency Oscillations”, International Journal of Computer Applications (0975 – 8887) Volume 53– No.7, September 2012
[10]. G. Siva Kumar, B. Kalyan Kumar, Mahesh K. Mishra, “Mitigation of Voltage Sags With Phase Jumps by UPQC With PSO-Based
ANFIS”, IEEE TRANSACTIONS ON
POWER DELIVERY, VOL. 26, NO. 4, OCTOBER 2011