Design and Implementation of FCS Based
Process Control System
Mahder Girmay G/micheal1*, Vajeravel Sampath Kumar2,B.Gomathy3
Lecturer, School of Electrical and Computer Engineering, Ethiopian Institute of Technology, Mekelle, Mekelle
University, Ethiopia1
Assistant Professor, School of Electrical and Computer Engineering, Ethiopian Institute of Technology, Mekelle
University, Ethiopia2
Associate Professor, Department of EEE, Paavai College of Engineering, Namakkal, Tamil Nadu, India3
ABSTRACT: To enhance the quality of production, monitoring and control of a process is a key task in industrial control system. With the increasing of social needs from time to time, the control process of industrial systems must match up with these needs. To achieve this, any control process run manually is needed to be replaced by faster, more reliable and better quality control system. Implementing a process control system based on fieldbus will provide great potential for the high level control of process plants. In This thesis, the significance of control system by fieldbus, the basic digital communications of fieldbus technology with different and most widely applicable fieldbus standards, the technology of fieldbus integration are described in detail. Design methods and procedures are proposed. Finally, a chosen case study focused on the PID control system for the liquid level in a tank together is presented. Experimental and simulation results have been discussed.
KEYWORDS: Process Control System; FCS; Fieldbus; PID; PLC
I. INTRODUCTION
FCS is an all-digital, serial, two-way communications system that interconnects distributed field devices (sensors, actuators, drives, transducers, etc.) in to a central control or management system. At the base level in the hierarchy of plant networks, FCS serves as a Local Area Network (LAN) for devices used in process control and manufacturing automation applications and has a built-in capability to distribute the control application across the network [1].
A fieldbus is constructed as a bus, which means that several devices share the same cable through digital communication; more than one variable can be measured in one device. These reductions in cable and number of instruments can reduce installation time and cost. Fieldbus devices can also be made more advanced, like a thermal camera, which measures several points [3]. The devices can also signal when they are about to break down or if there is something else wrong, for example a valve that can’t close. Since all devices share the same cable, it enables direct communication between the devices. This can be sued to move the control from the central system and put it out in the field. By doing this, important segments can work properly, even if process station stops or a cable breaks between the device and the process station. The data can also be shared to operators by connecting the host to an ordinary intranet (Ethernet) or even Internet [3], [5]. In this way the electrician does not have to be at the site to do for example diagnostics. Fieldbuses use a range of media such as copper cable, fiber optics or wireless, with a bit-serial transmission for coupling the distributed field devices [6].
II. OVERVIEW OF THE SYSTEM STRUCTURE
distributed local controllers and smart I/O devices are all connected through Profibus to the central controllers (PLCs), the data communication at this stage is digital and the wiring is highly minimized. At the top (Scada) level the central controllers are connected with each other and with the operator interface through Profinet bus which uses the Ethernet protocol for monitoring and controlling the whole system from a single location remotely.
Fig.1 Structure of the FCS Process Control System
III. DESIGN METHODOLOGY
The whole system design accomplished in two main sections:
Configuring hardware and PID programming with SIMATIC STEP 7 version 5.4 software.
Design the Graphical user interface of the system using SIMATIC WinCC version 6.2.
IV. LIQUID LEVEL CONTROL USING PID CONTROL SYSTEM
This case study focuses on the implementing FCS based process control system for monitoring and controlling the level of water in a tank using PID control system. The PID control system is the most common form of feedback control system and widely used in industrial control systems. It calculates an "error" value as the difference between a measured process variable and a desired setpoint.
In this experimental demonstration the PID control system is designed and implemented using the SIMATIC S7- 300 PLC hardware platform and the program is developed using the function block FB41 “CONT_C” in the STEP 7 programming software. The system also provides an HMI application to monitor and control the liquid level in the tank.
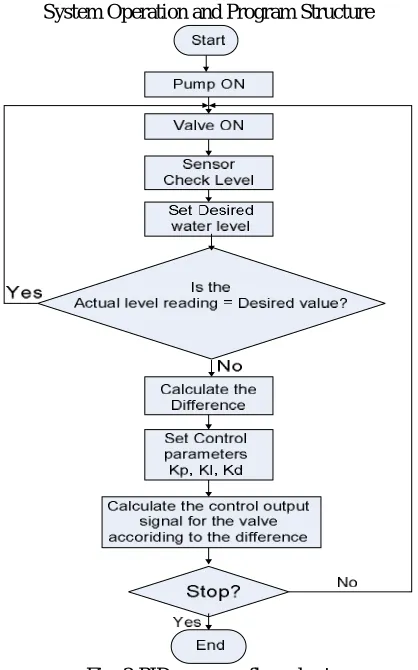
System Operation and Program Structure
Fig. 2 PID program flow chart
In Fig 3 shows, when the system starts working, the water level sensor reads continuosly the water level in the tank. This sensor output current is 4~20 mA, so it needs to be changed in to digital value for further processing by the PLC. This 4~20mA current signal will then be sent to the PLC analog module. The analog module has an A/D converter which converts the 4~20mA current signal in to analogous digital data format. The conversion process will be calculated using simple mathematics as follows:
A/D output data = 0 ~ 27648; 27648 = 20mA=100% - full range
Fig. 3 Relationship with the output of the A/D
The peripheral value of 0~ 27648 needs to be converted in to a floating value of 0~100%, which is the data range of the PID block input parameter “PV_IN”. The following mathematical equation converts the “PV_PER” value into “PV_IN” as follows:
(1)
Since the minim value starts from 5530 not from 0, the above formula becomes: (2)
Where PV_PER = process variable peripheral (actual measured value of the water level from the sensor)
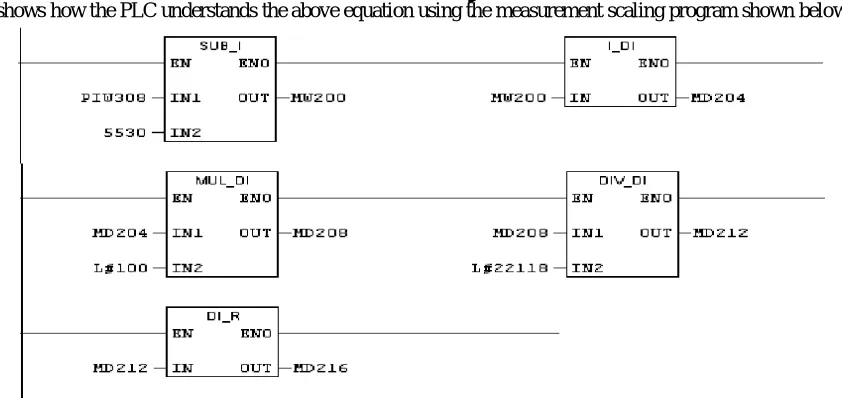
The program shown in the figure below converts the PV_PER peripheral value from the level sensor “PIW 308” to a floating-point format of 0 to 100 % (according to Equation 1 and 2). This is because the process variable in (PV_IN) can be input from -100 to +100 % ranges of values. The memory address (MD 216) of the output of this program is then given to the “PV_IN” input of the PID block.
5530~27648 0 ~100%
This is then sent to the valve directly. The actual range of the peripheral value of the valve is 829 ~ 4147. The value 829 is the minimum value of the output which fully closes the valve and the value 4147 is the maximum value of the output which fully opens the valve.
0 ~ 100% 829 ~ 4147
Actual valve output (LMN_PER) = 829~4147 0 ~100 829 ~ 4147
Where “x” is the range of ‘’LMN” from 0 ~ 100%
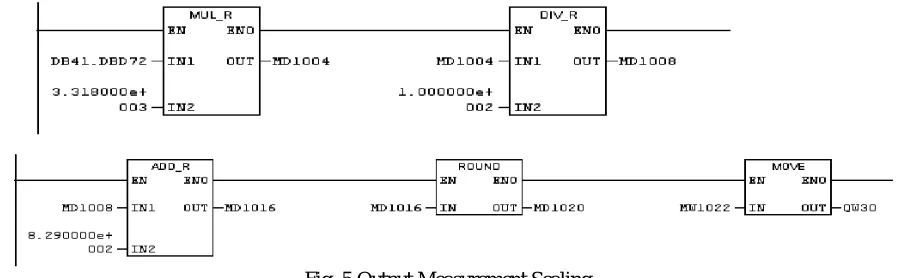
Then after the program finish the calculation, the output result in “Real” type must be converted into “word” data type in order to fit to the output address “QW 30”. To do this, it is necessary to use the converter block “Round” and the “Move” instruction.
Fig.5. shows how the PLC manipulates the control signals for the analog outputs according to the above conversion method.
Fig. 5 Output Measurement Scaling
V. EXPERIMENTAL RESULTS
When the water level is below the Setpoint, the output increases until the level reading of the sensor becomes the same as the desired value (Setpoint). And if the water level is above the Setpoint, the output decreases to compensate the difference. This process continues until the water level becomes the same as the desired value, at this time the output keeps constant as it was. In this experimental result, the output is meant that the output signal sent from the PID controller to the servo valve, and the measured variable is the actual level of the water in the tank.
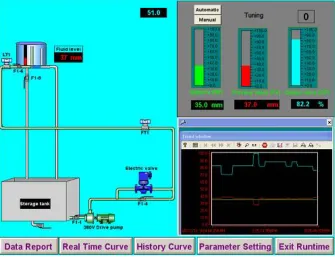
Fig. 6 Experimental Result of the PID Control system
Fig. 7 Single-Tank valve control PID control system
VI. CONCLUSION
VII.FUTURE WORK
To develop the present implemented work and to achieve a higher level of control system, it is recommended to implement the WinCC Web Navigator to this system. WinCC Web Navigator allows users to remotely monitor and operate devices through the Internet. This provides additional functionality to the designed control system, such as, remote diagnostics and monitoring the current status of the process control system through the web from any location.
ACKNOWLEDGEMENTS
Firstly, thanks to God for letting me to finish my final year project successfully. Secondly, I would like to thank my supervisors, Professor Lu sheng li and Associate Professor Hu Shan, for their priceless guidance and support that led me in the right direction. I would also like to thank to Chinese people in general for their generous hospitality and help during my study in China. I greatly thank to my family and friends for their kindness, support and encouragement.
REFERENCES
[1]. Alimujiang Yiming. Real- Time Communication for Distributed Control (Doctoral Thesis, Kitami Institute of Technology), pp 26-51,2005. [2]. Lars Persson. A Comparison between Fieldbuses and Remote I/O for Instruments in the Process Industry. Master’s Thesis, Lulea University of
Technology, Pp 5-22, pp 43-44, 2007.
[3]. Introduction to Fieldbus Systems. Available at: http://www.cs.pitt.edu/~mhanna/Master/Introduction.pdf [Accessed 20th November 2012]. [4]. Truong Chau and Nguyen Khai, ”WEB-BASED DATA MONITORING AND SUPERVISORY CONTROL”, Proceedings of the International
Symposium on Electrical & Electronics Engineering, Vietnam, pp. 7-13 ,2007.
[5]. Xiaofeng Lee 1, Jianfeng Hu1+,”Design and Research of Remote Monitoring System based on OPC XML-DA”, Proceedings of 2008 International Pre-Olympic Congress on computer science, V(1), China, pp:147-151, August 2008.
[6]. Siemens AG. PROFINET System Description. Industry Sector Postfach 48 48 0026 NÜRNBERG GERMANY, (2008).
[7]. Tran Duy Khanh. An open Implementation for Profibus DP. Diploma Thesis, Czech Technical University in Prague, pp 4- 12, 2009.
[8]. Siemens AG. SIMATIC Manual. Configuring Hardware and Communication Connections STEP-7, order number: 6ES7810 - 4CA08- 8BW0. Automation and Drives Postfach 4848 90437 NÜRNBERG GERMANY, (2003).
[9]. Siemens AG. SIMATIC WinCC System Description. GERMANY, (2008, 09).
[11]. PID Controller. Available at: http://en.wikipedia.org/wiki/PID_controller [Accessed 4th February 2011].
[12]. Siemens AG. (1996). Standard Software for S7-300 and S7-400 PID Control. Postfach 4848, D- 90327 Nürnberg, Germany. Available at: http://www.fer.hr/_download/repository/S7pidcob.pdf [Accessed 25th February 2011].
[13]. Abbas, Hosny and Mohamed, Ahmed “Efficient Web Based SCADA System” Master Thesis, http:// www. engr. uconn. edu /~ahmed/Thesis_Hosny.pdf, Mar. 2011.