der Ludwig-Maximilians-Universität München
Functional imaging of the
neural components of
Drosophila
motion detection
Submitted by
Matthew Maisak
Matthew Maisak: Functional Imaging of the Neural Compo-nents ofDrosophila motion detection,
Dissertation
der Graduate School of Systemic Neurosciences der Ludwig-Maximilians-Universität
München
website:
http://www.neuro.mpg.de/
e-mail:
iii
First reviewer (supervisor)
Prof. Dr. Alexander Borst
Second reviewer
Prof. Dr. Hans Straka
Date of submission
2017, June,27th
Date of defense
In order to safely move through the environment, visually-guided animals use several types of visual cues for orientation. Op-tic flow provides faithful information about ego-motion and can thus be used to maintain a straight course. Additionally, local motion cues or landmarks indicate potentially interesting targets or signal danger, triggering approach or avoidance, respectively. The visual system must reliably and quickly evaluate these cues and integrate this information in order to orchestrate behavior. The underlying neuronal computations for this remain largely inaccessible in higher organisms, such as in humans, but can be studied experimentally in more simple model species. The
fly Drosophila, for example, relies heavily on such visual cues
during its impressive flight maneuvers. Additionally, it is genet-ically and physiologgenet-ically accessible. Therefore, it is regarded as an ideal model organism for exploring neuronal computations underlying visual processing.
During my PhD-thesis, I characterized neurons presynaptic to direction selective lobula plate tangential cells by exploiting the genetic toolbox of the fruit fly in combination within-vivo imag-ing. The use of genetically encoded calcium indicators and two-photon microscopy allowed me to directly investigate response properties of small columnar neurons upstream of lobula plate wide field neurons. In the highly collaborative environment of our lab my imaging experiments were complemented by several other approaches, including electrophysiological and behavioral experiments, along with modeling which resulted in the publi-cations that comprise this cumulative dissertation.
Measuring calcium signals in T4 and T5 cells in the first study, established that both populations of neurons exhibit direction se-lective response properties. Furthermore, T4 cells only respond to moving bright edges, whereas T5 cells encode exclusively dark edge motion. Silencing the synaptic output of T4 and T5 separately, we were able to determine that both lobula plate tan-gential cell responses as well as the turning behavior of walking flies were impaired only to bright or dark edges, respectively. We thus proposed that the detection of the direction of visual motion must happen either presynaptic to, or on the dendrites of T4and T5 neurons, and that this computation takes place
v
dependently for brightness increments and decrements.
Visuell gesteuerte Tiere nutzen verschiedene visuelle Signale, um sicher in ihrer Umwelt zu bewegen. Der optische Fluss gibt Auf-schluss über Eigenbewegungen und kann daher zur Kurskon-trolle genutzt werden. Darüber hinaus lassen lokale Bewegungs-reize auf potentiell interessante Ziele schließen oder signalisie-ren Gefahr und provoziesignalisie-ren somit ein annäherndes bzw. vermei-dendes Verhalten. Das visuelle System muss diese Reize verläs-slich und schnell auswerten und integrieren, um Verhaltenswei-sen zu steuern. Zugrunde liegende neuronale Rechenleistungen sind in höheren Organismen, z.b. Menschen, nicht gut greifbar, sie können aber in experimentell besser zugänglichen Modell-organismen untersucht werden. Die Fliege Drosophila beispiels-weise baut in ihren beeindruckenden Flugmanövern in hohem Maße auf derartige visuelle Reize. Zudem ist sie genetisch und physiologisch gut zugäänglich. Sie wird daher als idealer Mo-dellorganismus für die Untersuchung neuronaler Rechenleistun-gen für visuelles Verhalten gesehen.
In meiner PhD Arbeit charakterisierte ich Neurone, die rich-tungsensitiven Lobulaplatten Tangentialzellen vorgeschaltet sind, unter Ausnutzung genetischer Werkzeuge in Kombination mit in vivo optischer Bildgebung. Mit genetisch kodierte Kalzimindi-katoren und 2-Photonenmikroskopie konnte ich direkt die Ant-worteigenschaften kleiner kolumnaerer Neurone untersuchen, die den Weitfeldneuronen der Lobulaplatte vorgeschaltet sind. In der hochkollaborativen Umgebung unseres Labors wurden mei-ne Bildgebungsexperimente durch Verhaltensexperimente und Modellierung ergänzt, was zu den in dieser kumulativen Disser-tation enthaltenen Publikationen führte.
In unserer ersten Veröffentlichung beschäftigten wir uns mit zwei Zelltypen, T4-Zellen, die Medulla und Lobula-Platte miteinan-der verbinden und T5-Zellen, welche Verzweigungen sowohl in der Lobula, als auch in der Lobula-Platte vorweisen. Durch das Messen von Kalzium Signalen konnten wir zeigen, dass sowohl T4-, als auch T5-Zellen spezifisch auf visuelle Bewegungsreize in eine bestimmte Richtung reagieren. Zusätzlich stellte sich her-aus, dass T4-Zellen ausschlieÃlich auf positive Helligkeitsun-terschiede (Licht an, ON) und T5-Zellen nur auf dunkle Rei-ze (Licht aus, OFF) antworteten. Somit wurde bestätigt, dass
vii
auch auf der Ebene der Lobula-Platten-Eingangsneuronen zwei getrennte Signalwege existieren. Indem wir diese bewegungs-sensitiven Elemente mit Hilfe genetischer Manipulationen aus dem Netzwerk entfernten und gleichzeitig entweder von nach-geschalteten Tangentialzellen ableiteten, oder das Laufverhalten von Fliegen beobachteten, gelang es uns zu beweisen, dass ei-nerseits T4-Zellen für die Wahrnehmung von ON-Signalen, an-dererseits T5-Zellen für die Berechnung von OFF-Signalen von elementarer Bedeutung sind.
1 introduction 1 1.1 Sensory systems 1 1.2 Visual systems 2
1.3 Motion vision and the Hassenstein-Reichardt De-tector 3
1.4 Tools in neuroscience 5 1.4.1 Physiology 6
1.4.2 Drosophilaneurogenetics 8
1.4.3 Mapping neural circuits 10
1.5 Structure and Physiology of the Visual System 15 1.5.1 Retina 15
1.5.2 Motion vision circuit 19 1.6 Concluding remarks 21
2 publications 23
2.1 A directional tuning map ofDrosophilaelementary motion detectors 23
2.2 Neural circuit components of the Drosophila OFF motion vision pathway 35
3 discussion 49
3.1 T4and T5Input 49
3.2 The Null Direction: Encoded in T4and T5? 53 3.3 The Behavioral Relevance of the T4T5Motion
Cir-cuit 53
3.3.1 Optomotor Response 54
3.3.2 Landing and Avoidance Response 54 3.3.3 Fixation Response 56
3.4 Comparing Motion Detection in Mice and
Droso-phila 57
3.4.1 The First Signs of Direction Selectivity 60
bibliography 63
index 81
1
I N T R O D U C T I O N
1.1
sensory systems
Successful interaction with our environment requires rapid and precise computations transforming the various sensory input from the outside world into a meaningful internal representa-tion.
Relevant changes must be reliably detected, processed and the appropriate actions must be initiated. Sensory organs distributed over the body constantly provide our brain with vital multi-modal information. These sensory receptors, triggered by ex-ternal stimuli, are the beginning of an electrochemical cascade of neuronal processing from the periphery to the central ner-vous system. Before we even actively perceive a sensation like a smell or a taste, the original signals have undergone impres-sive amounts of neural computation and filtering. In the case of vision, photons enter the eye and stimulate the photoreceptors in the retina. These in turn, stimulate the neural networks of the retina and the visual cortex. This leads to certain neurons or clusters of neurons to respond specifically to potentially complex features ranging from global motion patterns to the orientation, shape, or speed of an object.
Sensory systems are the most well studied parts of the brain in neurobiology for several reasons. One common feature shared by all sensory systems is relative experimental accessibility due to their localization at the periphery of the nervous system. The peripheral localization makes it comparatively easy to apply pcise artificial stimuli and thereby intentionally elicit neural re-sponses under controlled conditions in a laboratory. Further-more, even though the computational performance is very elab-orate, compared to networks in higher brain areas, like the cere-bral cortex, the anatomical complexity of sensory circuits is fairly moderate. Thus, it is not surprising that the field of sensory neu-robiology is a rather well studied discipline within neuroscience.
1.2
visual systems
The ability to see is one of the foundations of the human ex-perience and is thus of great interest to scientists around the world. Vision is, across many animal species including humans, the primary sensory modality for the execution of diverse behav-ioral tasks such as orientation in complex environments, social interactions, predator or rival avoidance and food source local-ization. Sensory receptors extracting visual information are gen-erally located in the eyes. The eye has evolved in several ways leading to an incredible diversity across the animal kingdom. Eyes can be classified in two groups; compound eyes, as found in crustaceans (e.g. shrimps, lobsters) and insects (e.g. flies, mosquitoes, beetles), and camera eyes that have evolved in par-allel in arachnids (e.g. spiders, scorpions, mites), cephalopods (e.g. squids, octopuses) and vertebrates (e.g. fish, birds, mam-mals) (Land and Nilsson,2012). One of the main challenges for visual systems is the projection of a3D world onto a2D array of photoreceptor cells. The neural networks in the mammalian eye accomplish this task through a highly complex parallel
organiza-Mammalian Eyes
tion. The first stage of visual processing takes place in the retina, where light that hits the photoreceptors triggers a biochemical re-action altering their membrane voltage, resulting in a change of transmitter release that can be detected by postsynaptic neurons. In the downstream networks, generally two motifs are found; a parallel, retinotopic arrangement starting with photoreceptor cells that diverge onto approximately ten types of bipolar cells. The bipolar cells ultimately connect to retinal ganglion cells that form the optical nerve linking the retina to higher brain areas. In addition to this parallel organization, lateral interactions are introduced at two stages: horizontal cells shape the responses of photoreceptor and bipolar cells, and amacrine cells act on bipo-lar cell - ganglion cell connection (for review, seeMasland,2001;
Gollisch and Meister, 2010). The ganglion cell signals are
sub-sequently conveyed to higher brain structures, where neuronal ensembles or sometimes single cells extract information about color, texture, or motion of an object (Hadjikhani et al., 1998;
Kastner et al., 2000; Hubel and Wiesel, 1968), or even highly
complex patterns like faces (Quian Quiroga et al., 2005). These neurons can then signal other neuronal networks to initiate ap-propriate behavioral actions.
in-1.3 motion vision and the hassenstein-reichardt detector 3
stance exhibit a number of interesting behaviors triggered by specific visual signals (Hassenstein, 1951; Reichardt and
Wenk-ing, 1969a; Borst, 1986; Bahl et al., 2013). Additionally, neural
networks underlying visual feature extraction can be assessed in intact, living animals with fixed eyes, enabling precise stim-ulus presentation. Moreover, morphologically and genetically identified cell types allow for the specific manipulation of cir-cuit elements.
1.3
motion vision and the
hassenstein-reichardt detector
It is clear that vision is an incredibly complex yet vital task for nearly all animals, including Drosophila. However, the ex-act mechanism of computation remained elusive. The neural pathways and computations that lie between the photoreceptor, which respond to motion in a non-direction selective manner and the behavioral output were a black box. However, motion vision in flies has been extensively studied by the application and elaboration of a mathematical model called Hassenstein-Reichardt detector. I will start with a brief summary of this model, in order to provide a context for the description of what is currently known about the circuitry that implements local mo-tion detecmo-tion.
The Hassenstein-Reichardt detector was originally developed based on studying the turning tendency of a beetle, Chlorophanus, which was tethered to a holder and walked on a spherical Y-maze made from straw. A periodic, moving pattern surrounded the beetle, and at each bifurcation of the maze it could turn left or right (Hassenstein and Reichardt, 1956). Bernard Has-sensteins and Werner Reichardts model for elementary motion detection describes the behavior of the beetle in a quantitative way and accounts for their observations in remarkable detail. In its simplest form, it consists of two mirror-symmetrical subunits. Each subunit (or half-detector) processes luminance changes at two adjacent points in space. These values are multiplied, after one of them has been delayed by a low-pass filter. The outputs of the two half-detectors are finally subtracted (Reichardt and
Wenking,1969b) (Figure1). A half detector generates a signal if
spacing between the two sampling points (the ’sampling base’) relative to the time delay introduced by the low pass filter just compensates the velocity of the object. The detector as a whole will give a positive output for its preferred and a negative output for its non-preferred direction after subtraction of the output of the two half-detectors.
Figure 1. Motion Detection Schematic. (a,b) Sequences of activation of two neighboring photoreceptors (left, blue; right, red) at a distance
∆x for light stimuli moving in the preferred direction (left to right) (a) and null direction (right to left) (b). (c) Schematic of the half-detector in the Hassenstein-Reichardt model. The signal from the left photore-ceptor (blue) is delayed by a temporal filter (τ) and fed, together with the instantaneous signal from the right photoreceptor (red), into an excitatory nonlinearity (NL, green). (d,e) Input (blue and red lines) and output (heavy green line) signals for motion in the preferred (d) and null (e) directions. A multiplication was used as the nonlinear operation. Figure and caption taken with permission from Borst and Helmstaedter(2015).
In principle, four different detector subtypes are conceivable. A luminance increment or ON-signal at one point in space could be correlated with either a luminance increment or decrement (OFF signal) at a neighboring point. The four possible combina-tions are thus ON-ON, OFF-OFF, ON-OFF, OFF-ON. However, experiments using apparent motion stimuli (i.e., consecutive lu-minance increments or decrements at separate points in space that convey the illusion of a continuously moving object) indi-cated that only two of the four possible channels exist, one relating luminance increments (ON-ON) and the other one cor-relating luminance decrements (OFF-OFF) (Riehle and
1.4 tools in neuroscience 5
biological standpoint since the movement of real objects will al-ways lead to correlated ON or OFF signals at neighboring points in space. Still, one may wonder why there are two separate de-tectors, doubling wiring costs, and why not one single detector could implement the sign rule of multiplication, with the sig-nal being positive when two positive as well as two negative brightness steps are correlated. However, it is hard to conceive how this could be implemented biophysically. Half-wave recti-fication of the input signal and splitting into an ON and OFF channel simplifies the problem considerably.
The Hassenstein-Reichardt detector model makes several predic-tions, which could be experimentally verified. Some of them even eluded its inventors, and have been studied much later (for review, see (Borst,2014b)). For example, fed with a moving sine wave grating, a Hassenstein-Reichardt motion detector produces an output that is not just linearly dependent on the pattern veloc-ity, like a simple speedometer. Instead, its output increases as a function of image angular velocity, up to a maximum after which the response declines again. This maximum increases linearly as a function of the pattern wavelength. The ratio of pattern wave-length and velocity, i.e., the temporal frequency of a pattern that elicits the maximal response, therefore remains constant. This dependency of the detector on the properties of the pattern has been confirmed experimentally by electrophysiological record-ings of large lobula plate neurons in both blowflies (Haag and Borst,2004) and fruit flies (Joesch et al.,2008;Schnell et al.,2010). Moreover, the Hassenstein-Reichardt model makes specific pre-dictions regarding the transient response to grating motion, and it exhibits gain control, a property that was not noticed until fairly recently (for review, seeBorst,2010). The close fit between these predictions and the behavioral and electrophysiological observations make it very likely that a Hassenstein-Reichardt-type algorithm underlies motion detection in flies. While the range of plausible model parameters could be confined experi-mentally, its actual neuronal and biophysical implementation is still largely uncovered.
1.4
tools in neuroscience
Drosophila as a model organism for genetics, behavior, learning and for studying neuronal networks in labs around the world. The use of Drosophila as a model system offers several distinct advantages. They are small, easy to breed, and have a short gen-eration time of approximately 10 days. In addition, they don’t raise the ethical concerns associated with common mammalian model organisms. Their brains are relatively small with 300,000 neurons with mostly genetically hard wired development ( Simp-son, 2009). Nevertheless, Drosophila displays various complex behaviors (Borst, 2013; Dickson, 2008). Over the past hundred years of Drosophila research a variety of tools have been devel-oped which have equipped researchers with a powerful armory to tackle the complex problems of circuit neuroscience.
1.4.1 Physiology
For a very long time, properties of nerves, brain regions and
Electrophysiology
single neurons have been investigated using electrophysiological recordings of membrane voltage (Hodgkin and Huxley,1952). In the blow flyCalliphoramany cell types were characterized using intracellular and extracellular recordings with sharp electrodes
(Hausen, 1976;Strausfeld and Lee, 1991). Recordings from two
or more cells simultaneously enabled the description of connec-tivity between cells or connections of neurons with downstream nerves (Haag and Borst, 2001; Haag et al., 2004; Kauer et al., 2015). While these approaches worked well for the large nerve cells in the blow fly, recordings with sharp electrodes proved to be difficult at the small scale of Drosophila neurons. The whole-cell patch-clamp approach (Sakmann and Neher, 1984) was bet-ter suited for this task. Here, a glass electrode with a very fine opening is brought into close vicinity of a neuron under appli-cation of a small positive pressure. Once the electrode touches the cell membrane, the pressure is released and minute negative pressure is applied. This causes the cell membrane to become sucked slightly into the opening of the pipette. A so called "giga-Ohm seal" is formed, where the seal between glass capillary and cell membrane strongly increases the electrical resistance. In the next step, a short pulse of negative pressure leads to the de-tachment of a small patch of membrane into the electrode. The resistance drops and the remaining cell membrane now forms a continuum with the recording electrode, allowing the precise measurement of intracellular voltage or current. This technique permitted electrophysiological experiments in some larger cells of the fruit fly’s brain (Wilson et al.,2004;Joesch et al.,2008). Most of the cells in the optic lobe of Drosophila are too small
1.4 tools in neuroscience 7
to record from electrophysiologically. I therefore used 2-photon imaging (Denk et al.,1990), which offers several advantages over other imaging techniques for in-vivo imaging. The key advan-tage is that excitation quadratically depends on light intensity, and light intensity decreases dramatically outside of the focused laser beam. Therefore, excitation occurs almost exclusively in the focal volume, and practically all collected photons originate from the focal volume, scattered or unscattered. This improves the signal to noise ratio, especially for highly scattering tissues or when imaging deeper in the tissue. As a consequence, the effec-tive spatial resolution of a2-photon microscope can be20x supe-rior to that of a confocal microscope, although roughly twice the excitation wavelength is used, and one would expect a spatial resolution of 2-photon imaging that is worse by about a factor of two compared to confocal imaging. However, this would only be true theoretically, for an infinitely small pinhole. In prac-tice, there is a trade-off in the size of the pinhole between the achieved spatial resolution and the amount of collected photons
(Zipfel et al., 2003). Furthermore, using longer wavelengths for
2-photon excitation provides several other advantages that can be even more important when imaging in vivo: (1) reduced aut-ofluorescence, which again improves the signal to noise ratio and reduces phototoxicity, (2) far less photobleaching of the flu-orescent dye outside of the focal volume, which is critical for long in-vivo experiments at different depths in the tissue, (3) no interference with the visual system, since the excitation wave-lengths used are outside of the absorption spectra of the flys photoreceptors, and (4) superior depth penetration (Zipfel et al.,
2003;Svoboda and Yasuda,2006).
Another technical innovation, namely the invention and improve- Connectomics
ment of electron microscopy, has had an enormous impact on neuroscience. Using electrons instead of photons to probe tis-sues allowed for pushing the resolution limit far beyond what was possible with optical microscopes (Knoll and Ruska, 1932;
Denk and Horstmann, 2004). This innovation promoted the
emergence of a new field of neuroscience: connectomics, where neural circuits are described based on dense reconstructions of brain areas (Kim et al.,2014;Takemura et al.,2013;Helmstaedter
et al., 2013). In recent years, electron-microscopic studies have
provided a new level of insight into the wiring of neuronal cir-cuits. However, information about the connectivity of neurons is by far not enough to understand even primitive neural cir-cuits. The whole neural system of the roundworm
Caenorhabdi-tis elegans with its302neurons was completely reconstructed30
how-ever, is still subject to investigation. It is therefore indispensable to also probe nervous systems functionally, thus the continued need for the functional imaging and electrophysiological experi-ments done in this thesis.
1.4.2 Drosophila neurogenetics
At the turn of the centuryDrosophilawas established as a model organism and scientists immediately got to work developing large numbers of mutant flies. In the beginning of Drosophila
research, scientists used x-rays and chemicals to manipulate its DNA (Muller, 1928; Alderson, 1965) and screened for behav-ioral phenotypes (Benzer,1967). However, these methods were not very controlled and resulted in random, unpredictable mu-tations. In order to gain insight into functional principles un-derlying neuronal circuits it is essential to study the building blocks of the circuitry, single neurons or cell types (for review
seeLuo et al.,2008). Random mutagenesis is unreliable and
un-specific in affecting functions of single cells or defined classes of neurons. The biggest leap towards more targeted circuit ma-nipulation came with the ability to specifically insert pieces of exogenous DNA into the fly’s germline. In a pioneering study,
Rubin and Spradling(1982) were able to stably insert a new gene
into the DNA of a fly. They used mutant flies lackingrosy, a gene determining wildtypeDrosophilaeye color. When they injected a vector that contained a transposable element (P-element) carry-ing the intact rosygene into Drosophilaembryos, they could res-cue the loss-of-function phenotype not only in the injected flies, but also in subsequent generations. This indicates a successful integration of the exogenous gene into the fly’s germ-line. While this revolutionary technique broke new ground it also had sev-eral major drawbacks. Since the integration of the P-element happens in random positions of the host DNA, it is possible that it is inserted into encoding areas of the fly’s genome which can cause malfunctions of important genes, that may result in off tar-get effects. Moreover the promoters that determine the expres-sion of the downstream genes can not be selected and therefore the cells in which the inserted gene will be expressed cannot be targeted. The biggest disadvantage of this method is that every effector protein has to be insertedde novointo the genome. In order to circumvent these issues scientists developed a new binary expression tool, Gal4-UAS, in the early1990s (Figure2a,
Gal4-UAS
Brand and Perrimon, 1993). The Gal4-UAS system combines
1.4 tools in neuroscience 9
factor Gal4, expressed under the control of an endogenous pro-moter, drives the expression of any protein of interest controlled by the upstream-activation-sequence (UAS). Hence, UAS deter-mines ’what’ – which effector – is expressed, and the driver Gal4 defines ’where’ this protein is supposed to be present. More re-cently, the efficiency in creating new fly strains has been consid-erably improved with the development of a new technique, the so-calledφC31integrase system, that allows for the site-specific insertion of transgenes in the fly genome. Here, an attB donor plasmid containing the transgene is injected into an embryo of a
Drosophilastrain containing an attP-site (Fish et al.,2007;Bischof
et al.,2007). This method helped to overcome the issues of
ran-dom insertion and variable expression level and has supported enormous projects screening for cell type specific Gal4lines that ultimately resulted in a database containing several thousand publicly available driver lines (Lindsley and Zimm,1992;Jenett
et al.,2012, see alsoBloomington stock collection). Being able to
search for distinct strains from a seemingly infinite pool of genet-ically modified flies created a whole new level of experimental accessibility. A second binary expression method, based on the bacterial DNA-binding protein-operator LexA-op and controlled by the expression of LexA works similarly (Lai and Lee, 2006). With complementary strategies that combine both systems one can target two cell populations independently with two different effectors.
The specificity of Gal4or LexA driver lines is in some instances Intersectional
strategies
only contain Gal4but not Gal80(Lee and Luo,1999;Suster et al., 2004). To profit from these novel transgenic techniques and the large amount of specific driver lines, a number of genetically en-coded proteins that specifically manipulate functional properties of neurons in which they are expressed have been engineered.
1.4.3 Mapping neural circuits
In order to characterize neuronal circuits, the functional prin-ciples of single elements in these networks need to be under-stood. The discovery and synthesis of the green fluorescent pro-tein (GFP, Figure2b,Shimomura et al.,1962;Chalfie et al.,1994;
Heim et al.,1994) enabled scientists to transgenetically label
sin-gle cells in vivowithout prior fixation and immunostaining. Us-ing the Gal4-UAS system one can visualize subclasses of neurons in the optic lobe of the fruit fly brain (Figure2b) and thus probe the specificity of driver lines.
Due to their small size, neurons in the brain of Drosophila are
Calcium indicators
1.4 tools in neuroscience 11
combination with two-photon microscopy (Reiff and Borst,2008;
Reiff et al.,2010).
Carefully measuring the response characteristics of neurons can teach us a lot about their physiological contribution to neural networks. However, being able to specifically manipulate their functional properties would dramatically increase the number of experiments and could enhance our understanding of whole circuits. For centuries, the importance of regions of the human brain could only be determined through functional impairments occurring in individuals with localized damage from surgery or accidents (e.g. Broca, 1888). Using pharmacology it has been possible to manipulate predetermined brain areas and some-times even identified subsets of neurons, with the disadvantage of limited temporal and spatial precision. Changing the mem-brane voltage of neurons with a recording electrode increases temporal accuracy, however, only to a spatially limited extent; i.e. only single or at the best a few cells can be targeted at the same time. Exploiting genetic techniques can overcome both of these issues, enabling the alteration of genetically defined sets of cells, if necessary with high temporal precision.
The genetic accessibility of many model systems has initiated Silencing neurons
vesicles with the presynaptic membrane is interrupted, prevent-ing, within a few seconds to minutes, synaptic release, and ul-timately silencing the neuron without changing its endogenous properties (Kitamoto, 2001). Lowering the temperature back to permissive levels releases the block effect. Interestingly, in
Droso-philait has been shown that by exposing flies expressingshibirets
to a persistent heat-shock for one hour at an elevated tempera-ture (37◦C), the effect becomes long-lasting and the output of the affected cells is suppressed for several hours (Joesch et al.,2010). While this experimental procedure increases the temporal extent of neuronal silencing, it does so at the cost of losing reversibility.
Figure 2. Genetic tools for manipulations inDrosophila. (a) The Gal4
-UAS system is used to target genetically engineered effectors (-UAS) to specific subsets of neurons (Gal4). (b) Transgenic expression of
the green fluorescent protein (GFP) enables the visualization of sin-gle neurons or cell-types in living animals. E.g. in the optic lobe of the fly brain. (c-f) Genetically encoded effectors. (c) Calcium indi-cators are used to visualize neuronal activity based on their calcium dynamics. (d) The temperature dependent neuronal silencer shibirets
prevents the fusion of synaptic vesicles with the presynaptic mem-brane and thereby interrupts synaptic communication. (e,f) Optoge-netic tools. Light can be used to activate neurons, through channel pro-teins (e, Channelrhodopsin) or inactivate them via chloride pumps (f, Halorhodopsin). 2b from the Borst lab collection. Figure and caption
taken and modified with permission fromBorst(2009b) andBroussard et al.(2014).
A second approach to probe the connectivity between neural
el-Activating neurons
pre-1.4 tools in neuroscience 13
cisely characterize their connection strength and direction. Due to size limitations, unfavorable location or for reasons of effi-ciency this method is often not feasible. Stimulating or sup-pressing neurons by other, less invasive and more widespread mechanisms was necessary to improve the circuit mapping. Us-ing temperature, neurons can not only be silenced but also ac-tivated. The transient receptor potential cation channel TrpA1
(Hamada et al., 2008; Pulver et al., 2009; Berni et al., 2010)
nat-urally occurs in wild-type flies and is thought to be implicated in temperature sensing (Hamada et al.,2008). Transgenically ex-pressing this channel in the membrane of neurons – for instance using the Gal4-UAS system – allows for temperature mediated excitation. Furthermore, transgenic activators can also be suscep-tible to chemicals. P2X2, a cation channel that is activated upon the binding of ATP is used to selectively stimulate genetically identified neurons by application of ATP (Lima and Miesenböck, 2005).
All the tools described above permit the alteration of functional Optogenetics
several seconds, allowing for the presentation of visual stimuli during optogenetic activation without interference of the excita-tion light with the visual system. Besides excitaexcita-tion, neurons can also be hyperpolarized. Using halorhodopsin (NpHR), a light activated chloride pump derived fromNatromonas pharaonis
(Fig-ure 2f,Schobert and Lanyi,1982;Zhang et al., 2007), allows for
the inhibition of neurons with light at high temporal resolution. Together, channelrhodopsin and halorhodopsin with their vari-ants provide a toolset for the minimal invasive interrogation of neural circuits in living animals. Generally, optogenetic experi-ments can be applied with two different goals in mind; first, con-nectivity between cells can be probed in a similar way to classic paired electrophysiolgical recordings. Activating for instance a subset of neurons expressing channelrhodopsin and measuring resulting changes calcium levels in a second cell type expressing a genetically encoded calcium indicator can provide insight into their connectivity (e.g. Guo et al.,2009;Chuhma et al.,2011). A second application can test the necessity or sufficiency of neural elements for certain behaviors or circuit functions (e.g. Gordon
and Scott,2009;Haikala et al.,2013).
In the 20th century, classical techniques like electrophysiology, neuroanatomy and pharmacology laid the foundation for mod-ern neuroscience. Deciphering the functional principles of neu-rons, the building blocks of the nervous system and the brain, describing coarse connections between brain regions, and synap-tic communication. Recently, an immense number of new tech-niques have entered the game, dramatically changing large parts of neuroscience. Enormous amounts of data are generated with high throughput, semi-automated image acquisition at modern electron microscopes (Kleinfeld et al., 2011;Helmstaedter et al.,
2013; Lichtman et al.,2014), transgenic engineering has opened
1.5 structure and physiology of the visual system 15
1.5
structure and physiology of the
vi-sual system
Drosophila’scentral nervous system can be divided into two
ma-jor parts, the head and the thoracic ganglion. The thoracic gan-glion is dedicated to motor control while the head gangan-glion is involved in sensory processing. The head ganglion or brain is further divided into three parts: the central brain and two optic lobes. The optic lobes process visual information and then pass it to the central brain and the thoracic ganglion thus controlling visually guided behaviors.
The visual system of the fly brain is called the ’optic lobe’ con-sisting of 60,000(Hofbauer and Campos-Ortega, 1990)neurons and is divided into several structures: the retina, the lamina, the medulla and the lobula complex, comprised of the lobula and lobula plate (Figure4a). In1915,Cajal and Sánchez(1915), used Golgi-stainings to describe the various cell types in the fly optic lobe. Later a complete catalog of the various cell types in the fly’s optic lobe was provided (Fischbach and Dittrich,1989).
1.5.1 Retina
Drosophila’s compound eye is made up of 750hexagonal
omma-tidia which compose an evenly spaced mosaic with an interrom-matidial angle of 5degrees (Land,1997). Amazingly, it samples nearly the entire visual hemisphere excluding only an area of approximately20degrees in the back of the fly (Buchner,1976).
Each ommatidium in the eye contains eight unfused rhabdomeres, Photoreceptors
R1-R8. R1-R6are arranged in a hexagonal structure underneath the lens of each facet, while R7 and R8 are stacked on top of each other in the center of the hexagon. Central photoreceptors exist in two subtypes depending on the expression of one of two different light sensitive rhodopsins (Rh), pale (35%) and yellow
(65%) (Franceschini et al.,1981). In pale ommatidia, R7cells
con-tain the UV-absorbing pigment Rhodopsin-3 (Rh3) and R8 cells contain a blue sensitive pigment Rhodopsin-5(Rh5). In yellow-type ommatidia,photoreceptors R7 contain another type of UV-absorbing pogment, Rhodopsin-4 (Rh4) and photoreceptors R8 contain the green sensitive Rhodopsin-6(Rh6). Both ommatidial subtypes are distributed stochastically across the retina. R7and R8 are mainly involved in color discrimination (Schnaitmann
et al., 2013), while R1-R6 are responsible for encoding spatial
information crucial to motion vision.
packed structure of microvilli where light is converted into an electrical signal by an intricate biochemical cascade (Hardie and
Raghu,2001). Upon illumination, rhodopsin is photoisomerized
into metarhodopsin. This leads to the dissociation of the alpha subunit from the heterotrimeric G-protein. Next phospholipase C (PLC) hydrolyzes PIP2
to produce DAG and InsP3
resulting in an activation of cation permeable channels and depolarization of the photoreceptor (Fig.3). Phototransduction in flies is extremely fast; after a short light pulse depolarization is already detectable after a few milliseconds and quickly decays back to resting levels
(Hardie,1991), which accounts for the amazing temporal flicker
resolution of the fly eye at values larger than 200Hz (Autrum, 1950). All photoreceptors use histamine as a neurotransmitter and hence provide an inhibitory signal to their postsynaptic tar-gets (Hardie,1989).
The photoreceptors within an ommatidium are spatially
sepa-Neural
Superposition rated and point in different directions. Therefore, a simple
con-vergence of their outputs onto the following lamina cartridge would result in drastically decreased spatial acuity. Nature has solved this problem by using the principle of neuronal super-position, which maintains resolution and increases sensitivity at the same time (Braitenberg, 1967). Photoreceptors R1-R6 from within one ommatidium project into distinct neighboring car-tridges of the lamina such that the photoreceptors with the same optical axis project to the same lamina cartridge. The func-tional unit for processing light, therefore, is not the ommatid-ium but rather the lamina cartridge, also known as the neuro-ommatidium. R7 and R8, on the other hand, project directly through the next cartridge of the lamina and synapse onto medulla neurons. However, both R7and R8form gap junctions with R6 within the same cartridge at the level of the lamina (Shaw,1989;
Wardill et al.,2012)
Lamina
1.5 structure and physiology of the visual system 17
Figure 3. DrosophilaRetina. (a) Schematic overview of an ommatidium (from (Wernet et al.,2015)). (b) Illustration of the phototransduction
cascade (modified from (Hardie and Raghu, 2001)). (c) Schematic of
the organization of a neural superposition eye. Figure and caption taken and modified with permission fromBorst(2009a).
forms reciprocal connections with L2 and only shares a small number of synapses with R6 (Rivera-Alba et al., 2011). L5 has been shown to receive input from L2, L4 and several lamina in-terneurons such as an amacrine cell. Additionally, the lamina houses centrifugal, wide-field, and tangential neurons: C2, C3, T1, Lai, Lat, Lawf1(Fischbach and Dittrich,1989). All five classes of lamina monopolar cells send axonal arbors into distal layers of the subsequent processing stage, the medulla. The other lam-ina cell types have their axons in the lamlam-ina with their dendrites either in the medulla or in the lamina itself.
Medulla
The second and largest neuropil involved in early visual pro- Cell Types
cessing is the medulla. The medulla is extremely dense with 60 columnar neuron types forming a neural network of 40,000 neurons (Hofbauer and Campos-Ortega, 1990). The medulla is divided into ten layers (M1-M10) where lamina neurons synapse onto medulla neurons. Nearly all of the medulla neurons re-ceive their input here and are grouped according to their shape and projections patterns. Broadly, there are two main classes of columnar interneurons: about10types of medulla intrinsic (Mi) cells and almost 30 subclasses of transmedullary (Tm) neurons
(Fischbach and Dittrich, 1989). Mi cells have their dendrites in
1-5 and project onto neurons in the lobula. On the other hand trans medulla Y-cells bifurcate and synapse onto cells in both the lobula and the lobula plate. In addition to these two types of neurons, TmY cells, connecting medulla, lobula and lobula plate as well as numerous types of amacrine and wide-field neurons have been described. Another group of cells is formed by the bushy T-cells (T2, T3, T4,T5) which target different layers of the lobula (T2, T3) and the lobula plate (T4, T5). T2-T4 neurons re-ceive input from within the medulla but T5 get input from the lobula. Both T4 and T5 are further divided in to subtypes a-d based on which layer of the lobula plate they project to (
Bausen-wein and Fischbach,1992).
This jungle of interconnected nerve cells has proven very hard
Connectivity
to disentangle. Nevertheless, recent advances in electron mi-croscopy have lead to the creation of detailed connectivity maps, which revealed clusters of connectivity within the medulla net-work (Shinomiya et al.,2014;Takemura et al.,2011). Three main clusters were found: one between L1, Mi1, Tm3, and T4, another between L2, L4, Tm1, Tm2, Tm4, and T5 cells and finally be-tween L3, R7, R8, Tm9, and T5 neurons. It has been established in this work and others that the T4 and T5 clusters correspond to the ON and OFF motion pathways, respectively. It is thought that the Tm9path is involved in color vision.
Lobula complex
The lobula complex, the final stage of neural processing in the optic lobes, is where large-field neurons integrate columnar in-put from the from the medulla. The lobula complex consists of two neuropils, the lobula and the lobula plate.
The lobula plate is the most well studied neuropil in the fly brain
Lobula plate
(Hausen, 1976; Hengstenberg et al.,1982;Haag and Borst, 1998,
2004). Relatively easy access and the large size of the lobula plate tangential cells allowed for a thorough investigation of the lobula plate network (for review, see (Borst and Haag, 2002)). Perpendicular to its columnar organization, the lobula plate is comprised of four structurally distinct layers. Each layer con-tains a number of wide-field tangential cells with their charac-teristic dendritic trees spanning much of the lobula plate. They respond to motion in their preferred direction with a depolariza-tion and to modepolariza-tion in the opposite direcdepolariza-tion, the null direcdepolariza-tion, by hyperpolarization. They are tuned to different directions of motions and form groups of vertical system cells and horizontal system cells.
In contrast to the lobula plate, the second part of the third
1.5 structure and physiology of the visual system 19
ropil, the lobula is significantly less well studied on a functional level. In general it is comprised of both small columnar neurons as well as large field cells (Fischbach and Dittrich, 1989) that receive their major input through Tm and TmY cells from the medulla. The lobula constitutes an interesting morphological difference between the two input lines to the lobula plate. While T4cells connect the medulla directly to the four layers of the lob-ula plate, the second parallel stream takes a detour to the loblob-ula, where T5cell dendrites reside. While this anatomical peculiarity has been known for a long time, its functional significance is to date unkown.
1.5.2 Motion vision circuit
Lobula plate tangential cells are thought to be involved in the ini-tiation of turning behaviors (e.g. Heisenberg et al., 1978). Even though morphologically well described, physiological studies in
Drosophilaremained challenging due to its small size.
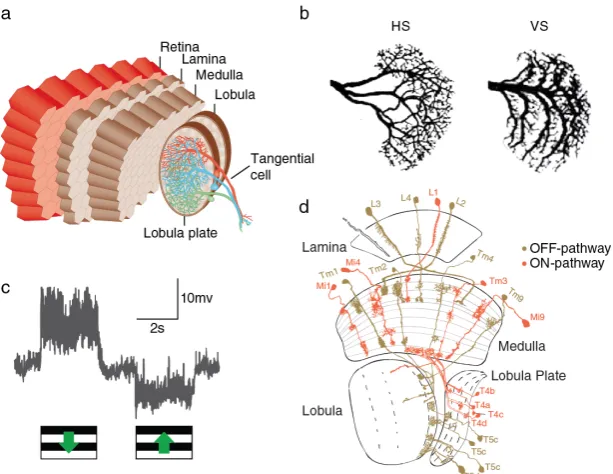
Deoxyglu-cose mapping revealed a functional organization which was pre-viously described in their bigger relatives, showing that the four layers of the lobula plate were active during visual stimulation in the four cardinal directions, respectively (Buchner et al.,1984). Only much later it became possible inDrosophila to record from tangential cells. Here, two major groups of lobula plate tangen-tial cells have been described; cells of the horizontal system (HS) that respond preferentially to visual stimuli with horizontal ori-entations (Schnell et al.,2010), and vertical system (VS) cells that detect vertical motion (Joesch et al., 2008). Both classes of neu-rons are fully opponent (Figure4c), i.e. they respond to motion in their preferred direction (PD) with an increase in membrane potential and hyperpolarize when stimulated in the opposite, their anti preferred or null direction (ND). The three HS cells reside in the first layer of the lobula plate and prefer front-to-back motion, while the number of VS cells, that have their den-dritic arbors in the fourth layer and are excited by downward motion, has not been finally determined. Unlike in bigger flies
like Calliphora, where tangential cells in layers 2 and3tuned to
opposite directions are well characterized (Hausen, 1976;Wertz
et al., 2008), descriptions of these neurons are missing in fruit
and Fischbach, 1992). Blocking the synaptic output of both cell types simultaneously rendered lobula plate tangential cells en-tirely motion insensitive (Schnell et al.,2010). Hence, these two classes of neurons are part of the circuitry responsible for the direction-selective properties of lobula plate tangential cells. In-vestigating their roles and contributions is part of the content of this dissertation.
Figure 4. The Fly Visual System (a) Schematic overview of the nervous system of the fruit fly Drosophila melanogaster. (a) Illustration of the optic lobe of a fly. (b) Lobula plate tangential cells of the horizontal (HS) and vertical (VS) system. (c) Electrophysiological recordings from a direction-selective vertical system tangential cell. VS cells depolarize to downward motion (PD) and hyperpolarize to visual stimulation in the opposite direction (ND). (d) Horizontal section through the visual system ofDrosophila. Presumed OFF pathway elements are depicted in brown, ON pathway candidates in red. Figure and caption taken and modified with permission from Rajashekhar and Shamprasad (2004)
and Borst (2014a) andFischbach and Dittrich (1989) andJoesch et al.
(2008).
in-1.6 concluding remarks 21
tact. The exact opposite effect was found when genetically silenc-ing L2cells, tangential cells still depolarized when stimulated in their preferred direction with bright edges, but exhibited no re-sponse to OFF edges. In a morphological study, Bausenwein
and Fischbach (1992) hypothesized that L1 could be connected
to T4 via Mi1 cells, while L2 contact T5 via Tm1. In the L2 pathway, Tm1and Tm2cells have been shown later by electron microscopy to receive synaptic input from L2 (Takemura et al., 2011). Furthermore an asymmetric connection between L2, L4 and Tm2 cells in the outer medulla could be identified. Tm2 receives input from L2 in its home-column, while L4 connects to two "walking-legs", dendritic proliferations extending posteri-orly into neighboring columns. This morphological feature sug-gested a distinct, potentially directionality-specific role of the L4-Tm2 connection (Takemura et al., 2011). Subsequent inves-tigations revealed two more cell types that are likely to be in-volved in the computation of moving dark-edges; Tm4and Tm9
(Shinomiya et al., 2014). Other than Tm1, Tm2 and Tm4, Tm9
cells are not postsynaptic to L2 or L4, but receive the majority of their input from L3cells. For the ON-selective pathway, Mi1 and Tm3have been proposed to to play major roles due to their synaptic connectivity to L1and T4(Takemura et al.,2013). Later, Mi4 and Mi9 cells have been added to the potential candidates for the ON pathway of motion vision (Figure4d, see alsoJanelia
EM reconstructions). However, without functional studies, the implication in motion detection remains hypothetical.
1.6
concluding remarks
2
P U B L I C A T I O N S
2.1
a directional tuning map of
droso-phila
elementary motion detectors
This paper (Maisak et al.,2013) describes response properties of T4and T5cells and characterizes their role inDrosophila motion vision. It was published inNaturein August2013.
Bushy T4cells connect the medulla to the four layers of the lob- Summary ula plate, while T5 cells provide input from the lobula.
Mea-suring changes in calcium levels in response to moving gratings revealed that each subtype of T4and T5cells is tuned selectively to one of four cardinal directions (down, up, left, and right). Moreover, polarity specific stimulation provided evidence that T4cells are activated only by moving brightness increments (ON edges), whereas T5 cells are susceptible for brightness decre-ments (OFF edges). Blocking the synaptic output of T4 and T5 cells separately, specifically rendered downstream lobula plate tangential cells insensitive for moving bright and dark edges, respectively. Similar phenotypes could be observed when mon-itoring the turning behavior of T4and T5 block flies presented with moving ON and OFF edges. From these experiments we concluded that T4and T5cells are motion detectors that process visual information from two parallel pathways.
The following authors contributed to this work:
Matthew S. Maisak, Jürgen Haag, Georg Ammer, Etienne Serbe,
Matthias Meier, Aljoscha Leonhardt, Tabea Schilling, Armin Bahl, Gerald M. Rubin, Aljoscha Nern, Barry J. Dickson, Dierk F. Reiff, Elisabeth Hopp, and Alexander Borst
Matthew S. Maisak and Jürgen Haag jointly performed and, Author contribution
together with Alexander Borst, evaluated all calcium imaging experiments. Georg Ammer, Etienne Serbe and Matthias Meier recorded from tangential cells. Aljoscha Leonhardt, Tabea Schilling and Armin Bahl performed the behavioral experiments. Gerald Rubin, Berry J. Dickson and Aljoscha Nern generated the driver lines and characterized their expression pattern. Dierk F. Reiff performed preliminary imaging experiments. Elisabeth Hopp
helped with programming and developed the PMT shielding for the two-photon microscope. Alexander Borst designed the study and wrote the manuscript with the help of all authors.
This article was highlighted in a number of journals (Flight,2013;
LETTER
doi:10.1038/nature12320A directional tuning map of
Drosophila
elementary
motion detectors
Matthew S. Maisak1*, Juergen Haag1*, Georg Ammer1, Etienne Serbe1, Matthias Meier1, Aljoscha Leonhardt1, Tabea Schilling1, Armin Bahl1, Gerald M. Rubin2, Aljoscha Nern2, Barry J. Dickson3, Dierk F. Reiff1{, Elisabeth Hopp1& Alexander Borst1
The extraction of directional motion information from changing retinal images is one of the earliest and most important processing steps in any visual system. In the fly optic lobe, two parallel process-ing streams have been anatomically described, leadprocess-ing from two first-order interneurons, L1 and L2, via T4 and T5 cells onto large, wide-field motion-sensitive interneurons of the lobula plate1.
There-fore, T4 and T5 cells are thought to have a pivotal role in motion processing; however, owing to their small size, it is difficult to obtain electrical recordings of T4 and T5 cells, leaving their visual response properties largely unknown. We circumvent this problem by means of optical recording from these cells inDrosophila, using the genetically encoded calcium indicator GCaMP5 (ref. 2). Here we find that specific subpopulations of T4 and T5 cells are directionally tuned to one of the four cardinal directions; that is, front-to-back, back-to-front, upwards and downwards. Depending on their pre-ferred direction, T4 and T5 cells terminate in specific sublayers of the lobula plate. T4 and T5 functionally segregate with respect to contrast polarity: whereas T4 cells selectively respond to moving brightness increments (ON edges), T5 cells only respond to moving brightness decrements (OFF edges). When the output from T4 or T5 cells is blocked, the responses of postsynaptic lobula plate neurons to moving ON (T4 block) or OFF edges (T5 block) are selectively compromised. The same effects are seen in turning res-ponses of tethered walking flies. Thus, starting with L1 and L2, the visual input is split into separate ON and OFF pathways, and motion along all four cardinal directions is computed separately within each pathway. The output of these eight different motion detectors is then sorted such that ON (T4) and OFF (T5) motion detectors with the same directional tuning converge in the same layer of the lobula plate, jointly providing the input to downstream circuits and motion-driven behaviours.
Most of the neurons in the fly brain are dedicated to image processing. The respective part of the head ganglion, called the optic lobe, consists of several layers of neuropile called lamina, medulla, lobula and lobula plate, all built from repetitive columns arranged in a retinotopic way (Fig. 1a). Each column houses a set of identified neurons that, on the basis of Golgi
staining, have been described anatomically in great detail3–5. Owing to
their small size, however, most of these columnar neurons have never been recorded from electrophysiologically. Therefore, their specific func-tional role in visual processing is still largely unknown. This fact is con-trasted by rather detailed functional models about visual processing inferred from behavioural studies and recordings from the large, electro-physiologically accessible output neurons of the fly lobula plate (tangen-tial cells). As the most prominent example of such models, the Reichardt detector derives directional motion information from primary sensory signals by multiplying the output from adjacent photoreceptors after
asymmetric temporal filtering6. This model makes a number of rather
counter-intuitive predictions all of which have been confirmed experi-mentally (for review, see ref. 7). Yet, the neurons corresponding to most
*These authors contributed equally to this work.
1Max Planck Institute of Neurobiology, 82152 Martinsried, Germany.2Janelia Farm Research Campus, Ashburn, Virginia 20147, USA.3Institute of Molecular Pathology, 1030 Vienna, Austria.{Present
address: Institute Biology 1, Albert-Ludwigs University, 79085 Freiburg, Germany.
T5 T4 Δ F/F Max Min a b c d e
Lobula Lobula plate
f
Lobula Lobula
Lobula plate Medulla Lamina Retina
Medulla Medulla Lobula Lobula plate Inner chiasm Layers
1 2 3 4
Proximal Distal T4 T4 T4 T5 T5 T5 Distal Distal Proximal Proximal Distal Proximal Lobula Lobula plate plate Lobula plate
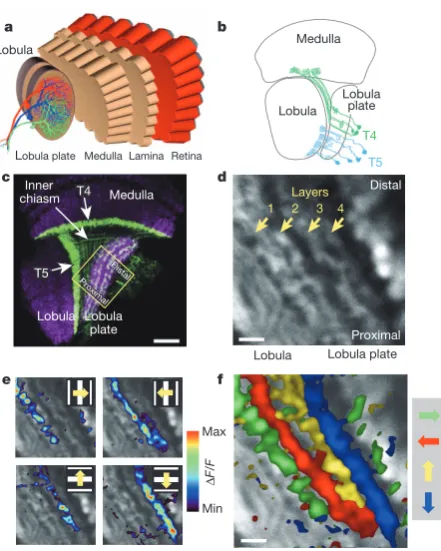
Figure 1|Directional tuning and layer-specific projection of T4 and T5 cells. a, Schematic diagram of the fly optic lobe. In the lobula plate, motion-sensitive tangential cells extend their large dendrites over many hundreds of columns. Shown are the reconstructions of the three cells of the horizontal system22.b, Anatomy of T4 and T5 cells, as drawn from Golgi-impregnated
material (from ref. 5).c, Confocal image of the Gal4-driver line R42F06, shown in a horizontal cross-section (from ref. 10). Neurons are marked in green (Kir2.1–EGFP labelled), whereas the neuropile is stained in purple by an antibody against the postsynaptic protein Dlg. Scale bar, 20mm.d, Two-photon image of the lobula plate of a fly expressing GCaMP5 under the control of the same driver line R42F06. Scale bar, 5mm. The size and orientation of the image approximately corresponds to the yellow square inc.e, Relative fluorescence changes (DF/F) obtained during 4-s grating motion along the four cardinal directions, overlaid on the greyscale image. Each motion direction leads to activity in a different layer. Minimum and maximumDF/Fvalues were 0.3 and 1.0 (horizontal motion), and 0.15 and 0.6 (vertical motion).f, Compound representation of the results obtained from the same set of experiments. Scale bar, 5mm. Results ineandfrepresent the data obtained from a single fly averaged over four stimulus repetitions. Similar results were obtained from six other flies.
2 1 2 | N A T U R E | V O L 5 0 0 | 8 A U G U S T 2 0 1 3
Macmillan Publishers Limited. All rights reserved ©2013
of the circuit elements of the Reichardt detector have not been iden-tified so far. Here, we focus on a set of neurons called T4 and T5 cells (Fig. 1b) which, on the basis of circumstantial evidence, have long been
speculated to be involved in motion detection1,8–10. However, it is
unclear to what extent T4 and T5 cells are directionally selective or whether direction selectivity is computed or enhanced within the den-drites of the tangential cells. Another important question concerns the functional separation between T4 and T5 cells; that is, whether they carry equivalent signals, maybe one being excitatory and the other inhibitory on the tangential cells, or whether they segregate into
directional- and non-directional pathways11or into separate
ON-and OFF-motion channels12,13.
To answer these questions, we combined Gal4-driver lines specific
for T4 and T5 cells14with GCaMP5 (ref. 2) and optically recorded the
visual response properties using two-photon fluorescence microscopy15.
In a first series of experiments, we used a driver line labelling both T4 and T5 cells. A confocal image (Fig. 1c, modified from ref. 10) revealed clear labelling (in green) in the medulla (T4 cell dendrites), in the lobula (T5 cell dendrites), as well as in four distinct layers of the lobula plate, representing the terminal arborizations of the four subpopula-tions of both T4 and T5 cells. These four layers of the lobula plate can also be seen in the two-photon microscope when the calcium indicator GCaMP5 is expressed (Fig. 1d). After stimulation of the fly with grating motion along four cardinal directions (front-to-back, back-to-front, upwards and downwards), activity is confined to mostly one of the four layers, depending on the direction in which the grating is moving (Fig. 1e). The outcome of all four stimulus conditions can be combined into a single image by assigning a particular colour to each pixel depend-ing on the stimulus direction to which it responded most strongly (Fig. 1f). From these experiments it is clear that the four subpopulations of T4 and T5 cells produce selective calcium signals depending on the
stimulus direction, in agreement with previous deoxyglucose labelling8.
Sudden changes of the overall luminance evokes no responses in any of
the layers (field flicker;n54 experiments, data not shown). However,
gratings flickering in counter-phase lead to layer-specific responses, depending on the orientation of the grating (Supplementary Fig. 1).
The retinotopic arrangement of this input to the lobula plate is demonstrated by experiments where a dark edge was moved within a small area of the visual field only. Depending on the position of this area, activity of T4 and T5 cells is confined to different positions within the lobula plate (Fig. 2a). Consequently, when moving a bright vertical edge horizontally from back to front, activity of T4 and T5 cells is elicited sequentially in layer 2 of the lobula plate (Fig. 2b). These two experiments also demonstrate that T4 and T5 cells indeed signal motion locally. We next investigated the question of where direction selectivity of T4 and T5 cells arises; that is, whether it is already present in the dendrite, or whether it is generated by synaptic interactions within the lobula plate. This question is hard to answer, as the den-drites of both T4 and T5 cells form a dense mesh within the proximal layer of the medulla (T4) and the lobula (T5), respectively. However, signals within the inner chiasm where individual processes of T4 and T5 cells can be resolved in some preparations show a clear selectivity for motion in one over the other directions (Fig. 2c). Such signals are as directionally selective as the ones measured within the lobula plate, demonstrating that the signals delivered from the dendrites of T4 and T5 cells are already directionally selective.
To assess the particular contribution of T4 and T5 cells to the signals observed in the above experiments, we used driver lines specific for T4 and T5 cells, respectively. Applying the same stimulus protocol and data evaluation as in Fig. 1, identical results were obtained as before for both the T4- as well as the T5-specific driver line (Fig. 3a, b). We conclude that T4 and T5 cells each provide directionally selective
signals to the lobula plate, in contrast to previous reports11. Thus, both
T4 and T5 cells can be grouped, according to their preferred direction, into four subclasses covering all four cardinal directions, reminiscent
of ON–OFF ganglion cells of the rabbit retina16.
We next addressed whether T4 cells respond differently to T5 cells. To answer this question, we used, instead of gratings, moving edges with either positive (ON edge, brightness increment) or negative (OFF edge, brightness decrement) contrast polarity as visual stimuli. We found that T4 cells strongly responded to moving ON edges, but showed little or no response to moving OFF edges (Fig. 3c). This is true for T4 cells terminating in each of the four layers. We found the opposite for T5 cells. T5 cells selectively responded to moving OFF edges and mostly failed to respond to moving ON edges (Fig. 3d). Again, we found this for T5 cells in each of the four layers. We next addressed whether there are any other differences in the response properties between T4 and T5 cells by testing the velocity tuning of both cell populations by means of stimulating flies with grating motion along the horizontal axis from the front to the back at various velocities covering two orders of magnitude. T4 cells revealed a maximum
res-ponse at a stimulus velocity of 30us21, corresponding to a temporal
frequency of 1 Hz (Fig. 3e). T5 cell responses showed a similar depend-ency on stimulus velocity, again with a peak at a temporal frequdepend-ency of
a c Time (s) Lobula plate Lobula Lobula Inner chiasm Lobula plate Proximal Distal b Time (s) Response ( Δ F/F ) Inner chiasm Lobula plate
0 5 10 15 20
0 0.5 1.0 1.5
0 5 10 15 20 25 30 35
–1.0 –0.5 0 0.5 1.0 1.5 Response ( Δ F/F )
Figure 2|Local signals of T4 and T5 cells. a, Retinotopic arrangement of T4 and T5 cells. A dark edge was moving repeatedly from front-to-back within a 15uwide area at different azimuthal positions (left). This leads to relative fluorescence changes at different positions along the proximal–distal axis within layer 1 of the lobula plate (right). Scale bar, 5mm. Similar results have been obtained in four other flies.b, Sequential activation of T4 and T5 cells. A bright edge was moving from back-to-front at 15us21. Scale bar, 5mm. Similar
results have been obtained in six other flies.c, Signals recorded from individual fibres within the inner chiasm (left) reveal a high degree of direction selectivity (right). Scale bar, 5mm. Similar results were obtained from four other flies, including both lines specific for T4 and T5 cells. Response traces inbandcare derived from the region of interest encircled in the image with the same colour.
8 A U G U S T 2 0 1 3 | V O L 5 0 0 | N A T U R E | 2 1 3
Macmillan Publishers Limited. All rights reserved ©2013
1 Hz (Fig. 3f). Thus, there is no obvious difference in the velocity tuning between T4 and T5 cells. As another possibility, T4 cells might functionally differ from T5 cells with respect to their directional tuning width. To test this, we stimulated flies with gratings moving into 12 different directions and evaluated the relative change of fluorescence in all four layers of the lobula plate. Using the T4-specific driver line, we
found an approximate half width of 60–90uof the tuning curve, with
the peak responses in each layer shifted by 90u(Fig. 3g). No decrease of
calcium was detectable for grating motion opposite to the preferred direction of the respective layer. When we repeated the experiments using the T5-specific driver line, we found a similar dependence of the relative change of fluorescence on the stimulus direction (Fig. 3h). We conclude that T4 cells have the same velocity and orientation tuning as T5 cells. The only functional difference we were able to detect remains their selectivity for contrast polarity.
Our finding about the different preference of T4 and T5 cells for the polarity of a moving contrast makes the strong prediction that selective
blockade of T4 or T5 cells should selectively compromise the responses of downstream lobula plate tangential cells to either ON or OFF edges. To test this prediction, we blocked the output of either T4 or T5 cells
via expression of the light chain of tetanus toxin17and recorded the
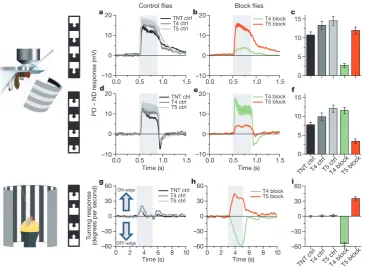
responses of tangential cells via somatic whole-cell patch to moving ON and OFF edges. In response to moving ON edges, strong and reliable directional responses were observed in all control flies (Fig. 4a). However, T4-block flies showed a strongly reduced response to ON edges, whereas the responses of T5-block flies were at the level of control flies (Fig. 4b, c). When we used moving OFF edges, control flies again responded with a large amplitude (Fig. 4d). However, the responses of T4-block flies were at the level of control flies, whereas the responses of T5-block flies were strongly reduced (Fig. 4e, f). These findings are reminiscent on the phenotypes obtained from blocking lamina cells L1 and L2 (ref. 13) and demonstrate that T4 and T5 cells are indeed the motion-coding intermediaries for these contrast polar-ities on their way to the tangential cells of the lobula plate. Whether the residual responses to ON edges in T4-block flies and to OFF edges in T5-block flies are due to an incomplete signal separation between the two pathways or due to an incomplete genetic block in both fly lines is currently unclear.
To address the question of whether T4 and T5 cells are the only motion detectors of the fly visual system, or whether they represent one cell class, in parallel to other motion-sensitive elements, we used
tethered flies walking on an air-suspended sphere18and stimulated
them by ON and OFF edges moving in opposite directions19. As in
the previous experiments, we blocked T4 and T5 cells specifically by selective expression of the light chain of tetanus toxin. During balanced motion, control flies did not show significant turning responses to either side (Fig. 4g). T4-block flies, however, strongly followed the direction of the moving OFF edges, whereas T5-block flies followed the direction of the moving ON edges (Fig. 4h, i). In summary, the selective preference of T4-block flies for OFF edges and of T5-block flies for ON edges not only corroborates our findings about the selec-tive preference of T4 and T5 cells for different contrast polarities, but also demonstrates that the signals of T4 and T5 cells are indeed the major, if not exclusive, inputs to downstream circuits and motion-driven behaviours.
Almost a hundred years after T4 and T5 cells have been
anato-mically described3, this study reports their functional properties in a
systematic way. Using calcium as a proxy for membrane voltage20, we
found that both T4 and T5 cells respond to visual motion in a direc-tionally selective manner and provide these signals to each of the four layers of the lobula plate, depending on their preferred direction. Both cell types show identical velocity and orientation tuning which
matches the one of the tangential cells21,22. The strong direction
selec-tivity of both T4 and T5 cells is unexpected, as previous studies had concluded that the high degree of direction selectivity of tangential cells is due to a push–pull configuration of weakly directional input
with opposite preferred direction23,24. Furthermore, as the preferred
direction of T4 and T5 cells matches the preferred direction of the tangential cells branching within corresponding layers, it is currently unclear which neurons are responsible for the null-direction response of the tangential cells. As for the functional separation between T4 and T5 cells, we found that T4 cells selectively respond to brightness incre-ments, whereas T5 cells exclusively respond to moving brightness decre-ments. Interestingly, parallel ON and OFF motion pathways had been previously postulated on the basis of selective silencing of lamina neu-rons L1 and L2 (ref. 13). Studies using apparent motion stimuli to probe the underlying computational structure arrived at controversial conclusions: whereas some studies concluded that there was a separate
handling of ON and OFF events by motion detectors12,25,26, others did
not favour such a strict separation19,27. The present study directly
demonstrates the existence of separate ON and OFF motion detectors, as represented by T4 and T5 cells, respectively. Furthermore, our results anatomically confine the essential processing steps of elementary
e
b
g h
Normalized r
esponse
Temporal frequency (Hz)
T4 cells T5 cells
a
Response (
Δ
F/F
) Layer 1 Layer 2 Layer 3 Layer 4 Layer 1 Layer 2 Layer 3 Layer 4
c d f 0.0 0.5 1.0 1.5
0.1 1 10 0 0.25 0.50 0.75 1.00 0.5 1.0 0° 30° 60° 90° 120° 150° 210° 240° 270° 300° 330° 0 0.5 1.0 Layer 1 Response ( Δ F/F ) 0.0 0.5 1.0 1.5 Normalized r esponse 0 0.25 0.50 0.75 1.00
Temporal frequency (Hz) 0.1 1 10
Normalized r esponse Normalized r esponse Layer 2 Layer 3 Layer 4 180° 0.5 1.0 0 0.5 1.0 0° 30° 60° 90° 120° 150° 210° 240° 270° 300° 330° 180° Layer 1 Layer 2 Layer 3 Layer 4
Figure 3|Comparison of visual response properties between T4 and T5 cells. a,b, Relative fluorescence changes (DF/F) of the lobula plate terminals of T4 (a) and T5 (b) cells obtained during grating motion along the four cardinal directions. Results represent the data obtained from a single fly each, averaged over two stimulus repetitions. Scale bars, 5mm. Similar results have been obtained in ten other flies.c,d, Responses of T4 (c) and T5 (d) cells to ON and OFF edges moving along all four cardinal directions. ON (white) and OFF (black) responses within each layer are significantly different from each other, withP,0.005 except for layers 3 and 4 in T5 cells, whereP,0.05.
e,f, Responses of T4 (e) and T5 (f) cells to gratings moving horizontally at different temporal frequencies. Relative fluorescence changes were evaluated from layer 1 of the lobula plate and normalized to the maximum response before averaging.g,h, Responses of T4 (g) and T5 (h) cells to gratings moving in 12 different directions. Relative fluorescence changes were evaluated from all four layers of the lobula plate normalized to the maximum response before averaging. Data represent the mean6s.e.m. of the results obtained inn58 (c),n57 (d),n56 (e),n57 (f),n56 (g) andn55 (h) different flies. Significances indicated are based on two-samplet-test.
RESEARCH LETTER
2 1 4 | N A T U R E | V O L 5 0 0 | 8 A U G U S T 2 0 1 3
Macmillan Publishers Limited. All rights reserved ©2013