P R O C E E D I N G S
Open Access
Does pathway analysis make it easier for
common variants to tag rare ones?
Hae-Won Uh
1,2*, Roula Tsonaka
1, Jeanine J Houwing-Duistermaat
1From
Genetic Analysis Workshop 17
Boston, MA, USA. 13-16 October 2010
Abstract
Analyzing sequencing data is difficult because of the low frequency of rare variants, which may result in low power to detect associations. We consider pathway analysis to detect multiple common and rare variants jointly and to investigate whether analysis at the pathway level provides an alternative strategy for identifying susceptibility genes. Available pathway analysis methods for data from genome-wide association studies might not be efficient because these methods are designed to detect common variants. Here, we investigate the performance of several existing pathway analysis methods for sequencing data. In particular, we consider the global test, which does not consider linkage disequilibrium between the variants in a gene. We improve the performance of the global test by assigning larger weights to rare variants, as proposed in the weighted-sum approach. Our conclusion is that straightforward application of pathway analysis is not satisfactory; hence, when common and rare variants are jointly analyzed, larger weights should be assigned to rare variants.
Background
Genome-wide association studies (GWAS) have found hundreds of single-nucleotide polymorphisms (SNPs) that are significantly associated with several complex traits. In most cases, however, these SNPs explain only a small proportion of the known genetic variance. A pos-sible explanation is that causal variants have a lower minor allele frequency (MAF) than common SNPs. Moreover, rare variants are weakly correlated with com-mon SNPs, because MAFs must be similar for two var-iants to be highly correlated [1]. It follows that common variants may have only a limited capacity to tag rare variants. This limitation in GWAS, in which common variants with a frequency of 5% or higher were used, leads to a direct search for associations with multiple rare variants. Recently, efforts have been made to geno-type rare variants, such as in the 1000 Genomes Project (http://www.1000genomes.org). The low frequency of rare variants, however, may result in low power to detect associations. Given currently available sample
sizes, there is a need for powerful methods to detect association with multiple rare variants. We investigate whether pooling variants by pathway into a composite test provides an alternative strategy for identifying sus-ceptibility genes.
Pathway analysis methods have been developed in the context of gene expression data analysis. There are two general approaches: competitive and self-contained. The distinction lies in the definition of the null hypothesis and in the calculation of theP-value [2,3]. Concerning the defi-nition of the null hypothesis, a competitive test compares differential expression of the gene set to a standard defined by the complement of that gene set. In contrast, a self-contained test compares the gene set to a fixed standard that does not depend on the measurements of genes out-side the gene set. Concerning the calculation of the P-value, the competitive test bases the calculation of theP-value for the gene set on a distribution in which the gene is the sampling unit, whereas the self-contained test takes the subject as the sampling unit.
Recently, these methods have been extended to data from GWAS to detect pathway association. Compared to expression data, several distinctive features in the data from GWAS require different methodological * Correspondence: [email protected]
1
Department of Medical Statistics and Bioinformatics, Leiden University Medical Center, Einthovenweg 20, 2333 ZC Leiden, The Netherlands Full list of author information is available at the end of the article
considerations. In contrast to gene expression data, in which each gene contains one expression value, in data from GWAS each gene contains many SNPs that are in linkage disequilibrium (LD). Here lies the distinction between one- and two-stage approaches; the first approach ignores these biological features, and hence the second approach might be more powerful [4]. Incor-poration of LD information, however, might be less essential if we focus on rare variants using sequencing data because of weak correlation of rare variants with common SNPs.
In this paper, using the data provided by Genetic Ana-lysis Workshop 17 (GAW17) [5] and several pathway analysis methods, we test the vascular endothelial growth factor (VEGF) pathway that influences quantita-tive trait Q1. Because we have a target gene set (we knew the“answers”to the GAW17 simulation), the nat-ural choice is the self-contained methods that consider only the genes or SNPs involved in the specific gene set. The first method to be applied is the global test (GT) [6]; this test was designed for gene expression data and uses all SNPs without consideration of gene-level effects (one-stage approach). Next we consider two two-stage approaches that were designed for detecting common variants: the gene set ridge regression in association stu-dies (GRASS) algorithm [4] and a new test called the empirical Bayes (EB) method [7]. At the gene-level, the GRASS algorithm uses LD information within a gene using principal components analysis, and at the pathway level the GRASS algorithm uses ridge regression. The EB method uses a mixed-effects model with a general random effects structure at the pathway level and uses the empirical Bayes estimates of the random effects of the first stage as covariates in the model for the pheno-type. Because the GRASS algorithm can deal with only binary outcome, the GAW17 affected-unaffected pheno-type serves as the outcome variable for these analyses.
The methods we use were designed to detect multiple common variants with small effects. To better deal with the low frequency of rare variants, we propose to weight counts of each rare variant (MAF < 1%) on the basis of the estimated variance under the null hypothesis of no association. We propose the weighted global test (WGT), in which the weights are defined as in the weighted-sum method [8] for rare variants and take a value of 1 for common variants in the GT.
Once significant pathways are identified, we might want to pinpoint the associated genes for further analy-sis. We consider three methods at the gene level: the combined multivariate and collapsing (CMC) method [9], the weighted-sum approach [8] that analyzes only rare variants, and the WGT. For details of the first two methods, we refer to Dering et al. [10].
All programming has been conducted in R (http:// www.r-project.org). The R package globaltest can be obtained at http://www.bioconductor.org, and the source code for GRASS (SNPath) can be downloaded at http:// linchen.fhcrc.org/grass.html.
Methods
Study sample
We consider data from 697 unrelated individuals. We analyze the 125 SNPs (28 common and 97 rare SNPs) in 9 genes from the VEGF pathway, which influences quantitative risk factor Q1. The MAFs range from 0.07% to 16.5%. The dichotomous phenotype Affected serves as the outcome variable (488 control subjects and 209 case subjects). We apply the pathway analysis methods to the 200 simulated GAW17 data sets to study the power.
Pathway analysis methods
We begin by establishing some notation. For N indivi-duals atJloci, we letxi= (xi1, …,xiJ)′be a column
vec-tor in whichxijis the genotype at locusjin individuali.
We code each genotype as 0, 1, or 2, corresponding to the number of minor alleles present at that locus. We also let Yi denote the disease status of individual i,
which is coded 0 for control subjects and 1 for case sub-jects. We then let X = (X1, …, XN)′ be anN×J matrix
of genotype data and letY = (Y1, …, YN)′ be the N× 1
vector of disease status. In addition, for two-stage approaches, we denote g = 1,…, G forG genes in a pathway.
The GT is a one-stage approach and is based on a regression model that predicts response from the SNPs of a gene set. We use generalized linear models to model the dependency of responseYon gene expression measurementsXof a set ofJ SNPs onNsamples:
h E Yi xij j
j J ( ( b))= +a b ,
=
∑
1 (1)where hdenotes the link function. Under an assump-tion that all regression coefficients are sampled from a common distribution with mean 0 and variance τ2, instead of testing H0: b= (b1,…,bJ) = 0, one can test a
new null hypothesis:H0:τ2 = 0. Using the notation:
ri xij j
j
=
∑
b , (2)the model simplifies to a random effects model:
The null hypothesis can then be tested, based on a score test statistic [11,12]:
Q=(Y − ′m) (R Y−m),
m2 (4)
whereR= (1/m)XX′, μ=h−1(a), andμ2 is the second
central moment of Yunder the null hypothesis . It can be shown that Qis asymptotically normally distributed. However, thep-value is calculated based on permuta-tions of samples (case and control labels).
For the weighted version of the GT, the WGT, the weightsw= (w1,…, wJ)′are added to the model as
fol-lows:
h E Y
w x
i
j ij j j
J
( ( b))= +a b .
=
∑
11
(5)
We assign more weight to rare variants (MAF < 1%), as calculated in the weighted-sum approach, as follows [8]. Letnjbe the total number of subjects genotyped for
variantj, mUj be the number of mutant alleles observed
in the control subjects, and nUj be the total number of
individuals genotyped for variantj. The weight:
wj =⎡⎣n qj j(1−qj)⎤⎦1 2/ (6)
is the expected variance based on allele frequencies qj
computed from control subjects only:
q m
n
j j U
j U
= +
+ 1
2 2. (7)
We assign the weight 1 to common SNPs.
The GRASS algorithm is a two-stage approach. At the gene level the GRASS algorithm captures LD structure with principal components analysis. For each gene, it selects all nontrivial eigen-SNPs that explain about 95% of the gene variation, and a least absolute shrinkage and selection operator (LASSO) regression is used to sum-marize the most representative eigen-SNPs:
bg =
(
beigen-2 S1+ +beigen-2 Sk)
1 2/
(8)
fork≤J eigen-SNPs. At the pathway level, the group ridge regression is applied, and the statistic can be writ-ten:
T = b =
(
b12++bG2)
1 2/
(9)
The significance of the statistic is determined by per-mutation of case and control labels.
The EB method is a two-stage approach. In the first step we summarize the subject-specific SNP information using the EB estimates of the random effects of a mixed-effects logistic regression. In the second stage, the obtained EB estimates are used as covariates in the phenotypic model to test for association of genes. For details we refer to Houwing-Duistermaat et al. [7]. Let Xigjbe the genotype at locusjin geneg for individuali.
Letbi be the random effect for subjecti, and letbigbe
the random effect of gene g of individual i. Under Hardy-Weinberg equilibrium, Xigj given bi andbig is
assumed to follow a binomial distribution with the num-ber of trials being 2 and a probabilityπigj. The
probabil-ity is modeled as follows:
log p
p
igj igj
i ig
b b
1− = + (10)
For each gene the EB estimate is given by:
ebˆig =bˆi+bˆig (11)
Intuitively, the EB estimate can be interpreted as fol-lows: The more minor alleles an individual has over all the SNPs in a gene, the higher the EB estimate will be for this gene.
Calculation of type I error rate and power
Because none of the methods have been applied to path-way analysis with multiple common and rare variants, we investigate the type I error rate and power of each method. To determine the type I error rate, we simulate phenotype under the null hypothesis of no association; we generate 1,000 samples from the normal distribution and dichotomize the phenotypes by taking the top 30% as case subjects and the rest as control subjects. The type I error rates of the methods are then calculated as the proportion of significant replicates at the nominal level of 5% out of 1,000 replicates. For the type I error rate, 95% of the empirical estimates of 1,000 replicates are expected to fall between 0.036 and 0.064. The empirical power is determined by calculating the number of times theP -values are smaller than the preset threshold of 0.05 divided by 200, the number of simulated phenotypes.
Results
(41%) and GRASS algorithm (43%) were comparable, but the EB method had little power (5%) to establish association. The WGT, in which rare variants received more weight, as described in the Methods section, had an increased power of 65%.
To narrow down the candidate region and possibly pinpoint the associated genes for further analysis, we conducted an association analysis of each gene in the pathway. Because the WGT performed best at the path-way level, we compared the WGT to the CMC and weighted-sum methods. In Table 2, the power of the three methods at each gene is given. Nine genes influ-ence the Q1 quantitative risk factor, but VEGFC, con-taining only one rare SNP, was not analyzed. Except for FLT1, the power of all three methods was low, and the CMC method outperformed the other methods. For FLT1, for which more rare variants were included, the two methods that assign more weight to rare variants performed better.
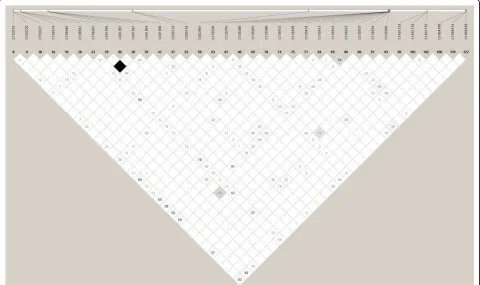
Next we investigated whether the common variants might tag rare variants. We first examined the correla-tion between the SNPs. We used Haploview [13] to pro-duce a LD plot using the r2 measure. Figure 1 shows weak correlations (r2≈ 0) between the 125 SNPs. Then, we examined the EB estimates, which reflect the
Table 1 Type I error rate and empirical power of tests for 125 SNPs in the VEGF pathway
Method Type I error rate Empirical power
Global test 0.044 0.41
GRASS 0.047 0.43
Empirical Bayes 0.055 0.05
Weighted global test 0.041 0.65
Table 2 Empirical power of tests for genes in the VEGF pathway
Gene Number of SNPs Empirical power
Total Common Rare CMC
Weighted-sum
Weighted global test
ARNT 18 (5) 3 (1) 15 (4) 0.31 0.28 0.12
ELAVL4 10 (2) 3 (0) 7 (2) 0.27 0.10 0.14
FLT1 35 (11) 10 (3) 25 (8) 0.80 0.83 0.84
FLT4 10 (2) 2 (0) 8 (2) 0.03 0.02 0.02
HIF1A 8 (4) 1 (1) 7 (3) 0.03 0.02 0.03
HIF3A 21 (3) 6 (0) 15 (3) 0.13 0.04 0.15
KDR 16 (10) 2 (2) 14 (8) 0.16 0.09 0.08
VEGFA 6 (1) 1 (0) 5 (1) 0.07 0.05 0.08
VEGFC 1 (1) 0 (0) 1 (1)
The number of functional SNPs is shown in parentheses.
Figure 1Linkage disequilibrium of 125 SNPs usingr2in the VEGF pathway.The lowr2≈0 values (white cells) show weak correlations between the SNPs. The white cells indicate absence of LD (r2= 0), shades of grey intermediate degree of LD (0 <r2< 1), and black cells high
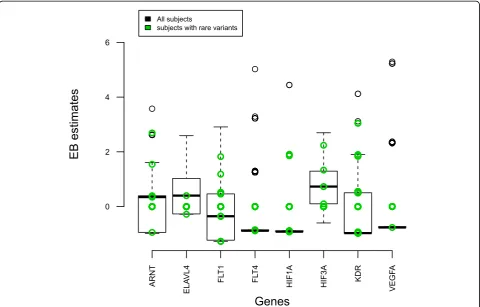
summarized information per gene, for all individuals (Figure 2). Overall, there was little evidence that com-mon variants tagged rare ones. Otherwise, the EB esti-mates of the subjects with rare variants (green circles) would have had higher EB values to contribute to over-all statistics. ForFLT1andKDRthe contribution of sub-jects with rare variants was comparable to the contribution of subjects with common variants.
Discussion and conclusions
We investigated the performance of several pathway analysis methods to detect multiple rare variants that are associated with disease. The empirical power for all methods was low. The powers of the GT and GRASS algorithm were comparable, even though the GT did not use gene-level information (such as LD in a gene and the size of genes). As depicted in Figure 1, rare and common SNPs were weakly correlated with each other. Adding LD information, therefore, would not improve efficiency. The GRASS algorithm uses principal compo-nents analysis at the gene level, and the robustness of the principal components analysis for summarizing rare
variants should be investigated. By giving more weight to rare variants, the power of the WGT increased from 41% to 65%. Improvement by using a variable threshold for rare variants or other methods might be possible. The power of the EB method was poor, which implied that the EB method cannot deal with rare variants well. This was also confirmed by investigating the EB esti-mates of individuals with rare variants (Figure 2). A lar-ger number of common and rare variants within a gene might improve the EB approach. Improvements might also be possible by better summarizing the information on rare variants at the gene level by collapsing rare var-iants and including family data.
We also studied the type I error rate by using (200) dichotomized Q4 phenotypes, because Q4 phenotypes are assumed not to be associated with any SNP in the VEGF pathway that influences Q1. This resulted in extremely inflated type I error rates. To investigate pos-sible correlation between dichotomized phenotypes Q4 and the Affected status, we constructed a simple 2 × 2 table. The concordance rates for 200 data sets were 68.2–75.9% with an average of 72.5%; that is, 72.5% of
Genes
EB estimates
●
ARNT
ELA
VL4 FLT1 FLT4
HIF1A HIF3A KDR VEGF
A
0 2 4 6
All subjects
subjects with rare variants
subjects had the same case-control status in both phe-notypes. Simulating phenotype under the null hypothesis of no association seems a better practice for estimating type I error rate.
Concerning the conjecture of whether pathway analy-sis would be helpful for detecting multiple common and rare variants jointly, both Figures 1 and 2 show little evidence of common variants tagging rare ones. In Fig-ure 1 we used the r2 measure. If both of two loci have rare alleles, it is possible for D′ to be 1 andr2 to be small. Hence, D′ is hard to interpret with rare alleles, and we chose to user2, which is a better measure for this situation. New methods might be needed to accom-modate the specific features of the sequencing data.
When pinpointing specific genes, except FLT1, the empirical power of all three methods was low. ForFLT1 there were eight rare and three common causal variants; the effect sizes of the common variants ranged from 0.61 to 0.74. In contrast, the power to detect KDR, which has eight rare and two common variants and roughly the same genetic profile as FLT1, was very low. A possible explanation could be that the amount of information contained in the two genes is different. Here, the EB estimates at the gene level could be a use-ful tool; in Figure 2 the median value of FLT1 was higher than that of KDR. In addition, when common and rare variants are analyzed together, the common variants might play a significant role. The effect sizes of the common variants inFLT1 (0.61–0.74) were larger that those inKDR(0.14 and 0.30).
We investigated the use of pathway analysis methods by jointly considering common and rare variants for sequencing data. We report promising performance of the WGT, which gives larger weights to rare variants compared to other methods intended for detecting com-mon variants. Our conclusion is that straightforward application of pathway analysis is not satisfactory; hence, when common and rare variants are jointly analyzed using sequencing data, larger weights should be assigned to rare variants.
Acknowledgments
HWU and JJHD were supported by the Program Grant NOW 917.66.344 from the Netherlands Organization for Scientific Research. The Genetic Analysis Workshop is supported by National Institutes of Health grant R01 GM031575. This article has been published as part ofBMC ProceedingsVolume 5 Supplement 9, 2011: Genetic Analysis Workshop 17. The full contents of the supplement are available online at http://www.biomedcentral.com/1753-6561/5?issue=S9.
Author details
1Department of Medical Statistics and Bioinformatics, Leiden University
Medical Center, Einthovenweg 20, 2333 ZC Leiden, The Netherlands.
2
Netherlands Consortium for Healthy Ageing, Leiden University Medical Center, P.O. Box 9600, 2300 RC Leiden, The Netherlands.
Authors’contributions
HWU preprocessed data, performed the analyses, and wrote the manuscript. HWU and JJHD participated in the development of the methods. HWU, RT, and JJHD interpreted the results of the analysis. All authors read and approved the final manuscript.
Competing interests
The authors declare that there are no competing interests.
Published: 29 November 2011
References
1. Asimit J, Zeggini E:Rare variant association analysis methods for complex traits.Annu Rev Genet2010,44:293-308.
2. Tian L, Greenberg SA, Kong SW, Altschuler J, Kohane IS, Park PJ: Discovering statistically significant pathways in expression profiling studies.Proc Natl Acad Sci USA2005,102:13,544-13,549.
3. Goeman JJ, Bühlmann P:Analyzing gene expression data in terms of gene sets: methodological issues.Bioinformatics2007,23:980-987. 4. Chen LS, Hutter CM, Potter JD, Liu Y, Prentice RL, Peters U, Hsu L:Insights
into colon cancer etiology using a regularized approach to gene set analysis of GWAS data.Am J Hum Genet2010,86:860-871.
5. Almasy LA, Dyer TD, Peralta JM, Kent JW Jr., Charlesworth JC, Curran JE, Blangero J:Genetic Analysis Workshop 17 mini-exome simulation.BMC Proc2011,5(suppl 9):S2.
6. Goeman JJ, van de Geer SA, van Houwelingen HC:Testing against a high-dimensional alternative.J R Stat Soc Ser B Stat Methodol2006,68:477-493. 7. Houwing-Duistermaat JJ, Uh HW, Tsonaka R:Pathway analysis for family
data using nested random-effects models.BMC Proc2011,5(suppl 9):S22. 8. Madsen BE, Browning SR:A groupwise association test for rare mutations
using a weighted sum statistic.PLoS Genet2009,5:e1000384. 9. Li B, Leal SM:Methods for detecting associations with rare variants for
common diseases: application to analysis of sequence data.Am J Hum Genet2008,83:311-321.
10. Dering C, Pugh E, Ziegler A:Statistical analysis of rare sequence variants: an overview of collapsing methods.Genet Epidemiol2011, X(suppl X):X-X.
11. Le Cessie S, van Houwelingen HC:Testing the fit of a regression model via score tests in random effects models.Biometrics1995,51:600-614. 12. Houwing-Duistermaat JJ, Derkx BH, Rosendaal FR, van Houwelingen HC:
Testing familial aggregation.Biometrics1995,51:1292-1301.
13. Barrett JC, Fry B, Maller J, Daly MJ:Haploview: analysis and visualization of LD and haplotype maps. Bioinformatics2005,21:263-265.
doi:10.1186/1753-6561-5-S9-S90
Cite this article as:Uhet al.:Does pathway analysis make it easier for common variants to tag rare ones?BMC Proceedings20115(Suppl 9):S90.
Submit your next manuscript to BioMed Central and take full advantage of:
• Convenient online submission
• Thorough peer review
• No space constraints or color figure charges
• Immediate publication on acceptance
• Inclusion in PubMed, CAS, Scopus and Google Scholar
• Research which is freely available for redistribution