P R O C E E D I N G S
Open Access
Population structure analysis using rare and
common functional variants
Tesfaye M Baye
1,2*, Hua He
3, Lili Ding
3, Brad G Kurowski
2,4, Xue Zhang
3, Lisa J Martin
2,3,5From
Genetic Analysis Workshop 17
Boston, MA, USA. 13-16 October 2010
Abstract
Next-generation sequencing technologies now make it possible to genotype and measure hundreds of thousands of rare genetic variations in individuals across the genome. Characterization of high-density genetic variation facilitates control of population genetic structure on a finer scale before large-scale genotyping in disease genetics studies. Population structure is a well-known, prevalent, and important factor in common variant genetic studies, but its relevance in rare variants is unclear. We perform an extensive population structure analysis using common and rare functional variants from the Genetic Analysis Workshop 17 mini-exome sequence. The analysis based on common functional variants required 388 principal components to account for 90% of the variation in population structure. However, an analysis based on rare variants required 532 significant principal components to account for similar levels of variation. Using rare variants, we detected fine-scale substructure beyond the population structure identified using common functional variants. Our results show that the level of population structure embedded in rare variant data is different from the level embedded in common variant data and that correcting for population structure is only as good as the level one wishes to correct.
Background
With increasing availability of polymorphic molecular mar-kers across genomes, examining population structure using a large number of loci has become a common practice in evolutionary biology and human genetics [1]. In assigning individual membership and inferences, investigators have found that some markers (or variants) are more informa-tive than others [2]. In such cases, many loci are typed on samples from these populations, and subsets of these loci (typically those that appear most divergent between the populations) are chosen for analysis. Selecting and using only the most informative markers for population assign-ment can reduce both time and genotyping costs while retaining most of the power of the complete set of markers. However, currently more than 15 million common and rare single-nucleotide polymorphisms (SNPs) have been deposited in the 1000 Genomes Project database, and users of these data sets have several questions, including how
many rare or common SNP loci are needed to get a good clustering or assignment and how much of the total varia-tion is attributed to rare and common variants. In addivaria-tion, the relationship between common and rare variants in terms of population structure remains unknown. To address this issue, we sought to answer the following two questions: Does a similar population structure (or inferred ancestry) exist in common and rare variants? From a popu-lation stratification perspective, how strongly are rare and common variants correlated? When both common and rare variants are obtained from the same participants, we are given the opportunity to investigate these questions directly. To answer these questions, we used rare and common SNPs from the Genetic Analysis Workshop 17 (GAW17) mini-exome sequence and ran a multivariate statistical analysis.
Methods
For our analysis we used the data available from the 1000 Genomes Project as given in the GAW17 mini-exome sequence [3]. Seven of the 11 populations were included: Caucasians from the United States with northern and
* Correspondence: [email protected] 1
Division of Asthma Research, Cincinnati Children’s Hospital Medical Center, 3333 Burnet Avenue, Cincinnati, OH 45229, USA
Full list of author information is available at the end of the article
western European ancestry; Yoruba from Ibadan, Nigeria; Japanese from Tokyo; Han Chinese from Beijing; Chinese in metropolitan Denver, Colorado; Luhya in Webuye, Kenya; and Tuscans in Italy.
We first divided the data set into two groups: common functional variants and rare functional variants. Functional variants are variants that confer detectable (nonsynon-ymous) functional changes (both coding and regulatory) on the locus. Rare variants have a minor allele frequency (MAF) less than 5%, and variants with MAFs greater than (or equal to) 5% are common. In this study, the common functional variants consist of 1,379 SNPs and the rare func-tional variants consist of 12,193 SNPs. Both variants were summarized across the seven populations (697 samples). We used principal components analysis to reduce variable dimension, Structure analysis to assess ancestry, and discri-minant analysis to predict population membership.
Principal components analysis
Principal components analysis synthesizes information contained in a set ofnobserved variables (M1,…,Mn) by seeking a new set ofk(k<n) orthogonal variables (PC1,
…, PCk), named PC; these variables are calculated from the eigen-decomposition of the covariance matrix M. Thejth principal component (PC) is a linear combination of the observed variables:
PCj=a1jM1++anjMn, (1)
Where coefficientsaijare elements of the eigenvector corresponding to thejth eigenvalue. PCs were extracted in descending order from the corresponding eigenvalue that measures the variance of the original variables explained by each PC [4]. PCs were calculated using the R software (www.r-project.org). Because the axis of the PCs often cor-respond or co-segregated with geographic ancestries, we applied Structure analysis [5] to estimate the ancestry of each individual based on the seven populations. For each ancestry estimate, we performed 10,000 burn-in periods and 10,000 iterations. Separate analyses were performed for common and rare functional variants.
Discriminant analysis
To avoid the limitation of a large number of SNPs com-pared to the relatively small number of individuals and the correlation occurring in allele frequencies, we ran a discriminant analysis using the uncorrelated top signifi-cant PCs. This analysis ensures that variables submitted to discriminant analysis are perfectly uncorrelated and that their number is less than that of analyzed indivi-duals. For each data set (common and rare functional variants), we ranked markers based on the loading from the PCs eigenvector. From ranked markers, we selected the top subsets of markers (20–1,000 markers per subset)
to evaluate population membership using prediction accuracy measures [4]. Prediction accuracy was calcu-lated as the number of correctly classified individuals divided by the total number of individuals in the study.
Results
Population structure using common functional variants Principal components analysis using common functional variants revealed clear distinction among the three human geographic origins (Europe, Asia, and Africa) but not among the seven different populations studied (Figure 1). The first PC (which explains the largest portion of varia-tion, 10.4%) distinguished between Africans and non-Africans, with samples from Yoruba and Han Chinese being widespread compared to the rest of the populations. The second PC, explaining 6.6% of the total variation, distinguished between Europeans and non-Europeans. The analysis based on common variants required 388 PCs to account for 90% of the variation or population struc-ture. Although the scree plots suggest that the first four PCs would be optimal to adjust for population stratifica-tion, we present the first two PCs in Figure 1 to demon-strate differences among the seven populations.
Population structure using rare variants
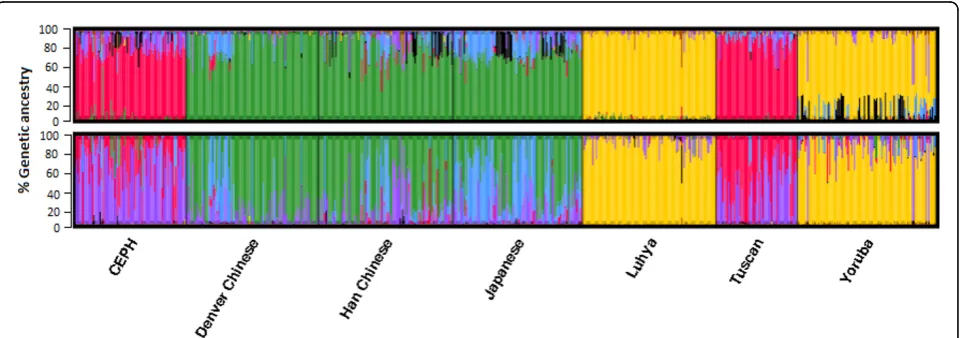
Using PC1, we found that the populations were quite close to each other and did not show any clear clustering. Africans and non-Africans were distinguished only on the second PC (PC2) (Figure 1). The first PC contributed 1.6% and the second PC contributed 0.84% of the total variation among populations. The analysis based on rare variants required 532 significant PCs to account for 90% of the variation or population structure. The scree plots suggest that the first nine PCs should be included to adjust for population stratification; nonetheless, plotting PC1 against PC2 of the rare variants showed that most of these individuals had intermediate values between conti-nental clusters of origin (Figure 1). Although individuals were classified according to geographic origin using prin-cipal components analysis, we observed substantial varia-bility in the ancestral genetic background based on rare variants compared with common variants (Figure 2). Using rare variants, we identified an individual with pri-mary European ancestry in a population sample of Yoruba.
(Figure 3). This was in contrast to the 1,000 rare func-tional variants needed to reach the same level of assign-ment of individuals to their correct ancestry.
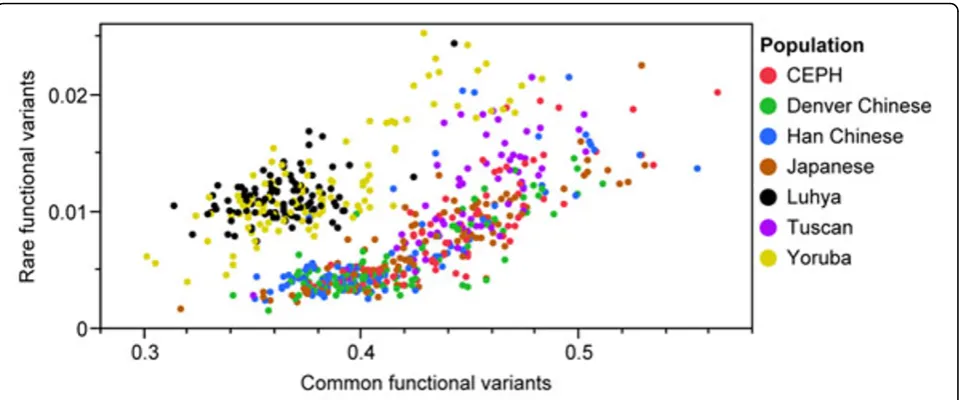
Distribution of MAF
European and Asian samples were more enriched in common functional variants, although African samples had more rare functional variants (Figure 4). It is also interesting to note that, although the actual variants contributing to population structure differed, we observed a modest statistical correlation (r = 0.38) between common and rare functional variants.
Discussion and conclusions
Population structure is an important factor in genetic studies of common variants, but its relevance for rare variants is unclear. To our knowledge, the analysis pre-sented here is the first population genetic structure study
to explore rare versus common variants (using the same samples). To summarize genetic variation, we applied principal components analysis and demonstrated that the number of PCs required to account for population struc-ture varied by the MAF of variants. Higher numbers of SNPs were required to account for a similar level of population structure when we used rare variants com-pared with common functional variants. In estimating ancestry proportion, using Structure analysis, we identi-fied many Denver Chinese with more than 50% Japanese ancestry and many Tuscan individuals with more than 50% European ancestry. This result indicates the effec-tiveness of including rare variants to detect outliers even among geographically close populations. Also, a single individual with high (>90%) inferred European ancestry could be identified in the Yoruba population. However, this individual had less inferred European ancestry when we looked at common variants. This result further
Figure 1Scatterplot of principal component axis one (PC1) and axis two (PC2) based on (a) common functional variants and (b) rare functional variants.CEPH, European-descended population (U.S. Caucasians).
indicates the effectiveness of using rare variants to detect outliers among geographically close or distant populations.
Evolutionarily, many rare variants have occurred in recent human history; therefore they are expected to be population specific and to show greater population diver-sity than common variants [6,7]. Based on this hypoth-esis, one might expect rare functional variants to provide better predictive accuracy than common variants. Our result do not support this hypothesis, and using the same numbers of informative SNPs (such as 20), we found that the predictive accuracy for ancestral membership was 13% for rare variants and 52% for common variants. Thus fewer informative markers are required to assign individuals to their ancestral origin when we use com-mon functional variants rather than rare functional
variants. The confounding effect of high within-popula-tion diversity on allele frequencies in rare variants might have altered the results [8]. Thus it is critical to under-stand the population structure in a given sample set and to account for it before performing association analyses with other factors.
Our population classification using common functional variants performed similarly to studies using nonfunc-tional variants (data not shown), such that the first PC separated African populations and the second PC sepa-rated European-descent populations. Furthermore, within the African cluster there was more variability, which reflects the greater genetic diversity in samples of African origin [9]. Overall, the Luhya and Yoruba African samples, the U.S. and Tuscan European samples, and the Han Chi-nese, Denver ChiChi-nese, and Japanese Asian samples showed
Figure 3Predictive accuracy of common versus rare functional variants based on PC1 or PC2.
within-population clustering based on PC1 and PC2. These findings (common functional variants) appear to agree with Malécot’s isolation-by-distance model, which predicts that genetic similarity between populations will decrease exponentially as the geographic distance between them increases [10]. Examination of the isolation-by-dis-tance model with rare functional variants showed that rare functional variants do not fit Malécot’s model; rather, they follow clinal trends as a result of the subtle signal of genetic diversity. Clines in allele frequencies may be the consequence of adaptation along an environmental gradi-ent [11] or of genetic admixture occurring in secondary contact zones. Africans and U.S. Caucasians began to get close to 100% correct assignment when only 200 SNP loci were used, whereas Han Chinese and Japanese required 400 SNP loci. This is shown by the much shorter branch length for the Han Chinese/Japanese separation compared with the branch length of the U.S. Caucasian/Yoruba separation [12].
In summary, by restricting our analysis to each variant type independently instead of using global average esti-mates, we have reported for the first time that the optimal number of subpopulations is variant dependent. The varia-tion in the number of PCs needed to account for popula-tion variapopula-tion might indicate the detecpopula-tion of populapopula-tion structure that would have been missed if only common variants had been used. Thus correction for population structure is only as good as the type of variants chosen and the level of structure (finer or coarser) one wishes to correct. For example, if one wants to discriminate less dif-ferentiated groups, such as Denver Chinese from Han Chi-nese, one might need to pick additional markers that are known to exist in both populations but that vary in fre-quency. Future studies using the entire 1000 Genomes Project and other data sets will be needed to further explore how much of an estimate of ancestry is good enough to assign an individual to his or her founder popu-lation and to account for popupopu-lation structure as well as to confirm our findings.
Acknowledgments
This work was supported by National Institutes of Health (NIH) grants K01 HL103165, K12 HD001097-14, R01 NS036695, K24 HL69712, and U19 A1070235. The Genetic Analysis Workshops are supported by NIH grant R01 GM031575 from the National Institute of General Medical Sciences. We would like to thank the anonymous reviewers for their constructive comments.
This article has been published as part ofBMC ProceedingsVolume 5 Supplement 9, 2011: Genetic Analysis Workshop 17. The full contents of the supplement are available online at http://www.biomedcentral.com/1753-6561/5?issue=S9.
Author details
1Division of Asthma Research, Cincinnati Children’s Hospital Medical Center,
3333 Burnet Avenue, Cincinnati, OH 45229, USA.2Department of Pediatrics, University of Cincinnati College of Medicine, 3333 Burnet Avenue, Cincinnati, OH 45229, USA.3Division of Biostatistics and Epidemiology, Cincinnati
Children’s Hospital Medical Center, 3333 Burnet Avenue, Cincinnati, OH 45229, USA.4Division of Physical Medicine and Rehabilitation, Cincinnati Children’s Hospital Medical Center, 3333 Burnet Avenue, Cincinnati, OH 45229, USA.5Division of Human Genetics, Cincinnati Children’s Hospital Medical Center, 3333 Burnet Avenue, Cincinnati, OH 45229, USA.
Authors’contributions
TMB conceived and wrote the manuscript. HH helped in statistical analysis. LJM, LD, XZ, and BGK helped with the writing of the manuscript. All authors read and approved the final manuscript.
Competing interests
All authors declare no competing interest in relation to their work.
Published: 29 November 2011
References
1. Steinmetz LM, Mindrinos M, Oefner PJ:Combining genome sequences and new technologies dissecting the genetics of complex phenotypes.
Tr Plant Sci2000,5:397-401.
2. Kalinowski S:Genetic polymorphism and mixed-stock fisheries analysis.
Can J Fish Aquat Sci2004,61:1075-1082.
3. 1000 Genomes Project Consortium, Durbin RM, Abecasis GR, Altshuler DL, Auton A, Brooks LD, Durbin RM, Gibbs RA, Hurles ME, McVean GA:A map of human genome variation from population-scale sequencing.Nature 2010,467:1061-1073.
4. Krzanowsky W:Principles of Multivariate Analysis.New York, Oxford University Press; 2003.
5. Pritchard JK, Stephens M, Donnelly P:Inference of population structure using multilocus genotype data.Genetics2000,155:945-959. 6. Baye TM, Wilke RA, Olivier M:Genomic and geographic distribution of
private SNPs and pathways in human populations.Per Med2009,
6:623-641.
7. Li B, Leal SM:Methods for detecting associations with rare variants for common diseases: application to analysis of sequence data.Am J Hum Genet2008,83:311-321.
8. Chikhi L, Sousa VC, Luisi P, Goossens B, Beaumont MA:The confounding effects of population structure, genetic diversity, and the sampling scheme on the detection and quantification of population size changes.
Genetics2010,186:983-995.
9. Campbell MC, Tishkoff SA:African genetic diversity: implications for human demographic history, modern human origins, and complex disease mapping.Annu Rev Genomics Hum Genet2008,9:403-433. 10. Harpending H, Ward R:Chemical Systematics and Human Populations:
Biochemical Aspects of Evolutionary Biology.Chicago, University of Chicago Press; 1981.
11. Berry A, Kreitman M:Molecular analysis of an allozyme cline: alcohol dehydrogenase inDrosophilamelanogaster on the east coast of North America.Genetics1993,134:869-893.
12. Baye TM:Inter-chromosomal variation in the pattern of human population genetic structure.Hum Genomics2011,5:220-240.
doi:10.1186/1753-6561-5-S9-S8