P R O C E E D I N G S
Open Access
Addition of multiple rare SNPs to known
common variants improves the association
between disease and gene in the Genetic
Analysis Workshop 17 data
Jenna Sykes
1, Lu Cheng
1, Wei Xu
1,2, Ming-Sound Tsao
3, Geoffrey Liu
2,4, Melania Pintilie
1,2*From
Genetic Analysis Workshop 17
Boston, MA, USA. 13-16 October 2010
Abstract
The upcoming release of new whole-genome genotyping technologies will shed new light on whether there is an associative effect of previously immeasurable rare variants on incidence of disease. For Genetic Analysis Workshop 17, our team focused on a statistical method to detect associations between gene-based multiple rare variants and disease status. We added a combination of rare SNPs to a common variant shown to have an influence on disease status. This method provides us with an enhanced ability to detect the effect of these rare variants, which,
modeled alone, would normally be undetectable. Adjusting for significant clinical parameters, several genes were found to have multiple rare variants that were significantly associated with disease outcome.
Background
Recent technological advances have made querying the importance of genetic factors on the occurrence of dis-ease severity possible. Hundreds of published studies have acknowledged associations between certain genes and various medical conditions. Newer advances in gen-otyping technology have allowed researchers to deter-mine even more precisely which genetic base pair may be a marker for the mutation responsible for causing a disease by looking at single-nucleotide polymorphisms (SNPs). SNPs are DNA sequence variations that occur when a single nucleotide (A, T, C, or G) in the genome is altered. Each individual has many SNPs that together create the unique human DNA pattern [1]. These base differences usually have a minor allele frequency (MAF) of 1% or more; SNPs with MAFs less than 1% are known as rare [2]. Previously, because of the popular common disease/common variant hypothesis, which assumes that common diseases are caused by common
variants with small to modest effects [3], and because of the lack of proper technology to accurately genotype rare variants, most association studies have focused on common variants. The near complete 1000 Genomes Project will allow for more accurate genotyping of the so-called rare variants and, as a result, for consideration of rare variants as possible causes of disease [4].
A change in thought has occurred to increase the importance of rare variants in disease susceptibility [5]. Although several common SNPs have shown significant associations with diseases, these effect sizes have always been small, contributing to the idea that there must be some causal factor in the previously undiscovered rare variants [5]. Several known genetic diseases, such as schizophrenia and type 2 diabetes, have turned up only a few links in the form of the common variants, and it is now thought that common variants could be picking up a diluted signal that is instead caused by neighboring rare variants [5]. Few statistical methods exist for ana-lyzing the role of rare variants, with most methods resulting in low power [3], and it is imperative to develop new methods to analyze these data. Because the Genetic Analysis Workshop 17 (GAW17) data set is
* Correspondence: [email protected] 1
Department of Biostatistics, Princess Margaret Hospital, 610 University Avenue, Toronto, ON M5G 2M9, Canada
Full list of author information is available at the end of the article
dominated by rare variants (about 74%), the goal of this study is to investigate the potential for combinations of rare variants to strengthen the association between com-mon variants and disease.
Methods
The GAW17 data set consists of 24,487 SNPs on 22 chromosomes for 697 unrelated individuals. Thirty per-cent of the individuals are known to be affected with the disease, and individual quantitative and binary dis-ease traits, Age, Sex, and Smoking status were simulated 200 times. The underlying simulation model is pre-sented by Almasy et al. [6]. We had no knowledge of the genes simulated to be associated with disease out-come when developing and testing our method.
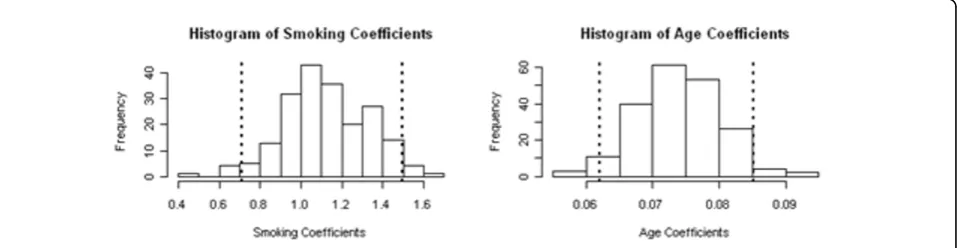
We chose significant clinical parameters by fitting a multivariate logistic regression model with all the possi-ble covariates (Age, Sex, Smoking status, and Ethnicity) and performing backwards selection. Significance was determined by calculating the 95% percentile intervals based on the 200 replicates and choosing only those covariates for which the percentile interval did not include 0.
We first tested for Hardy-Weinberg equilibrium (HWE) in both affected and unaffected populations over all 200 phenotype replicates [7]. An adjustedp-value of 10−5was used to correct for multiple testing in light of the fact that many of the SNPs are correlated. Those SNPs that failed the HWE test in both subpopulations in at least 95% of the replicates were eliminated from further analysis because these SNPs were thought to be privy to genotyping errors.
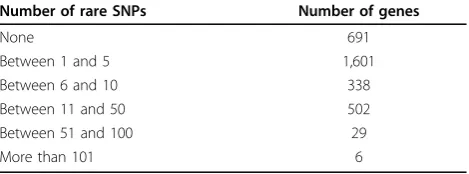
Because the frequency of each of the rare variants in this data set is so low (40% of the SNPs have only a sin-gle copy of the minor allele out of the 697 observations), attempting to model the relationship between each rare SNP and the disease outcome is not feasible. Even attempting to combine all the rare SNPs within a gene would not be possible because few genes have a large number of rare SNPs (Table 1). Under these conditions, the models would fail to converge in many of the phe-notypes. Therefore we decided to test combinations of multiple rare variants with one common variant in a gene. Our interest lies in identifying groups of rare
SNPs that will better predict the disease when added to the common SNP than in simply identifying the com-mon SNP alone.
For each geneg, we consider common SNPscj(j= 1,…,
ngc) and rare SNPsrs(s= 1,…,ngr), wherengcandngrare
the number of common and rare SNPs on geneg, respec-tively. For all SNPs, we assume a dominant model in which a SNP is coded 1 when a minor allele is present and 0 otherwise. Because of the low frequency of rare SNPs, we thought that the dominant model would provide the best power.
For eachcjon geneg, we fit the following multivariate logistic regression model on phenotypek(k= 1,…, 200):
log , , ,( ) ,( variable representing the presence of the minor allele in common SNP cj.. The 200 coefficientsb1,1, …,b1,200are
recorded.
We create a new indicator variable z to measure the presence of rare variants within a gene:
z=1m>0, m= +r1 +rng r. (3)
By narrowing the search to only those common var-iants that show reproducibility over the 200 replicates at the 0.1 significance level (which would imply more stable coefficient estimates), we then fit a new multivari-ate logistic regression model with a binary indicator variable that represents the presence or absence of any minor allele within the gene:
log , , ( ) ,(
We use the binary approach to increase the power to detect an association resulting from the low frequency of the minor alleles. We then compare the 200 coeffi-cients g1,1, …, g1,200 by means of a one-sided paired t test to b1,1,…, b1,200to ascertain whether there is a
consistent departure from the null hypothesis that:
b1,k ≥ g1,k ∀k. (5)
If p< 0.05, then adding the rare variants to the com-mon variant significantly increases the signal of the effect of the gene on disease. Therefore these rare var-iants must be associated with the disease.
Table 1 Breakdown of number of rare SNPs per gene
Number of rare SNPs Number of genes
None 691
Between 1 and 5 1,601
Between 6 and 10 338
Between 11 and 50 502
Between 51 and 100 29
If no associations are found, we remove one rare SNP from the definition of Eq. (3) and recalculate the coeffi-cients from Eq. (4) as before. This method is used to determine whether or not no association was detected because of too much noise resulting from the addition of too many rare variants. This method can be general-ized through an iterative process by removing one rare SNP at a time until only a single rare SNP remains.
Results
The initial set of 24,487 SNPs was reduced to 24,211 because 276 SNPs failed the HWE assumption. Ethnicity was categorized into three dummy variables representing individuals of African, Asian, and European descent. The covariates Age and Smoking status were established as the only clinical parameters for this data set (Figure 1). Any associations between SNPs and disease status were adjusted for these two covariates.
After HWE elimination, we were left with 3,167 genes over the 22 chromosomes. Of these 3,167 genes, 1,718 did not have any common variants or had less than two rare variants and so were excluded from the analysis because this is our primary interest. To elimi-nate the possibility of adding too much noise by creat-ing a combination of many rare SNPs, we further restricted the analysis to those genes that contained fewer than 16 rare SNPs. Thus we were left with 829 genes to explore.
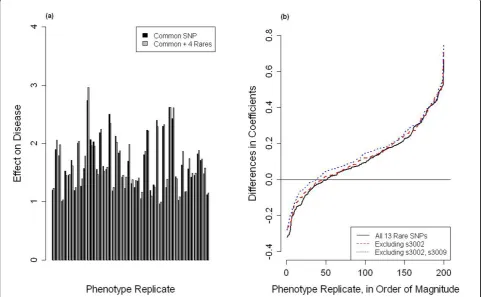
Our results show that adding multiple rare variants to common SNPs already associated with disease at the 0.1 significance level can greatly improve the ability to detect causes of disease (Table 2). We calculatedp-values from a one-sided paired t test to compare the 200 b coeffi-cients to the 200 g coefficients and used a p-value of 0.001 to determine significance [8]. For several of the genes, the signal of association became even stronger with the removal of one or two rare SNPs (Figure 2). In some cases, we discovered that larger combinations of rare SNPs were actually more significant, indicating that
an optimal combination of rare and common SNPs could be found with this method (Table 2).
When one or two rare SNPs were removed from the definition of Eq. (3), some genes that had not been iden-tified by our first pass displayed an increased effect on disease (Table 2, last three rows). This suggests that adding the combination of rare SNPs to a common SNP adds information to the model and helps to better explain the relationship between gene and disease.
Discussion and conclusions
By taking advantage of all 200 phenotype replicates, we were able to simulate a posterior distribution for the underlying true relationship between genes and disease status, thereby inherently validating our method. When working with real data, investigators will not be able to use the replications to calculate p-values. Therefore we can apply the sample randomization technique outlined by Guo et al. [9]. This method has the following steps: (1) Calculate the coefficient for each common variant in each gene from a logistic regression model; (2) shuffle the common SNPs across the genome to generate a per-muted data set; (3) calculate the coefficient from a logis-tic regression between common variant and disease; (4) repeat steps 2 and 3 1,000 times to obtain a null distri-bution of coefficients; and (5) determine which common variants are significant (ata = 0.1) by calculating the percentage of coefficients from the null distribution that are greater than the observed coefficient. This percen-tage is our p-value. Finally, adding all the rare SNPs to the common variant, we repeat steps 1–5 to determine which rare SNPs significantly improve the association from the common variant alone.
Although our study focused on binary disease outcome, our method can also be applied to continuous or time-to-event outcomes. The dominant model assumption for the SNPs could also be adjusted to use additive or reces-sive models. Our method improves on the collapsing method introduced by Li and Leal [3] by separately
considering common variants shown to have disease influence and by adjusting for other factors.
In the interest of time and computational abilities, we limited our analysis to those genes with less than 16 rare SNPs. Important associations may occur in genes
with greater than 16 SNPs. In the future it may also be of interest to consider separately those SNPs that are synonymous and nonsynonymous or to include rare SNPs that fall just outside a gene in a larger genomic region in, say, a pathway-based analysis. Our analysis
Table 2 Adding a combination of rare SNPs to a common SNP significantly increases the signal of association with disease
Gene Common SNP Number of rare SNPs p-value SNP(s) removed p-value
MAP3K6 C1S1886 4 2.13 × 10⁻⁸ C1S18877 2.13 × 10⁻⁸
PTK2B C8S911 9 1.08 × 10⁻⁷ C8S936 2.9 × 10⁻³
C8S900 5.12 × 10⁻⁹ C8S900, C8S908 8.93 × 10⁻¹⁰
ETV6 C12S860 2 5.53 × 10⁻⁷ C12S863 3 × 10⁻⁴
C12S861 6 × 10⁻⁴
BRCA1 C17S2996 13 1.54 × 10⁻¹⁶ C17S3009 1.97 × 10⁻²¹
C17S3002, C17S3009 1.01 × 10⁻²⁵
BRCA1 C17S3006 13 4.45 × 10⁻¹¹ C17S3002 2.88 × 10⁻¹⁴
BRCA1 C17S3010 13 7.27 × 10⁻¹⁰ C17S3002 6.73 × 10⁻¹³
BRCA1 C17S3014 13 5.33 × 10⁻⁹ C17S3002 5.04 × 10⁻¹²
BRCA1 C17S3016 13 1.31 × 10⁻¹⁰ C17S3009 8.75 × 10⁻¹⁵
LOC645118 C19S2844 1 NS C19S2846 9 × 10⁻⁴
TNK1 C17S511 3 NS C17S515, C17S521 4.78 × 10⁻⁵
VNN1 C6S5380 4 NS C6S5377, C6S5379 1.5 × 10⁻⁴
Removing one or two rare SNPs can make this association even stronger. NS, not significant at the 0.001 significance level.
was stopped before considering a maximum removal of two rare SNPs from the combination of all rare SNPs in one gene. A more exhaustive search could uncover new relationships. Our intention was to conduct a proof of principle analysis to exhibit the merits of this method in finding rare SNPs associated with disease.
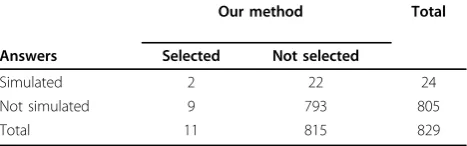
After the GAW17 conference, we compared the per-formance of our method to the simulated answers. For the correctly identified gene PTK2B, removal of simu-lated SNP C8S900 actually improved the disease associa-tion. This could be a result of high correlation with the other simulated SNPs for that gene. Table 3 shows that our method detected a large number of false positives and yielded a sensitivity of only 8.3%. However, our method had quite a high specificity rate of 98.5%. It must be noted that underlying correlation could create hidden relationships not specified in the simulated model.
Acknowledgments
We would like to thank the organizers of Genetic Analysis Workshop 17 for supplying the data and the Ontario Institute for Cancer Research for funding the internship program. The Genetic Analysis Workshops are supported by National Institutes of Health grant R01 GM031575.
This article has been published as part ofBMC ProceedingsVolume 5 Supplement 9, 2011: Genetic Analysis Workshop 17. The full contents of the supplement are available online at http://www.biomedcentral.com/1753-6561/5?issue=S9.
Author details
1
Department of Biostatistics, Princess Margaret Hospital, 610 University Avenue, Toronto, ON M5G 2M9, Canada.2Dalla Lana School of Public Health, University of Toronto, 155 College Street, Toronto, ON M5T 3M7, Canada. 3Laboratory of Medicine and Pathobiology, Princess Margaret Hospital, 610 University Avenue, Toronto, ON M5G 2M9, Canada.4Division of Molecular Genomics, Princess Margaret Hospital, 610 University Avenue, Toronto, ON M5G 2M9, Canada.
Authors’contributions
JS performed and interpreted the statistical analysis and drafted the manuscript. WX, GL and LC acted as advisors on the design of the statistical analysis. MP participated in the planning of the analysis and structuring of the paper. All authors read and approved the final manuscript.
Competing interests
The authors declare that there are no competing interests.
Published: 29 November 2011
References
1. Holmgren Lab:Single nucleotide polymorphism (SNP).[http://groups. molbiosci.northwestern.edu/holmgren/Glossary/Definitions/Def-S/SNP.html]. 2. Brookes AJ:The essence of SNPs.Gene1999,234:177-186.
3. Li B, Leal SM:Methods for detecting associations with rare variants for common diseases: application to analysis of sequence data.Am J Hum
Genet2008,83:311-321.
4. Morris A, Zeggini E:An evaluation of statistical approaches to rare variant analysis in genetic association studies.Genet Epidemiol2010,34:188-193. 5. Cirulli ET, Goldstein D:Uncovering the roles of rare variants in common disease through whole-genome sequencing.Nat Rev2010,11:415-425. 6. Almasy LA, Dyer TD, Peralta JM, Kent JW Jr., Charlesworth JC, Curran JE,
Blangero J:Genetic Analysis Workshop 17 mini-exome simulation.BMC Proc2011,5(suppl 9):S2.
7. Wittke-Thompson JK, Pluzhnikov A, Cox NJ:Rational inferences about departures from Hardy-Weinberg equilibrium.Am J Hum Genet2005,
76:967-986.
8. Simon R, Korn EL, McShane LM, Radmacher MD, Wright GW, Zhao Y:
Design and analysis of DNA microarray investigations.New York, Springer; 2003.
9. Guo YF, Li J, Chen Y, Zhang LS, Deng HW:A new permutation strategy of pathway-based approach for genome-wide association study.BMC
Bioinform2009,10:429.
doi:10.1186/1753-6561-5-S9-S97
Cite this article as:Sykeset al.:Addition of multiple rare SNPs to known common variants improves the association between disease and gene in the Genetic Analysis Workshop 17 data.BMC Proceedings20115(Suppl 9):S97.
Submit your next manuscript to BioMed Central and take full advantage of:
• Convenient online submission
• Thorough peer review
• No space constraints or color figure charges
• Immediate publication on acceptance
• Inclusion in PubMed, CAS, Scopus and Google Scholar
• Research which is freely available for redistribution
Submit your manuscript at www.biomedcentral.com/submit Table 3 Gene-based comparison of our method with
simulated answers
Our method Total
Answers Selected Not selected
Simulated 2 22 24
Not simulated 9 793 805