International Journal of Advanced Research in Computer Science
(ISSN: 0976-5697)RESEARCH PAPER
Available Online at www.ijarcs.info
Conference Paper: International Conference on “Recent Advances in Computing and Communication”
Organized by: Department of Computer Science, SSS Shasun Jain College for Women, Chennai, India 5
ISBN: 978-93-5300-455-2
IRIS IMAGE PREPROCESSING AND COMPRESSION FOR HIGHLY SECURED
AUTHENTICATION
Rajapriya C.
Asst. Prof, department of computer science
Sri Muthukumaran Arts and Science College, Mangadu, Chennai, India
ABSTRACT
The authentication of humans the use of iris-based popularity is an extensively growing era. Iris popularity is feasible to be used in differentiating between same twins. Even though the iris coloration and the overall statistical first-class of the iris texture may be depending on genetic factors, the textural information are independent and uncorrelated for genetically same iris pairs. The function extraction and class are heavily primarily based on the rich textural details of the iris. With the need for protection structures going up, Iris authentication is rising as one of the essential techniques of biometrics-based totally identity structures. This undertaking essentially explains the Iris popularity device advanced through Daugman and tries to put in force this set of rules, with some modifications. Firstly, image preprocessing is completed followed by way of extracting the iris portion of the attention image. The extracted iris element is then normalized, and iris is constructed the use of 1D Gabor filters. Later iris and pupil are as compared to find the Hamming Distance that is a fractional measure of the dissimilarity.
Keywords: Preprocessing, Normalization, Gabor Filter, Hamming Distance, Pupil, Iris
INTRODUCTION
Biometrics refers to the identification and verification of human identity based on certain physiological developments of someone. The typically used biometric capabilities include speech, fingerprint, face, handwriting, gait, hand geometry etc. The face and speech strategies were used for over 25 years, even as iris method is a newly emergent approach. The iris is the colored part of the eye in the back of the eyelids, and in the front of the lens. It’s miles the only inner organ of the body that is commonly externally visible. Those seen patterns are specific to all individuals and it has been observed that the opportunity of finding people with same iris patterns is almost 0. Although there lies a hassle in taking pictures the image, the splendid sample variability and the stableness over the years, makes this a dependable safety recognition machine.
An iris-based totally biometric identity scheme involves studying capabilities that are discovered within the tissues that surrounds the student. complicated iris patterns can comprise many one-of-a-kind functions together with ridges, crypts, jewelry, and freckles[1]. Iris scanning makes use of a reasonably conventional camera and requires no close contact between the issue and the reader. The iris
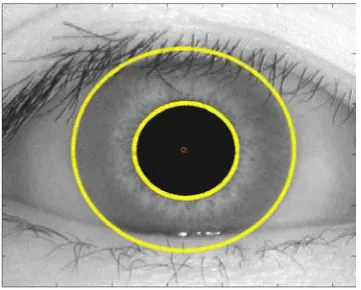
Figure 1 : Image of the eye
Iris Preprocessing
[image:2.595.35.217.346.490.2]Image enhancementis the process of adjusting digital image so that the results are most suitable for display.It is used to improve the quality of the image. The Adaptive Mean Adjustment[2]is used to enhance the image.Adaptive Mean Adjustment[2] is a computer image processing technique used to improve contrast in images. It modifies the allocation of the pixels to become more consistently increase out more than the obtainable pixel variety. In histogram dealing out, a histogram displays the sharing of the pixel intensity values. Dark image will have low pixel values whereas a bright image will have high pixel values.
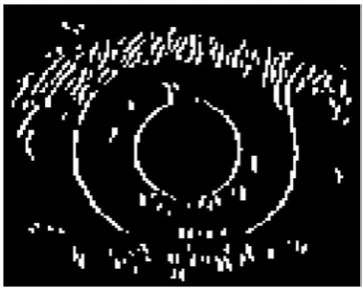
Figure 2: Canny edge detection
CLAHE[2] formula is given by,
CLAHE = X(I,j)-Xmin(I,j)/Xmax(I,j)- Xmin(I,j)
Where ,X is the image,Xmin-Minima of the image,Xmax-maxima of the image.
The main aim of the image enhancement is to improve the contrast and brightness of the image in order to improve the quality of the image.
The image is considered as a function z=f(x,y), it is an 2D matrix.
Where z is the gray level of the image.
f(x,y) = a1*x +a2*y + a3 +e(x,y), --(2)
Calculate the values a1, a2, a3, i.e.
a
ˆ
1,a
ˆ
2,a
ˆ
3,We have to reduce the sum of square of residuals at each pixel,
2 2
)]
,
(
3
ˆ
*
2
ˆ
*
1
ˆ
[
a
x
a
y
a
f
x
y
S
x y
−
+
+
=
∑∑
, (3)It gives
(5)
)
3
/(
2
/
]
)
2
2
ˆ
(
)
1
1
ˆ
[(
2 2 2 2 2−
−
+
−
=
∑∑
∑∑
n
S
y
a
a
x
a
a
F
x y x ya
ˆ
1,a
ˆ
2,a
ˆ
3 by,
)
,
(
*
1
ˆ
2∑∑
∑∑
=
x y x yx
y
x
f
x
a
,
)
,
(
*
2
ˆ
2∑∑
∑∑
=
x y x yy
y
x
f
y
a
.
1
)
,
(
3
ˆ
∑∑
∑∑
=
x y x yy
x
f
a
(4)Thus,
F has an F distribution with 2,n-3 degree of freedom.
When considering 3*3 window, n-3= 6.
Now we derive the following. Change f(x,y) by equation (2) ,
Ie).,
a1*x +a2*y + a3 + e(x,y) ,
,
)
,
(
*
1
1
ˆ
2∑∑
∑∑
+
=
x y x yx
y
x
e
x
a
a
,
)
,
(
*
2
2
ˆ
2∑∑
∑∑
+
=
x y x yy
y
x
e
y
a
a
.
1
)
,
(
3
3
ˆ
∑∑
∑∑
+
=
x y x yy
x
e
a
a
(6)From above equation and noise equation, it drives variances of
a
ˆ
1,a
ˆ
2,a
ˆ
3
,
2 2 2 1 ˆ∑∑
=
x y ax
σ
σ
,
2 2 2 2 ˆ∑∑
=
x y ax
σ
σ
,
2 2 2 3 ˆ∑∑
=
x y ax
σ
σ
(7)the covariance is 0, nN
Conference Paper: International Conference on “Recent Advances in Computing and Communication”
Organized by: Department of Computer Science, SSS Shasun Jain College for Women, Chennai, India 7
∑∑
−
−
∑∑
−
−
∑∑
−
−
∑∑
=
x y x y x y x y
a
a
y
a
a
x
a
a
y
x
e
S
2 2(
,
)
(
ˆ
1
1
)
2 2(
ˆ
2
2
)
2 2(
ˆ
3
3
)
2.1
(8)
Now e(x,y) ~ N(0),
,
~
)
,
(
2 n 2 2χ
σ
∑∑
x yy
x
e
(9)The
χ
n2 for the chi-squared distribution with n degrees of freedom, n can be calculated as,n=
∑∑
x y
1
. (10)Because e(x,y) is a normal distribution function, based on the equation (6),
a
ˆ
1,a
ˆ
2,a
ˆ
3 gives the normal distribution :a
ˆ
1~ N(a1,σ
a2ˆ1),a
ˆ
2~ N(a2,σ
a2ˆ2),a
ˆ
3~ N(a3,σ
a2ˆ3), (11) with the variance given in equation (23), so~
)
1
1
ˆ
(
)
1
1
ˆ
(
2 2 2 2 1 ˆ 2σ
σ
∑∑
−
=
−
x ya
x
a
a
a
a
2 1χ
,~
)
2
2
ˆ
(
)
2
2
ˆ
(
2 2 2 2 2 ˆ 2σ
σ
∑∑
−
=
−
x ya
y
a
a
a
a
2 1χ
,~
1
)
3
3
ˆ
(
)
3
3
ˆ
(
2 2 2 1 ˆ 2σ
σ
∑∑
−
=
−
x ya
a
a
a
a
2 1χ
. (12)Following the equations (9), (10), (12) ,
2 2
σ
S
~
χ
(n2-3), (13)U~
χ
2j , V ~χ
k2, thenk. j,
F
~
/
/
k
V
j
U
3. -n 2, 2 2 2 2 2F
~
)
3
/(
2
/
]
)
2
2
ˆ
(
)
1
1
ˆ
[(
−
−
+
−
∑∑
∑∑
n
S
y
a
a
x
a
a
x y x y (14)DN (Digital number)
Estimate the Digital Number (DN) as
DN = WF * RV + (1-WF) * DN(old), (15)
RV - > Reference value for the pixels
WF - > Weight vector
WF = max (WF1, WF2) (16)
The contrast of the image is calculated as follows,
(Image contrast enhancement)
)
min(
)
max(
)
min(
)
max(
image
DN
image
DN
window
DN
window
DN
WCON
−
−
=
(17) Iris LocalizationDue to computational ease, the image became scaled down via 60%. The picture became filtered the usage of Gaussian clear out, which blurs the image and reduces outcomes because of noise. The diploma of smoothening is determined by using the same old deviation, σ and it is taken to be 2 in this example.
[image:3.595.315.496.273.418.2]The part of the attention sporting data is handiest the iris part. It lies among the sclera and the student. Consequently the subsequent step is isolating the iris component from the eye image. The iris internal and outer barriers are positioned with the aid of locating the brink picture the use of the canny facet detector.
Figure 3: Image with boundaries
The Canny detector mainly entails 3 steps, viz. finding the gradient, non-most suppression and the hysterisis thresholding. As proposed by means of Wildes, the thresholding for the attention picture is finished in a vertical path simplest, in order that the have an impact on due to the eyelids can be reduced. This reduces the pixels at the circle boundary, however with using Hough rework, successful localization of the boundary can be received even with the absence of few pixels. it's also computationally quicker since the boundary pixels are lesser for calculation.
The use of the gradient picture, the peaks are localized the use of non-maximum suppression. it really works inside the following manner. For a pixel imgrad(x,y), within the gradient image, and given the orientation theta(x,y), the brink intersects two of its eight related buddies. The factor at (x,y) is a maximum if its cost is not smaller than the values at the 2 intersection points.
circular side detector by means of searching the gradient image alongside the boundary of circles of growing radii. From the probability of all circles, the maximum sum is calculated and is used to discover the circle facilities and radii.
The Hough remodel is some other way of detecting the parameters of geometric items, and in this case, has been used to find the circles inside the part image. For each part pixel, the points at the circles surrounding it at extraordinary radii are taken, and their weights are expanded if they're edge factors too, and these weights are introduced to the accumulator array. Thus, in any case radii and area pixels were searched; the most from the accumulator array is used to locate the center of the circle and its radius. The Hough remodel is carried out for the iris outer boundary using the whole image, and then is performed for the scholar simplest, instead of the entire eye, due to the fact the student is usually in the iris.
There are a few issues with the Hough transform. First of all, the brink values are to be discovered by trial. Secondly, it is computationally intensive. This is improved by means of just having 8-manner symmetric factors at the circle for every search factor and radius. The eyelashes have been separated through thresholding, and people pixels have been marked as noisy pixels, considering they do no longer include within the iris.
Iris Normalization
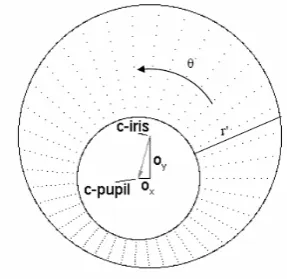
[image:4.595.315.467.60.167.2]As soon as the iris place is segmented, the next degree is to normalize this component, to allow technology of the iris and their comparisons. By Considering the fact that versions in the attention, like optical size of the iris, position of student within the iris, and the iris orientation trade man or woman to individual, it's far required to normalize the iris photograph, so that the representation is not unusual to all, with comparable dimensions. Normalization manner involves un-wrapping the iris and changing it into its polar equal. it's far done the use of Daugman’s Rubber sheet model. The center of the pupil is considered as the reference point and a remapping formula is used to transform the points on the Cartesian scale to the polar scale.
[image:4.595.314.507.121.278.2]Figure 4: Normalization process
Figure 6: Normalized iris image
Figure 5: Unwrapping the iris
Encoding
The final technique is the generation of the iris. For this, the maximum discriminating feature in the iris pattern is extracted. The phase facts inside the pattern handiest is used because the segment angles are assigned irrespective of the photograph comparison. Amplitude records are not used since it depends on extraneous elements. Extraction of the segment information, in line with Daugman, is carried out the use of second Gabor wavelets. It determines which quadrant the resulting pharos lies the use of the wavelet:
where, has the actual and imaginary part, every
having the fee 1 or 0, depending on which quadrant it lies in.
A simpler manner of using the Gabor filter out is via breaking up the 2nd normalized pattern into some of 1D wavelets, and then those indicators are convolved with 1D Gabor wavelets.
Gabor filters are used to extract localized frequency records. However, due to some of its barriers, log-Gabor filters are extra broadly used for coding natural photographs. It become suggested by discipline, that the log filters (which use Gaussian transfer features regarded on a logarithmic scale) can code herbal pix higher than Gabor filters (viewed on a linear scale). Information of herbal iris implies the presence of high-frequency additives. Because the regular Gabor filters beneath-represent high frequency additives, the log filters grow to be a better desire. Log Gabor filters are constructed using
[image:4.595.37.181.558.697.2]Conference Paper: International Conference on “Recent Advances in Computing and Communication”
Organized by: Department of Computer Science, SSS Shasun Jain College for Women, Chennai, India 9
Kovesi was used. It outputs a cellular containing the complex valued convolution consequences, of the same length as the enter image.
Iris Image compression
The three colour RGB model is not suited for image processing purpose. To compress the image, the luminance-chrominance values are taken due to the higher value than the RGB colour format. Consequently, RGB 2D data are transformed to one of the luminance-chrominance models, despite the fact that acting the compression method and then transform the 2D signals returned to RGB version because the displays are most usually presents output 2D signals with direct RGB model [3]. The chrominance components represent the colour information in the images [6]. To provide such quality transmission, wireless is more convenient, but is not perfect. There is limitation as well as difficulties such as bandwidth, signal attenuation, co-channel interferences, and time varying channel too. Consequently, the quality of the transmitted images gets degraded [5]. The acquired sign inside the wireless verbal exchange channel is characterised through the joint impact of the two impartial techniques small scale fading because of the contemplated and scattered sign or else due to the shadowing from diverse barriers inside the propagation direction. numerous form of statistical fashions are evolved to examine the result of noising and shadowing separately, but noising and shadowing occurs simultaneously, it is important to convey complex illustration that would be used to model their results simultaneously.
Shannon’s Nyquist sampling theorem derives that a data must be sampled at a higher data than double the maxima frequency of the data for reliability of signal reconstruction. For maximum bandwidth images, such as image, the needed sampling rate is very high. Some small coefficients of the transforms like DCT and DWT coefficients less coefficients can be deleted with small Impact the quality of the data significantly. The above basic theory is used in all image compression algorithms [9]. The algorithm of Compression Sensing (CS) is to obtain important information directly without first sampling the data in the old sense. It is shown that if the data is “sparse” of compressible, then they obtained data is enough to recreate the original data with high possibility. The Sparsity is denoted with respect to a suitable source, such as DCT or DWT for the given data [10]. The concept of the CS is also acquired dimension of the data through a development that is incoherent with the data. In CS, a sensing method should give a enough number of CS capacity in a
non-adaptive way, so that enable by great reconstruction In the figure 1,
the image shows that RGB colour space that the image can be compressed using CS technique to transmit the data through the OFDM transceiver [11].
According to CS technique 3 major steps for CS application:
a) Sparse symbol of the data.
b) Design MxNdimension matrix unconnected to transform root to
calculate the data and expand M - dimensional quantity vector.
c) Reconstruction the data by -dimensional quantity vector.
The principle of CS can be described as below:
The following notation as we have
be real- magnitude
samples of a data, which can be correspond to by the transform coefficients, . That is,
(1)
where is an ×
transform source matrix, which resolve the field where the signal is
sparse and too is an
-measurement vector of coefficients with
We presume that is S sparse, sense
that 3 are only important fundamentals in with S<<N .
STD-BCS-SPL ALGORITHM
The STD-BCS-SPL (Standard Bi-directional Compressive Sensing
special) algorithm is based on the concept of the wavelet transform.
[image:5.595.321.561.136.264.2] [image:5.595.316.526.379.517.2]It restricts the necessity of the arbitrary access of the whole image to small sub images. The STD-BCS-SPL algorithm will work in the principle of partial ordering by the magnitude with a set partitioning sorting method [10].
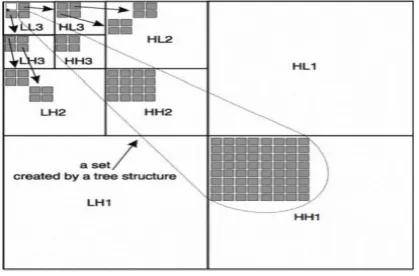
Fig.2: Wavelet sub-bands in STD-BCS-SPL.
The figure above shows a spatial orientation tree and parent-children contribution which is defined by the STD-BCS-SPL algorithm in all the sub-bands in wavelet image. The tree is defined in the way that of each and every node has either no offspring or four offspring at the same spatial location in the four sub-band level. The 2D signalsels which are in the lowest frequency sub-band tree roots grouped into the blocks 2 adjacent 2D signalsel and in each of the block one of the block is marked by star as shown in fig. The STD-BCS-SPL can also describe this type of collocation with one to four parent-children relationships.
SOURCE CODING
STD-BCS-SPL algorithm is used for source coding of a full image. It is used for image compression and wavelet decomposition.
Image decomposition: The proposed method first decomposes a data into coefficients called sub-bands after which the consequent coefficients are evaluated with a threshold. Coefficients beneath the edge are set to zero. The coefficients over the edge worth are encoded with a lossless compression. The first step in STD-BCS-SPL coding which will decompose the original data into wavelet decomposed still image format.
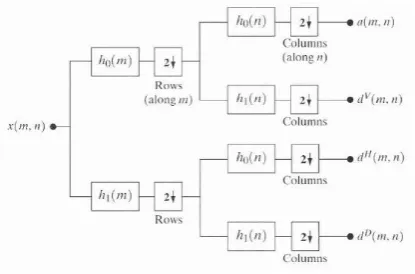
The figure 5 shows the image decomposition analysis using wavelet transform. The decomposition implies the low and high frequency coefficients to estimate LIS, LIP and LSP.
[image:6.595.36.244.288.425.2]Image decomposition: The proposed method first decomposes a data into coefficients called sub-bands after which the consequent coefficients are evaluated with a threshold. Coefficients beneath the edge are set to zero. The coefficients over the edge worth are encoded with a lossless compression. The first step in STD-BCS-SPL coding which will decompose the original data into wavelet decomposed still image format.
Figure 5: Image decomposition using Wavelet Transform.
CONCLUSION
The private identity method developed via John Daugman turned into carried out, with some adjustments regarding due to processing pace. It’s been tested best for the CASIA database picture. Due to computational performance, the search vicinity in multiple components has been decreased, and the elimination of mistakes due to reflections in the eye image has not been applied. Because of unsuccessful strive in the filtering section of the code, a characteristic via Peter Kovesi changed into used. Since the iris for the eye snap shots have been no longer to be had, accuracy of the
consequences couldn't be determined. even though, a sample of the iris from John Daugmans papers is presented under.
REFERENCES
[1] John Daugman, University of Cambridge, How Iris Recognition Works. Proceedings at International Conference on Image Processing.
[2] C.H.Daouk, L.A.El-Esber, F.D. Kammoun, M.A.AlAlaoui, Iris Recognition,
[3] Tisse, Martin, Torres, Robert, Personal Identification using human iris recognition, Peter Kovesi, Matlab functions for Computer Vision and Image Processing, What are Log-Gabor filters ?
[4] Nor’aini Abdul Jalil, Rohilah Sahak, Azilah Saparon Faculty of Electrical Engineering, University Teknologi MARA, 40450 Shah Alam, Selangor “A Comparison of Iris
Localization Techniques for Pattern Recognition
Analysis”, Selangor, Malaysia 2012 Sixth Asia Modelling Symposium.
[5] P. Radu, K. Sirlantzis, G. Howells, S. Hoque, F. Deravi “Are Two Eyes Better than One? An Experimental Investigation on Dual Iris Recognition”, 2010 International Conference on Emerging Security Technologies.
[6] Carlos A.C.M. Bastos, Tsang Ing Ren and George D.C. Cavalcanti, “ Analysis of 2D log-Gabor filters to encode iris patterns,” 2010 22nd International Conference on Tools with Artificial Intelligence.
[7] Jaehan Koh, Venu Govindaraju, and Vipin Chaudhary “A Robust Iris Localization Method Using an Active Contour Model and Hough Transform”, 2010 International Conference on Pattern Recognition.
[8] Chai Tong Yuen,Saied Ali Hosseini Noudeh, Mohammad Shazri and Mohamed Rizon, “A Fusion Technique for Iris Localization and Detection”, 2010 International Conference on Technologies and Applications of Artificial Intelligence. [9] Sharat Chikkerur_, Venu Govindaraju, and Alexander N.
Cartwright,” Fingerprint Image Enhancement Using STFT Analysis”, Springer-Verlag Berlin Heidelberg 2005