Available Online atwww.ijcsmc.com
International Journal of Computer Science and Mobile Computing
A Monthly Journal of Computer Science and Information Technology
ISSN 2320–088X
IJCSMC, Vol. 4, Issue. 11, November 2015, pg.267 – 271
RESEARCH ARTICLE
Evaluation of Performance of the Face
Detection Using Skin Colour Model and
Face Recognition Using ANN
Ravinder Pal Singh
1, Daljit Kaur
21
Research scholar Department of Information Technology, Chandigarh Engineering College, India
2
Assistant Prof, Department of Information Technology, Chandigarh Engineering College, India
1 [email protected], 2 [email protected]
Abstract— This paper presented a new and robust algorithm for face detection and recognition using skin colour model with Feed Forward neural Network. Skin colour model is used to detect face of region from given input testing image. After detection, Features are extracted from detected face regions using Zernike moment and correlation. Also Extract features from training database. Next step is applied to fuzzy set for pre-processing of extracted features of training image. Fuzzy set has been short listed more match able images (greater than min threshold value of matching feature).The system has been tested on face pix database in which 6600 images of 90 persons of 74 different images of angle variation. On evaluate performance of new algorithm on basis of factor such as accuracy, time, MSE etc. New System was found to have overall accuracy 94.64% at distance 60 to 80 cm of images.
Keywords—Face Detection, Face Recognition, Artificial Neutral Network (ANN), Skin colour model, Zernike moment
I. INTRODUCTION
II. RELATEDWORK
Chandan Singh et.al.[1] have proposed a new technique combination of Zernike Moment (ZM) and SIFT features for improving face Recognition. In this paper, two methods are used to extract global and local features from face images. Zernike moment is used to extracted a global information from face images and SIFT descriptor is used to find a local distinct information from face images. This algorithm is highly robust against illumination, pose and expression changes.
Rakesh Rathi et.al [2] have presented a new method to find or measure a similarity of images by using Self-Organizing Map
(SOM) .Face Recognition is performed by Probabilistic decision Rule. This paper presents a novel and robust SOM for face recognition. This new method offers very promising results for face identification against illumination/light variation, facial poses and no of expressions variations.
C.Saravanan et.al [3] This paper presents a new face matching algorithm by using Normalized cross –correlation(NCC).This
algorithms that help to find face image from template and begin to search for matching with different image of same person taken at different times, or different by sensors by using NCC This algorithm is performed in MAT LAB. The experimental results show that developed method is strong for similarity measure.
Hayet Boughrara et.al [4] presented Constructive training algorithm for MLP neural Network Based Recognition System. In
this paper methods used for feature extraction are Zernike moments and Gabor features to recognize human face. This algorithm starts a training process with one hidden layer and only one neuron. This is an incremental algorithm because training pattern is learned incrementally and hidden layers are increased one by one, if the mean square error of training data is not reduced or the algorithm gets stuck in a local minimum. Here input patterns are trained incrementally one by one until all patterns are selected
and trained. This algorithm was tested on UMIST database. This algorithm improves the recognition rate.
Tolga Alasag et.al[5] have been proposed a new algorithm for face recognition by using Local Zernike Moments (LZM) for
low-resolution face images. Local Zernike Moments (LZM) is used for evaluation of the moments for each pixel. This moment shows to achieve robustness and important success in face recognition. The performance of Local Zernike Moments in low-resolution face images is evaluated on FERET database. A new and novel proposed algorithm for face recognition is used for real applications.
Ravinder pal Singh et. al[6] have proposed and implemented a new and strong algorithm of face detection and recognition
using skin color model and Artificial NN. Skin color model is employed for detecting the faces from given input image .Face
Recognition is done by using Artificial Neural network (ANN).
III. EXPERIMENTAL DESIGN AND RESULTS ANALYSIS
A. Experimental Design:
In previous „research paper “Face Detection Using Skin Color Model and Face Recognition Using ANN” a novel and strong
algorithm for detecting faces from given testing image using skin color model was described and implemented. Using Zernike moments and correlation Facial features of detected face of person from testing image and training images of „Face pix‟ Database are extracted. Zernike moment is used to extract features in the form of angle of face and length and width of phase. Fuzzy set is applied for preprocessing of training images. Neural Network is applied to the shortlisted of training images..Artificial neural network is used for pattern recognition of system. FFNN is applied to recognize training sample image corresponding to detected face image of person.
In this research paper the performance of above algorithm on basis of performance parameters such as accuracy, elapsed time and recall etc is to be evaluated.
B. Design of Neural Network
Figure 1 illustrates neural the network used in the study. 74 values represented 74 different image of every person for different 90 people as input. Hidden layers is represented as interface b/w input layer and output neuron .20 hidden layers are used in the neural network. Third layer and last layer is the output layer. The output layer value is 1. One value is represented as matching
Fig. 2 Design of neural Network
Figure 2 show that performance of neural network. Best performance of the system was seen in 17rd Epochs of the training. At this point system returns mean square error is 0.14059.
Fig 2: MSE analysis of neural network
C. Result analysis
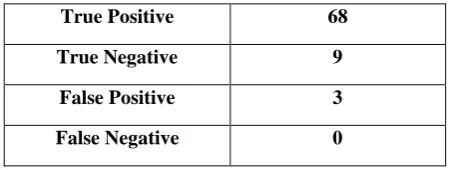
After building face detection and recognition system, to test the performance of overall system on the basis of accuracy, precision, recall and elapsed time. System has been tested 80 inputs testing images in which 77 (TP+TN=68+9=77) correctly match with corresponding image of person and 3 images incorrectly match.Table1 shows the statistical analysis parameters.
Table 1: The statistical analysis parameters
True Positive 68
True Negative 9
False Positive 3
False Negative 0
that are retrieved. It is defined in terms of the results that the system returns at some cut-off rank. Precision is also known as sensitivity
.
Precision
= TP/ (TP+FP)
Where, TP= True Positive TP= True Negative FN= False Negative FP= False Positive
2. Recall: Recall is the probability that a test will indicate „test‟ among those with the matching sample.
Recall
=
TP/ (TP+FN) * 1003. Accuracy: The percentage of the result success out of the whole results is called accuracy. Accuracy is also known as success
rate.
Accuracy
= (TP+TN)/(TP+FP+TN+FN)*1004. Specificity: measures the proportion of negatives which are correctly identified.
Specificity
=TN/(TN+FP)*1005. Predictive value negative (PVN): is fraction of negative correctly identified by total negative
PVN=TN/(TN+FN)*100
Table 2: The parametric results obtained from the simulation
PARAMETER VALUE
Sensitivity or Precision 95.77%
Recall 100.00%
Accuracy 96.25%
Specificity 75%
Predictive value negative 100%
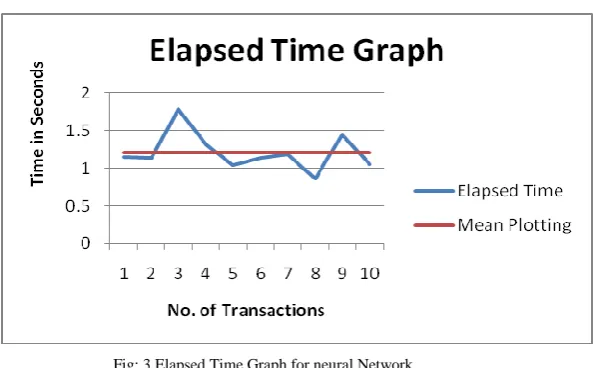
6. Elapsed Time: is defined as measurement of time completing an activity, job or task. In other words, it is defined as difference between finishing time and starting time of the neural network.
Elapsed Time =Finishing Time –Starting Time.
Fig: 3 Elapsed Time Graph for neural Network
(average time) of elapsed time of the neural network. Some points of elapsed time are greater than average time of neural network and some points of elapsed time are below the average time of neural network.
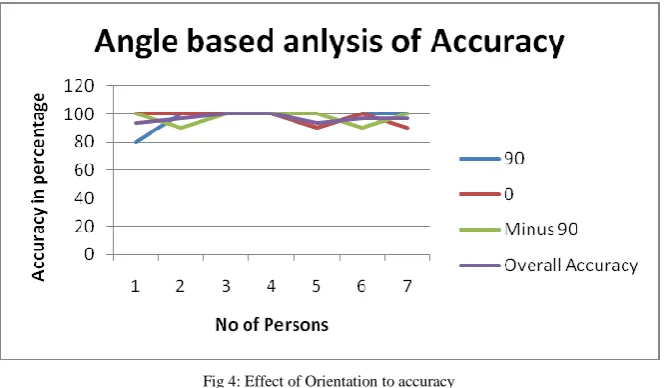
7. Angular based accuracy of system:
Fig 4: Effect of Orientation to accuracy
Fig 4 shows Angular based analysis of Accuracy graph. The graph is drawn between number of persons in x-axis and accuracy in percentage in y-axis. The graph shows four lines blue color, red color, green and purple color lines. Blue color line represents 90 degree of orientation of accuracy. In 90 degree orientation, accuracy becomes 80% in first case but another cases accuracy rate in either 90 % or 100%. The other two red and green lines represent 0 degree and -90 degree in between accuracy value 90% to 100%.and 90%to 100%.resp. Purple line represents overall accuracy of persons of varying degree.
IV. CONCLUSIONS ANDFUTUREWORK
It was found that new system of Face Detection and Recognition provides better accuracy (96.25%) as compared to other
existing systems such as Viola Jones algorithm for face detection and ANN for face recognition (87.5%). In future work, Multi-detection and Recognition of new system would be developed. Also new system would be applied on real time application for authentication and security purpose. One more point future scope of this algorithm would be developed for a new algorithm for low resolution images..
R
EFERENCES[1] Chandan Singh et.al, “Fusion of Zernike Moments and SIFT Features for Improved Face Recognition”, IJCA,2012, pp.
26-31.
[2] Rakesh Rathi et.al,“ An Application of Face Recognition System using Image Processing and Neural Networks”,
International Journal of Computer Technology and Applications (IJCTA),Volume 3 issue1 Jan-Feb 2012, pp.45-49..
[3] C. Saravanan, “Algorithm for Face Matching Using Normalized Cross-Correlation”, International Journal of Engineering
and Advanced Technology (IJEAT), Volume-2, Issue-4, April 2013,pp. 930-934.
[4] Hayet Boughrara et.al, “MLP Neural Network Based Face Recognition System Using Constructive Training algorithm ”,
IEEE,May2012.
[5] Tolge Alasag et.al, “Face Recognition in low-Resolution Images by using Local Zernik Moments”, Proceedings of the
International Conference on Machine Vision and Machine Learning ,Czech Republic, Aug 2014,PP.1251-1257.
[6] Ravinder pal Singh and Daljit Kaur, “Face Detection Using Skin Color Model and Face Recognition Using