The UK Register of HIV Seroconverters:
estimating the times from HIV seroconversion
to the development of AIDS and death and associated factors
from a cohort of HIV seroconverters
This work is presented as a thesis for the degree of DOCTOR OF PHILOSOPHY
in Epidemiology
at the
Faculty of Clinical Sciences by
Kholoud Porter
From
the Medical Research Council HIV Clinical Trials Centre University College London Medical School
The Mortimer Market Centre
ProQuest Number: U642762
All rights reserved
INFORMATION TO ALL USERS
The quality of this reproduction is dependent upon the quality of the copy submitted.
In the unlikely event that the author did not send a complete manuscript and there are missing pages, these will be noted. Also, if material had to be removed,
a note will indicate the deletion.
uest.
ProQuest U642762
Published by ProQuest LLC(2015). Copyright of the Dissertation is held by the Author.
All rights reserved.
This work is protected against unauthorized copying under Title 17, United States Code. Microform Edition © ProQuest LLC.
ProQuest LLC
789 East Eisenhower Parkway P.O. Box 1346
ABSTRACT
Knowledge of the distribution of intervals from HIV infection to the development of AIDS and to death, and the factors affecting these intervals is vital to an understanding of the natural history of HIV infection and for making projections of future numbers of AIDS cases. This distribution may have changed since the beginning of the epidemic due particularly to the introduction of anti-retroviral treatment and prophylaxis for Pneumocystis carinii pneumonia. It is likely to be influenced by new advances in the management of HIV infected individuals in the future. Changes in the incubation period distribution could also occur in the absence of changes in available treatments and treatment uptake, due to the evolving distributions of new viral strains. It is therefore important to monitor whether there are changes in the incubation period distribution and, if so, the extent of those changes and factors associated with them.
A number of studies have provided estimates for this period in different population groups. Most have tended to focus on one transmission category, e.g. homosexual men, injecting drug users, or haemophiliacs; are small in size; or are no longer recruiting new subjects.
This thesis reports on the design, methods and findings from a register of HIV-infected individuals in the UK in whom the date of seroconversion is known with reasonable precision (seroconverters). Baseline and annual follow up information is collected and includes: sex, age, ethnic group, route of HIV transmission, latest CD4 count, details of therapy and prophylaxis, AIDS defining events and vital status.
Findings presented in this work are on 2022 seroconverters reported by the end of September 1997, the first 3 years of the Register. Careful documentation of the time that each seroconverter came under unbiased follow up for the purposes of the Register was made so as to minimise any bias resulting from the preferential inclusion o f long-term non-progressors and recent seroconverters.
ACKNOWLEDGEMENTS
This work was undertaken while I was employed at the MRC HIV Clinical Trials Centre as Project Co-ordinator for the UK Register of HIV Seroconverters. It was never as a one-woman-band and I am deeply indebted to the many friends and colleagues without whose help, support, encouragement and example I could not have completed this work.
I would especially like to thank Professor Anne Johnson and Professor Andrew Phillips whom I have been fortunate to have as my supervisors. I am extremely grateful to them for always finding time through their busy schedules to give guidance, encouragement and support, and always with patience and good humour.
I am extremely grateful to Professor Janet Darbyshire for her endless support and encouragement throughout my work and study. I am especially thankful to her for being such an approachable and thoughtful person.
I am most indebted to Dr Noël Gill for his guidance over many years and for his faith in my abilities. I am particularly indebted to him for arranging CDSC’s funding of this doctorate.
So many colleagues at CDSC, SCIEH and the Trials Centre have helped make my job less stressful and more manageable and the goals more achievable. I should like to express my gratitude to them all and in particular: CDSC: Dr Barry Evans, Miss Amanda Wright, Mr Dominic Howitt, Dr Ruth Gilbert, Ms Anna Molesworth, and Mrs Pauline Kaye. SCIEH: Dr David Goldberg, Mr Glen Codere, and Ms Geraldine Bums. Clinical Trials Centre: Ms Charlotte Duff, Ms Joanne Gillett, Mr Patrick Kelleher, Ms Sarah Walker, Dr Abdel Babiker, Dr Malcolm Hooker, Mr Adrian Kimberley, and Mr Robert Manning.
CONTENTS
Page
List of tables List o f figures Chapter I Chapter II Chapter III Chapter IV Chapter V Chapter VI Chapter VII Chapter VIII APPENDICES I II III IV V VI REFERENCES Introduction
A review of publications o f HIV seroconverter cohorts Methods
Methodological issues
Characteristics of the UK Register cohort Statistical methods and an evaluation of bias Progression estimates from HIV seroconversion to AIDS and to death
A summary of findings and further work
Members of the Executive and Steering committees Names o f collaborators
Definition of an acute seroconverter Data collection forms
Time of entry into risk set for each clinical centre Epidemiology & Infection publication
LIST OF TABLES
Table Title Page
1.1 Summary of the 1986 classification system for the clinical 15 manifestations of HIV infection
1.2 Summary of the 1993 classification system for the clinical 16 manifestations of HIV infection
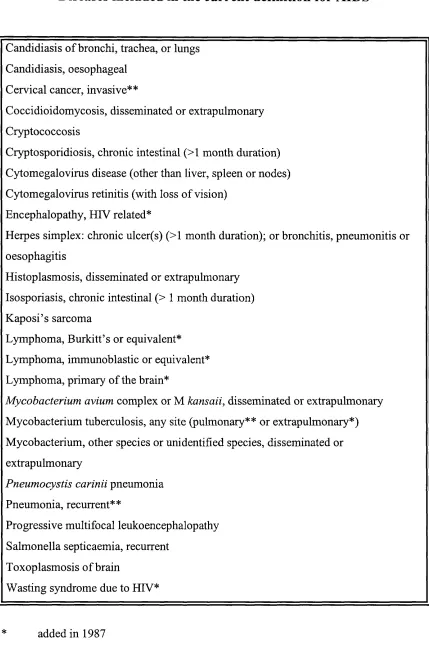
1.3 Diseases included in the current definition for AIDS 18 1.4 Definitive Diagnostic Methods for Diseases Indicative of AIDS 19 1.5 Presumptive Methods for Diseases Indicative of AIDS 20 1.6 AIDS cases and HIV infection reports in the UK: data reported to 22
CDSC and SCIEH to the end o f September 1994
1.7 Drugs prescribed in HIV infection 27
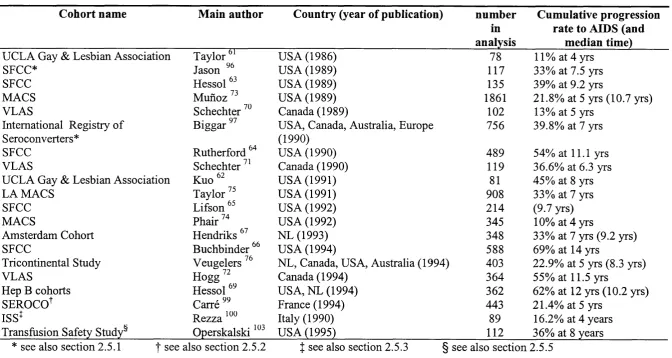
2.1 A summary of published studies of HIV progression rates in cohorts o f 33 homosexual and bisexual men
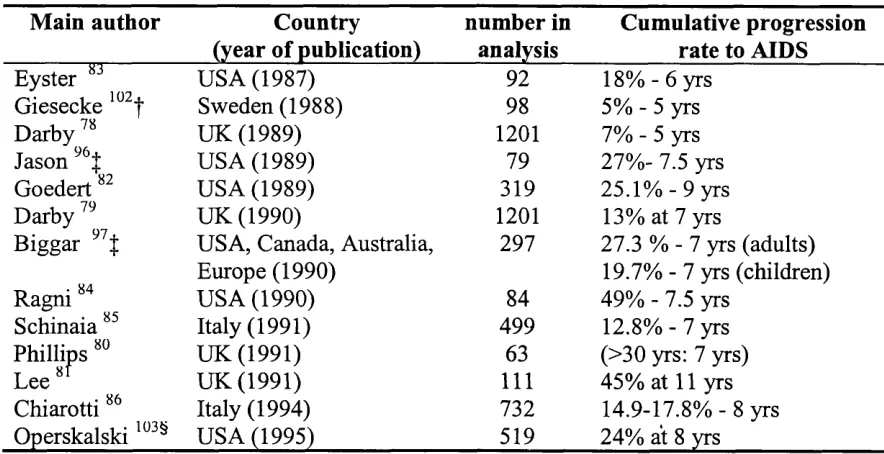
2.2 A summary of published studies of HIV progression rates in cohorts o f 44 persons with haemophilia
2.3 Estimates of progression to AIDS by age group at seroconversion from 46 the UKHCDO data
2.4 Estimates of progression to AIDS within 9 years o f seroconversion by 46 age group for persons in the MCHS
2.5 A summary of published studies of blood transfusion recipients 49 2.6 Progression to AIDS by age group at seroconversion for Swedish 53
transfusion recipients
2.7 A summary of published studies of injecting drug users 55 2.8 A comparison of progression rates to AIDS between haemophiliacs in 61
Western Pennsylvania and homosexual men in the SFCC
2.9 A comparison of progression rates to AIDS between haemophiliacs in 61 MCHS and homosexual men in the 1RS
2.10 Progression rates to AIDS in haemophiliacs and transfusion recipients 64 in Sweden
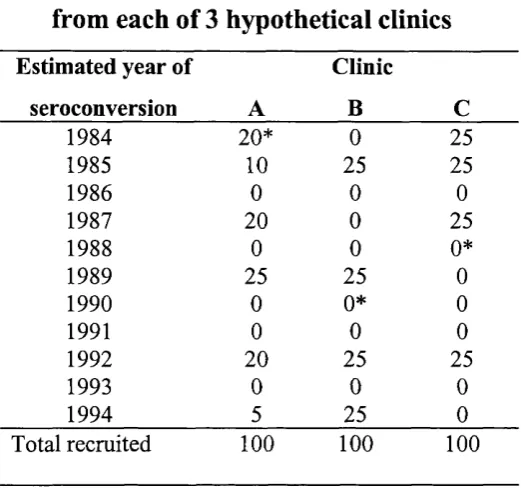
4.2 Late entry: number of patients recruited from each of 3 hypothetical 90 clinics
4.3 Late entry: life table of retrospectively identified seroconverters from 90 hypothetical clinics A, B, and C (see Table 4.2)
4.4 Reporting delay for UK AIDS cases reported to CDSC and SCIEH to the 95 end of 1996
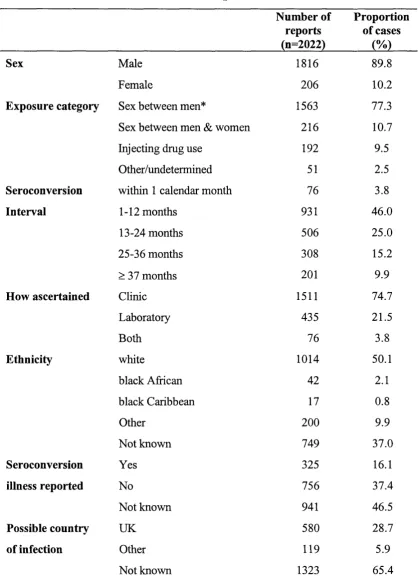
5.1 Characteristics of all subjects reported to the Register 100 October 1994 - September 1997
5.2 Total number of all subjects reported, number of AIDS diagnoses, and 104 number o f deaths known by 30 September 1997
5.3 Age distribution of all subjects reported to the Register 105 by exposure category
5.4 Age at seroconversion of all subjects reported to the Register by 106 exposure category and sex
5.5 Interval between last negative and first positive HIV antibody tests and 109 proportions with AIDS and who have died
5.6 AIDS cases: Year of diagnosis of AIDS 110
5.7 AIDS cases: AIDS defining diseases and proportion of total diagnoses 112 5.8 AIDS cases: exposure category distribution of all AIDS-defining 113
conditions
5.9 Non-progressors: year of last clinic visit for persons not diagnosed 114 with AIDS
5.10 Deaths : Estimated year of seroconversion by year of death 115 5.11 Persons remaining alive in HIV survival estimates: year last known to 117
be alive
6.1 Documentation of seroconversion by exposure category for 122 seroconverters with a 3-year maximum HIV test interval and proportion
of total reported
6.2 Characteristics of 917 documented seroconverters with 3 year maximum 124 test interval and contributing information to the risk set of AIDS analysis
6.4 Examination of the effect of ignoring late entry on AIDS progression 126 estimates
7.1 A descriptive comparison between: N- the total numbers of subjects 133 reported to the Register (n= 2022) and the numbers included in the AIDS
(n= 917) (A) and death (n= 1149) (D) progression analyses
7.2 Cumulative proportion of seroconverters developing AIDS 135 7.3 F actors associated with progression from HIV seroconversion to an 137
AIDS diagnosis
7.4 Examination of the effect of age at seroconversion on progression 139 estimates from HIV seroconversion to AIDS
7.5 Examining the effect of age at seroconversion on AIDS diagnosis for 141 men exposed through sex between men
7.6 The effect of narrower HTV test intervals on AIDS progression estimates 144 within the first 3 years of HIV seroconversion
7.7 Cumulative proportion of seroconverters dying from any cause following 147 HIV seroconversion
7.8 Factors associated with progression from HIV seroconversion to death 149 7.9 Examining the effect of age at seroconversion on survival estimates 150 7.10 The effect of narrower HIV test intervals on HIV survival estimates 152
within the first 3 years of HIV seroconversion
8.1 The relative risk of AIDS for injecting drug users compared to men who 156 have sex with men: findings from published studies
LIST OF FIGURES
Figure Title Page
1.1 WHO estimates of the number of persons living with HIV at the end 23 of 1996, and estimates of the cumulative number of AIDS cases in
adults to the end of 1996
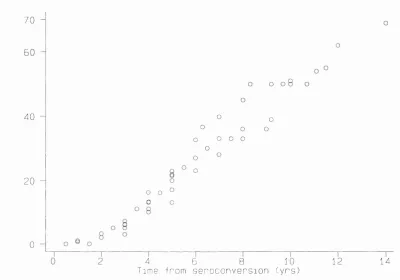
2.1 Published progression rates from HIV seroconversion to AIDS from 34 cohorts o f homosexual men
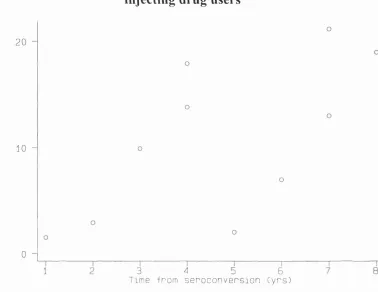
2.2 Published progression rates to AIDS from cohorts of injecting drug 56 users
4.1 An illustration of right censoring bias 92
5.1 Distribution of all subjects reported to the Register 99 to the end of September 1997 by reporting clinical centre
5.2 Exposure category distribution by calendar year of seroconversion 102 5.3 Age distribution of all subjects reported by estimated year of 107
seroconversion
6.1 Kaplan-Meier plots of time to AIDS from seroconversion for 122 documented and undocumented seroconverters
6.2 Kaplan-Meier plots of time to AIDS from seroconversion allowing for 126 late entry and ignoring it
6.3 Kaplan-Meier plots of the effect of right-censoring strategies on AIDS 129 progression estimates
6.4 Kaplan-Meier plots of the effect of right-censoring strategies on HIV 130 survival estimates
7.1 A flow chart of number of subj ects reported to the Register and 132 numbers included in final analyses
7.2 Cumulative progression rates from HIV seroconversion to AIDS 136 diagnosis for seroconverters reported to the Register and censored in
June 1995 with persons lost to follow up assumed to be AIDS-free on that date
7.4 Kaplan-Meier plots for time to AIDS from HIV seroconversion by age 141 group at HIV seroconversion for men exposed through sex between
men
7.5 Estimated AIDS rate and 95% confidence intervals for each year since 143 seroconversion
7.6 Kaplan-Meier plots of the effect of the HIV test interval on progression 144 estimates from HIV seroconversion to AIDS
7.7 Cumulative progression rates from HIV seroconversion to death for 146 seroconverters reported to the Register and censored in December 1996
with persons lost to follow up assumed to be alive on that date
7.8 Kaplan-Meier plots for time from seroconversion to death from any 150 cause by age group at seroconversion
7.9 Kaplan-Meier plots of the effect of the HIV test interval on progression 152 estimates from HIV seroconversion to death
8.1 Cumulative proportion of persons developing AIDS by time since 154 seroconversion: estimates from the Register compared to estimates
CHAPTER I
INTRODUCTION
1.1 First A ID S reports
An article appeared in the Morbidity and Mortality Weekly Report (MMWR) from the Centers for Disease Control (CDC) in Atlanta, USA in June 1981 describing a cluster of 5 cases o f Pneumocystis carinii pneumonia (PCP) in previously fit, healthy young homosexual men in Los Angeles without any apparent reason for immune suppression ’. One month later 10 more cases of PCP and 26 o f Kaposi’s sarcoma (KS) from New York as well as California were described
PCP, a lung infection caused by a pathogen to which most individuals are exposed with no undue consequences, was extremely rare prior to 1981 in individuals other than those receiving immunosuppressive therapy or among the ehronically malnourished. In 1967, CDC became the sole supplier in the United States o f pentamidine isethionate, then the only recommended PCP therapy, and began collecting data on each PCP case diagnosed and treated in the US. After reviewing requests for pentamidine in the period 1967 to 1970, researchers found only one case of confirmed PCP without a known underlying condition In the period immediately prior to the recognition o f AIDS, January 1976 to June 1980, CDC received only one request for pentamidine isethionate to treat an adult in the United States who had PCP and no underlying cause o f immune suppression. In 1981 alone, 42 requests for pentamidine were received to treat patients with PCP and no known underlying disorders
KS, a very rare skin neoplasm, had until the report in the MMWR in 1981 affected mostly older men of Mediterranean origin or cancer or transplant patients undergoing immunosuppressive therapy
or history o f immunosuppressive therapy was unprecedented. Searches of the medical literature, autopsy records and tumour registries revealed that these diseases previously had occurred at very low levels in the United States
It soon became evident that these young homosexual men had a common immunologic deficit, an impairment in cell-mediated immunity resulting from a significant loss of "T- helper" cells, which bear the CD4 marker.
Soon after the initial reports from the United States other countries reported cases of what later became known as AIDS (Acquired Immune Deficiency Syndrome). The fact that homosexual men constituted the initial population in which AIDS occurred in the United States led epidemiologists to conclude that a homosexual lifestyle was specifically related to the disease These early suggestions were dismissed when the syndrome was later observed in distinctly different groups: in male and female injecting drug users in haemophiliacs and blood transfusion recipients among female sex partners of bisexual men recipients o f blood or blood products or injecting drug users and among infants bom to mothers with AIDS or with a history o f injecting dmg use20-22
The first case in the United Kingdom was described in 1981 and in September 1982 a surveillance system was set up, through a voluntary reporting scheme, o f Kaposi’s sarcoma and AIDS jointly by the Public Health Laboratory Service (PHLS) Communicable Disease Surveillance Centre (CDSC) and the Communicable Disease (Scotland) Unit (CD(S)U) (now known as The Scottish Centre for Infection and Environmental Health (SCIEH))
1.2 Isolation o f responsible agent
By 1983, several research groups had focused on retroviruses for clues to the cause of AIDS. Two recently recognised retroviruses, human T-cell lymphotropic virus (HTLV) type-I and HTLV-II, were the only viruses then known to preferentially infect helper T lymphocytes, the cells depleted in people with AIDS. The pattern o f HTLV transmission was similar to that seen among AIDS patients. In addition, HTLV-I was known to cause mild immunosuppression, and a related retrovirus, the lymphotropic feline leukaemia virus (FeLV), caused lethal immunosuppression in cats.
In May 1983, the first report providing experimental evidence for an association between a retrovirus and AIDS was published After finding antibodies cross-reactive with HTLV-I in a homosexual patient with lymphadenopathy, a group led by Dr. Luc Montagnier in France isolated a previously unrecognised virus producing reverse transcriptase which later became known as lymphadenopathy-associated virus (LAV). The French group subsequently reported that LAV was tropic for T-helper cells, in which it grew to substantial titres and caused cell death.
In 1984, a considerable amount of new data added to the evidence for a retroviral aetiology for AIDS. Researchers at the National Institutes of Health reported the isolation of a cytopathic T-lymphotropic virus from 48 different people, including 18 of 21 with pre-AIDS, three of four clinically normal mothers of children with AIDS, 26 of 72 children and adults with AIDS, and one (who later developed AIDS) of 22 healthy homosexuals The virus, named HTLV-III, could not be found in 115 healthy heterosexual subjects. Later, in 1986, the International Committee of Viral Taxonomy renamed these identical viruses the human immunodeficiency virus (HIV)
1.3 C haracterisation o f H IV disease
uninfected. In advaneed HIV disease, abnormalities o f virtually every component o f the immune system are evident. As disease progresses, inereasing amounts o f infectious virus, viral antigens and HIV-specific nucleic acids in the body correlate with a worsening clinical course. HIV disease progression can be described in terms o f stages defined by clinical manifestations, as proposed by CDC in 1986 (Table 1.1), and later superseded by a system incorporating the infected individual’s CD4 cell count (Table
1.2).
Initial infection may or may not be accompanied by an acute illness (called seroconversion illness) which resembles glandular fever A persistent swelling of the lymph glands may also be diagnosed (PGL). A period of asymptomatic infection of variable length follows which is accompanied by a general decline of the immune system. The final stage is the diagnosis of AIDS. This is a spectrum o f conditions that occur when the immune system is seriously damaged leading to severe immune suppression and constitutional disease, neurological complications, and opportunistic infections and neoplasms that rarely occur in persons with intact immune function.
1.4 AIDS case definition changes
The first case definition, set up in 1982, was in reality for ‘Kaposi’s sarcoma and opportunistic infections in previously healthy persons’:
“A case is defined as illness in a person who 1) has either biopsy-proven K S or culture-proven, life threatening opportunistic infection, 2) is under age 60 and 3) has no history o f either immunosuppressive underlying illness or immunosuppressive therapy ”
Three months later when the syndrome was termed AIDS, a case definition, which became widely adopted for the purposes of surveillance, was defined as someone with:
Table 1.1
Summary of the 1986 classification system for the clinical
manifestations of HIV infection
Classification Disease/ symptoms
Group I Acute infection
Group II Asymptomatic^
Group III Persistent generalised lymphadenopathy (PGL)^
Group IV AIDS and ARC
Subgroup A Constitutional disease Subgroup B Neurological disease
Subgroup C Secondary infectious disease
Category C-1 Specified secondary infectious diseases: PCP, chronic cryptosporidiosis, toxoplasmosis, extraintestinal
strongyloidiasis, isosporiasis, candidiasis (oesophageal, bronchial, or pulmonary), cryptococcosis, histoplasmosis, mycobacterial infection with Mycobacterium avium
complex or M, kansasii, cytomegalovirus infection, chronic mucocutaneous or disseminated herpes simplex virus infection, or progressive multifocal leukoencephalopathy. Category C-2 Other specified secondary infectious diseases: oral hairy
leukoplakia, multidermatomal herpes zoster, recurrent salmonella bacteraemia, nocardiosis, tuberculosis, or oral candidiasis.
Subgroup D Secondary cancers: Kaposi's sarcoma, non-Hodgkin's lymphoma (small, noncleaved lymphoma or immunoblastic sarcoma), or primary lymphoma of the brain.
Subgroup E Other conditions
Table 1.2
Summary of the 1993 classification system for the clinical
manifestations of HIV infection
CD4+ T-cell
categories
Clinical categories
(A)
Asymptomatic, acute
(primary) HIV or PGLf
(B)
Symptomatic, not (A)
or (C) conditions§
(C)
AIDS-indicator
conditions^
(1) >500/^1 A1 B1 Cl
(2) 200-499/|Lil A2 B2 C2
(3) <200/|nl
AIDS-indicator T-cell count
A3 B3 C3
t PGL= persistent generalised lymphadenopathy. Clinical category A includes acute (primary) HIV
infection with accompanying illness or history o f acute HIV infection Conditions listed in
Categories B and C must not have occurred.
§ Includes symptomatic HIV infected adults with conditions not included in clinical Category C and who
meet at least one o f the following criteria: a) the conditions are attributed to HIV infection or are
indicative o f a defect in cell-mediated immunity; or b) the conditions are considered by physicians to
have a clinical course or to require management, for example, bacillary anginomatosis, oropharyngeal
candidiasis, cervical dysplasia, constitutional symptoms such as fever or diarrhoea lasting more than one
month, oral hairy leukoplakia. For classification purposes. Category B conditions take precedence over
those in Category A.
^ Includes the clinical conditions listed in the surveillance case definition (see Table 1.3). For
After the discovery of HIV, a revision of the case definition was proposed by CDC in 1985 which was adopted in industrialised countries adding the diagnosis of non- Hodgkin’s lymphoma and also the diagnosis of KS in a person over the age of 60 with a positive serologic or virologie test for HIV- previously a KS diagnosis was restricted to persons aged less than 60 years
In 1987 a major revision followed which increased both sensitivity and specificity o f the case definition by allowing the presumptive non-invasive diagnosis of many AIDS indicator diseases together with laboratory evidence of HIV infection Two new diseases were also incorporated into the definition: HIV Wasting Syndrome and HIV Encephalopathy (Tables 1.3 - 1.5).
The most recent revision was developed in 1993 and widened the 1987 definition to include 3 new diseases: pulmonary tuberculosis (TB), recurrent pneumonia in a 12- month period, and invasive cervical carcinoma, as well as a CD4 cell count o f 200 or less per pi of blood regardless of clinical manifestations This revision was adopted in the UK but excluded the diagnosis of severe immune suppression (i.e. a CD4 cell count of below 200 cells per pi of blood) in the absence of clinical illness
Surveillance definitions of AIDS have proven useful epidemiologically to track and quantify the epidemic of HIV-mediated immunosuppression and its manifestations. However, AIDS represents only the end stage of a continuous, progressive pathogenic process. In clinical practice, symptoms together with the measurements o f immune function, particularly levels of CD4+ T lymphocytes, are used to guide the treatment of HIV-infected persons.
Table 1.3
Diseases included in the current definition for AIDS
Candidiasis of bronchi, trachea, or lungs Candidiasis, oesophageal
Cervical cancer, invasive**
Coccidioidomycosis, disseminated or extrapulmonary Cryptococcosis
Cryptosporidiosis, chronic intestinal (>1 month duration) Cytomegalovirus disease (other than liver, spleen or nodes) Cytomegalovirus retinitis (with loss of vision)
Encephalopathy, HIV related*
Herpes simplex: chronic ulcer(s) (>1 month duration); or bronchitis, pneumonitis or oesophagitis
Histoplasmosis, disseminated or extrapulmonary Isosporiasis, chronic intestinal (> 1 month duration) Kaposi’s sarcoma
Lymphoma, Burkitt’s or equivalent* Lymphoma, immunoblastic or equivalent* Lymphoma, primary of the brain*
Mycobacterium avium complex or M kansaii, disseminated or extrapulmonary Mycobacterium tuberculosis, any site (pulmonary** or extrapulmonary*) Mycobacterium, other species or unidentified species, disseminated or extrapulmonary
Pneumocystis carinii pneumonia Pneumonia, recurrent**
Progressive multifocal leukoencephalopathy Salmonella septicaemia, recurrent
Toxoplasmosis of brain
Wasting syndrome due to HIV*
Table 1.4
Definitive Diagnostic Methods for Diseases Indicative of AIDS
The following list indicates the definitive diagnostic methods for diseases indicative of AIDS. These must be accompanied with laboratory evidence o f HIV infection regardless o f the presence of other causes of immunodeficiency:
Cryptosporidiosisf Isosporiasis
K S ff, Lymphoma o f brainfî, other non-Hodgkin’s lymphoma PCPf, PMLt
Toxoplasmosis o f braint Cervical cancer
Microscopy (histology or cytology)
Candidiasisf Gross inspection by endoscopy or autopsy or by microscopy (histology or
cytology) on a specimen obtained directly from the tissues affected (including scrapings from the mucosal surface), not from a culture.
Coccidioidomycosis Cryptococcosisf Cytomegalovirus^ Herpes simplex virusf Histoplasmosis
Microscopy (histology or cytology), culture, or detection o f antigen in a specimen obtained directly from the tissues affected or a fluid from those tissues.
Tuberculosis Culture
Other mycobacteriosis Salmonellosis
HIV encephalopathy Clinical findings of disabling cognitive or motor dysfunction interfering
with occupation or activities o f daily living, progressing over weeks to months, in the absence o f a concurrent illness or condition other than HIV infection that could explain the findings. Methods to rule out such concurrent illness and conditions must include cerebrospinal fluid examination and either brain imaging (computed tomography or magnetic resonance) or autopsy.
HIV wasting syndrome Findings o f profound involuntary weight loss o f greater than 10 percent o f
baseline body weight plus either chronic diarrhoea (at least two loose stools per day greater than or equal to 30 days), or chronic weakness and documented fever (for greater than or equal to 30 days, intermittent or constant) in the absence o f a concurrent illness or condition other than HIV infection that could explain the findings (e.g., cancer, tuberculosis, cryptosporidiosis, or other specific enteritis).
Pneumonia, recurrent Recurrent (more than one episode in a 1-year period), acute (new x-ray
evidence not present earlier) pneumonia diagnosed by both (a) culture (or other organism-specific diagnostic method) obtained from a clinically reliable specimen o f a pathogen that typically causes pneumonia (other than Pneumocystis carinii or Mycobacterium tuberculosis), and (b) radiologic evidence o f pneumonia; cases that do not have laboratory confirmation o f a causative organism for one o f the episodes o f pneumonia will be considered to be presumptively diagnosed.
t These diseases are also included in the absence of laboratory evidence o f HIV infection but after the exclusion of other causes of immunodeficiency.
Table 1.5
Presumptive Methods for Diseases Indicative of AIDS
The following list are suggested criteria for a presumptive diagnosis o f diseases indicative of AIDS, regardless of the presence of other causes o f immunodeficiency, (these must be accompanied by laboratory evidence of HIV infection);
Candidiasis of Oesophagus
Recent onset of retrosternal pain on swallowing; AND (b) oral candidiasis diagnosed by the gross appearance o f white patches or plaques on an Erythematous base or by the microscopic appearance of fungal mycelial filaments fi-om a noncultured specimen scraped from the oral mucosa
Cytomegalovirus Retinitis
characteristic appearance on serial ophthalmoscopic examinations (e.g., discrete patches of retinal whitening with distinct borders, spreading in a centrifugal manner along the paths of blood vessels, progressing over several months, and frequently associated with retinal vasculitis, haemorrhage, and necrosis). Resolution of active disease leaves retinal scarring and atrophy with retinal pigment epithelial mottling
Mycobacteriosis Microscopy of a specimen from stool or normally sterile body fluids or tissue from a site other than lungs, skin, or cervical or hilar lymph nodes that shows acid-fast bacilli o f a species not identified by culture KS A characteristic gross appearance o f an erythematous or violaceous
plaque like lesion on skin or mucous membrane. (Note: Presumptive diagnosis of Kaposi's sarcoma should not be made by clinicians who have seen few cases of it.)
PCP A history of dyspnoea on exertion or non-productive cough of recent onset (within the past 3 months); AND (b) chest x-ray evidence of diffuse bilateral interstitial infiltrates or evidence by gallium scan of diffuse bilateral pulmonary disease; AND (c) arterial blood gas analysis showing an arterial pO of < 70 mm Hg or a low respiratory diffusing capacity (< 80% of predicted values) or an increase in the alveolar- arterial oxygen tension gradient; AND (d) no evidence of bacterial pneumonia.
Toxoplasmosis of Brain
criteria (a) Recent onset of a focal neurologic abnormality consistent with intracranial disease or a reduced level o f consciousness; AND (b) evidence by brain imaging (computed tomography or magnetic resonance) of a lesion having a mass effect or the radiographic appearance of which is enhanced by injection of contrast medium; AND (c) serum antibody to toxoplasmosis or successful response to therapy for toxoplasmosis.
Pulmonary Tuberculosis
When bactériologie confirmation is not available, other reports may be considered to be verified cases o f pulmonary tuberculosis if the criteria of the Division of Tuberculosis Elimination, National Center for Prevention Services, CDC, are used*
Pneumonia, recurrent
1.5 E m ergence o f a disease
By February 1985, 8495 cases of AIDS in the US had been reported to CDC, and in Europe 762 cases were reported to the World Health Organisation (WHO) Collaborating Centre for the European region in Paris. A total of 132 cases were reported from the UK, 126 (95%) of whom were male.
By that time the major modes for transmission of HIV infection had become known: through sexual contact (homosexual and heterosexual), through blood contact (injecting drug use, receipt of contaminated blood products by transfusion or clotting Factor VIII, or occupationally in a health care setting), and from mother to infant (in utero, during birth and through breastfeeding). The major mode of transmission of HIV in the UK is through sex between men.
At the end of September 1994 when this work was embarked upon, 9865 AIDS cases had been reported to CDSC and SCIEH of whom 6712 (68%) were known to have died. As reporting o f AIDS cases is not 100% complete due to under-reporting as well as delayed reporting, this figure should be regarded as the minimum cumulative AIDS incidence in the UK. 22,581 laboratory reports of HIV infection were also made to CDSC and SCIEH, of whom a number were also contained in the AIDS figures (Table 1.6). In the absence of regular mandatory testing for HIV antibodies in the population, not all those infected will have been diagnosed. Thus the number of laboratory reports under-estimates the total number of persons infected with HIV in the population. Allowing for under-diagnosis as well as delayed and under-reporting, the estimates for the cumulative number of AIDS cases at the end of 1994 in the UK was 12,170 and 23,880 prevalent HIV infections at the end of 1993
Table 1.6
AIDS cases and HIV infection reports in the UK:
data reported to CDSC and SCIEH to the end of September 1994
E xposure category M ale Fem ale Total
AIDS H IV AIDS H IV AIDS HIV*
Sex betw een men 7334 13966 - - 7334 (74%) 13966 (62%)
Sex betw een men & wom en 675 1689 506 1951 1181(12% ) 3646 (16%)
Injecting drug use 395 1821 168 820 563 (6%) 2645 (12%)
H aem ophilia 427 1215 6 11 433 (4%) 1226 (5%)
Blood transfusion 37 76 68 77 105 (1%) 154 (0.7%)
O ther/undeterm ined 160 687 89 225 249 (3%) 944 (4%)
Total 9028 19454 837 3084 9865 (100%) 22581 (100%)
Figure 1.1
WHO estimates of the number of persons living with HIV
at the end of 1996
IT
7$(\opQ) A
^ . y
-M miHion
5 .2 i ^ i g i i
WHO estimates of the cumulative number of AIDS cases in adults
to the end of 1996
53,000.
'million
g=À'
1.6 T he incubation period
The incubation period of a disease is defined as the time between the entrance of the pathogen into the host to the development of clinical signs and symptoms.
Shortly after the discovery o f HIV and development o f an antibody test able to identify persons infected with the virus, estimates of the AIDS incubation period distribution (IPD) were made. It became apparent early in the epidemic that many more persons were infected than those diagnosed and that estimates of the time from seroconversion to disease manifestation as well as information on the factors which may influence this period would be insightful into the pathogenesis o f HIV and could lead to better understanding of its natural history. Besides being a valuable tool in the clinical assessment and counselling of those infected, knowledge of the IPD is crucial to healthcare planners as it allows estimates o f the future AIDS case load to be made.
However, neither the start of this period nor its end are well-defined events. Once HIV enters a host, the host is said to be infected. However, infection cannot normally be diagnosed until antibodies specific to HIV antigens are detected in the host’s blood. This usually occurs within 6 weeks of infection. This transition from being negative for HIV antibodies to becoming positive is termed ‘seroconversion’ and the host is said to have seroconverted. The AIDS incubation period is generally measured from seroconversion, which is regarded as synonymous with infection. As the time lag between infection and seroconversion is short relative to the incubation period, estimates of the IPD are unlikely to be greatly affected by it.
Adding further complication is the fact that there does not exist one specific definable event in HIV disease which heralds the “development of clinical signs and symptoms”, and many symptoms may remain clinically undiagnosed. Less subject to this bias is the diagnosis o f AIDS, and the IPD is thus generally measured to AIDS.
Nonetheless, variation will arise in its diagnosis due to: which case AIDS definition is operable at the time, which AIDS indicator disease is diagnosed (as some tend to present at more severe states of immune suppression than others) and to a lesser extent, the differing experience of diagnosis of the clinician.
A particular characteristic of the AIDS incubation period is its length and variability. The progression from seroconversion to the diagnosis of an AIDS defining disease can be as short as a few months or as long as 15 years or over. We do not yet know how long this tail of the distribution is likely to be nor can we be certain that all those infected will inevitably progress to AIDS. Our knowledge of the AIDS incubation period, current at the time when this work was embarked upon, is that it has a median of the order o f 8 to 10 years and is strongly influenced by the age of the infected individual at the time of seroconversion. In adults it now seems clear that younger individuals (below 25- 30 years) will, on the whole, tend to progress at much slower rates than older individuals. Moreover, a number of studies of injecting drug users and persons with haemophilia have produced much slower estimates of the incubation period than studies of homosexual men (discussed in Chapter II). It is not entirely clear how much of this is real and how much may be due to methodological differences. As most cohorts have tended to focus on one exposure group, across-group comparisons between publications may not be appropriate.
1.7 The U K Register o f H IV seroconverters
I began working in October 1994 to set up a register o f persons in the UK with well- estimated dates of HIV seroconversion. The Register was initially funded for a period of 3 years through a grant from the Medical Research Council with the aim o f providing ongoing monitoring of the AIDS incubation period and of the time from HIV seroconversion to death. O f particular interest were any changes in these periods over calendar time and if these could be due to anti-retroviral treatment and prophylaxis for opportunistic infections. With this in mind, it is worth summarising what treatment was generally available for HIV infected persons.
1.8 Treatm ent and prophylaxis for HIV and AIDS
Drugs prescribed for the treatment of HIV disease may be used: either against the opportunistic infections which the infected individual becomes susceptible to, or against the virus itself. Table 1.7 summarises the major classes of drugs currently prescribed.
1.8.1 Drugs used against opportunistic infections
These can be prescribed for the prevention (primary prophylaxis), against the recurrence (secondary prophylaxis) or for the treatment of a number of opportunistic infections. In the early 1980s these were the only drugs available for the management of HIV infected individuals.
The most widely used drugs are against PCP, e.g. Pentamidine and Co-trimoxazole, and have had dramatic results in reducing its incidence. Other drugs currently widely prescribed are also summarised in Table 1.7
1.8.2 Drugs used against the virus
Table 1.7
Drugs prescribed in HIV infection
A n tiretro v ira ls D rugs against opportunistic infections
R TIs P is Infection Drug
nucleoside non-nucleoside Candida fluconazole
analogue analogue itraconazole
ketoconazole
AZT nevaripine saquinavir CMV disease foscamet
ddC delavirdine ritonavir ganciclovir
ddl loviride indinavir HSV acyclovir
D4T nelfinavir MAI rifabutin
3TC PCP cotrimoxazole
fansidar pentamidine
I B isoniazid
The most widely prescribed of these drugs and the first to be approved for use in HIV infection is Zidovudine (AZT). It is a ‘nucleoside analogue’ RTI, terminating DNA synthesis from viral RNA thus preventing the virus from replicating. ‘Non-nucleoside analogue’ RTIs also target HIV’s reverse transcriptase enzyme by binding onto it to prevent it from working.
The other category of anti-HIV drugs are the protease inhibitors. These target a different enzyme (protease) to generate non-infectious HIV virions. This class of drugs were not generally prescribed in the UK until 1996 or later, and generally as part of a ‘triple regimen’ in combination with other anti-retrovirals, particularly two nucleoside analogue RTIs.
Most of these drugs, however, appear to lack long-term efficacy, which may be partly due to the development of resistance, and are toxic.
1.10 O bjectives o f this thesis
The aim o f this thesis is to measure the incubation period and survival time in a national cohort o f individuals with known dates of seroconversion and to explore demographic, clinical and temporal factors which may influence these distributions.
This thesis will:
♦ Describe how the Register was set up and how seroconverters, potentially eligible for inclusion are identified.
♦ Describe how follow up of enrolled subjects is conducted and what methods of minimising loss to follow up are employed.
♦ Describe the characteristics o f persons reported to the Register.
♦ Give estimates for cumulative progression rates from HIV seroconversion to AIDS and to death.
♦ Examine the effects of the following cofactors on HIV progression rates:
* Age at estimated calendar time of seroconversion * Calendar year o f seroconversion
* Sex
* HIV test interval (time between last negative and first positive antibody test dates) * How seroconverters were identified
1.11 L ayout o f thesis
CHAPTER II
A REVIEW OF PUBLICATIONS OF HIV SEROCONVERTER
COHORTS
Much of our present knowledge of the AIDS incubation period is derived from cohorts of persons already infected with HIV when enrolled, who are monitored over time These are termed ‘prevalent cohorts’ and those infected are ‘prevalent positive’. The main advantage of such cohorts to investigators is that they are relatively easy to assemble and contain many events (i.e. the development of AIDS and/or death) over the follow up period. Uncertainty, however, over the period before observation began means that this unobserved period has to be supplemented with information from other sources to impute infection dates. Methods include the use of markers of disease progression or an assumed distribution of infection. Such data are thus ‘left truneated’ and the magnitude of bias in estimates obtained from such cohorts will strongly depend on how soon after infection each person enters the cohort.
In order to reduce this uncertainty over the exact time of infection several investigators have gathered eohorts of initially HIV seronegative persons followed up through seroconversion to AIDS and death. Many of these ‘incident eohorts’ were initially opportunistically assembled from previous case-eontrol studies where they had acted as the ‘controls’ (while those already infected were the ‘eases’) and had seroconverted whilst enrolled. Others were retrospeetively determined through the testing of sera which had been stored for reasons unrelated to HIV infection, such as hepatitis B. These ‘incident infections’ have the advantage of having a more preeisely defined time of infection. Due to the fairly low ineidenee of HIV, those ascertained prospeetively at least, require lengthy periods of follow up. As with prevalent cohorts, retrospectively ascertained ‘incident infections’ may also be left-truncated (discussed in section 4.5).
persons infected through contaminated clotting factor, Factor VIII, transfusion recipients of infected blood, and injecting drug users. The studies are described in detail below and summary findings are presented in tables and figures for each exposure category. The final section details findings from studies comprising different groups of persons either within the same cohort or through pooling data from more than one cohort.
The studies listed here were identified through searching Medline. The references listed in the publications thus identified were also reviewed. Only English language publications were reviewed. As the main objective of this study is to estimate the time from seroconversion to AIDS and to death I have only included studies from which it was possible to obtain information on these estimates. Studies which only gave estimates from the time of enrolment have not been included.
2.1 C O H O R TS OF H O M O SE X U A L AND BISE X U A L M EN
Many of the early cohorts were of homosexual and bisexual men as they represented a group of individuals who were either already antibody positive when enrolled (prevalent infections) or, because they were at risk of HIV infection, seroconversion was likely to be detected amongst them at higher rates than amongst most other groups (incident infections). Sera stored from men who had participated in studies of Hepatitis B incidence and prevalence as well as the efficacy of the Hepatitis B vaccine in the late 1970s presented an ideal opportunity of having ready cohorts in whom seroconversion could be estimated with reasonable precision at a very early stage of the AIDS epidemic in the USA and Europe.
Table 2.1 summarises findings of the progression estimates from cohorts of homosexual and bisexual men at their longest follow-up times. The median time from seroconversion to AIDS from these studies varies between 8.3 to 10.7 years. That is the time from seroconversion at which 50% of the cohort remain AIDS-free. It can be seen in Figure 2.1 that estimates from these cohorts are in broad general agreement but with the greatest discrepancy 7 to 10 years following seroconversion and with little information beyond 10 years.
2.1.1 U C L A Gay and L esbian A ssociation
This is a prospeetively gathered cohort of homosexual and bisexual men recruited through UCLA (University of California Los Angeles) Gay and Lesbian Association and a local health club in the spring of 1982 and the summer of 1983. The majority of study participants showed no symptoms indicative of HIV infection at the time of enrolment and none had a frank illness. No-one had developed AIDS within 9 months of enrolment, which the investigators felt was justification for any enrolment bias, which may lead to faster progression rates, being small. Follow-up o f participants was nine-monthly.
Taylor et al estimated the date of infection with HIV for each person by using information on the earliest and last possible dates of infection. For persons who seroconverted after enrolment (i.e. ‘incident’ infections) the ‘earliest date’ was the date of the last HIV antibody negative attendance, and the ‘latest date’ was that of the first HIV antibody positive attendance. For persons who were already HIV antibody positive at enrolment (‘prevalent’ infections) the ‘earliest date’ was the latest of three dates: July 1977, the date of the first homosexual sex act, and the date of first living in Los Angeles. The ‘latest date’ for prevalent positive persons was the date o f their last visit unless they had presented with AIDS at that visit, in which case it was taken as a date six months earlier.
Table 2.1
A
summary of published studies of HIV progression rates in cohorts of homosexual and bisexual men
C ohort nam e M ain author C ountry (year o f publication) num ber
in analysis
C um ulative progression rate to A ID S (and
m edian tim e)
UCLA Gay & Lesbian Association Taylor USA (1986) 78 11% at 4 yrs
SFCC* Jason USA (1989) 117 33% at 7.5 yrs
SFCC Hessol USA (1989) 135 39% at 9.2 yrs
MACS Munoz USA (1989) 1861 21.8% at 5 yrs (10.7 yrs)
VLAS Schechter Canada(1989) 102 13% at 5 yrs
International Registry of Biggar USA, Canada, Australia, Europe 756 39.8% at 7 yrs Seroconverters*
Rutherford ^
(1990)
SFCC USA (1990) 489 54% at 11.1 yrs
VLAS Schechter Canada(1990) 119 36.6% at 6.3 yrs
UCLA Gay & Lesbian Association Kuo USA (1991) 81 45% at 8 yrs
LA MACS Taylor USA (1991) 908 33% at 7 yrs
SFCC Lifson USA (1992) 214 (9.7 yrs)
MACS Phair USA (1992) 345 10% at 4 yrs
Amsterdam Cohort Hendriks NL (1993) 348 33% at 7 yrs (9.2 yrs)
SFCC Buchbinder USA (1994) 588 69% at 14 yrs
Tricontinental Study Veugelers NL, Canada, USA, Australia (1994) 403 22.9% at 5 yrs (8.3 yrs)
VLAS H ogg"' Canada(1994) 364 55% at 11.5 yrs
Hep B cohorts Hessol USA, NL (1994) 362 62% at 12 yrs (10.2 yrs)
SEROCO^ Carré France (1994) 443 21.4% at 5 yrs
ISS* Rezza Italy (1990) 89 16.2% at 4 years
Transfusion Safety Study^ Operskalski U SA (1995) 112 36% at 8 years
Figure 2.1
Published progression rates from HIV seroconversion to AIDS from
cohorts of homosexual men
U1
Q
c_ o
CL
O c
□_
70
-40
-20
-0
-o -o
o o
o o o
o o o o
o
o o
o
o o
4 6 8 10
Time from s e r o c o n v e r s i o n ( y r s ) 12
14
Each symbol represents the AIDS progression estimate (at a given time since seroconversion) given by
Data censored at the end of June 1989 of 81 persons, of whom 20 had developed AIDS (24.7%) and 38 were lost to follow up (46.9%), gave cumulative progression rates to AIDS at 2 and 4 years following seroconversion similar to those previously reported by Taylor et al and with 45% of subjects developing AIDS 8 years following seroconversion (95% CI= 30%- 60%)
There was no evidence that age at seroconversion was associated with progression to AIDS. The authors noted, however, that almost all the participants were aged 18-30 years.
2.1.2 San Francisco City C linic Cohort- SFCC
The original cohort was comprised of 6705 men attending the hospital’s sexually transmitted disease clinic who in 1978- 1980 were recruited into studies o f the incidence and prevalence of Hepatitis B. In 1980- 1981 a sample o f these men (n=359; 34 from the Hepatitis B Prevalence Study and 325 from the Hepatitis B Incidence Study) were recruited into a clinical trial o f the efficacy of a plasma derived Hepatitis B vaccine.
Starting in October 1983, investigators attempted to contact all the original 6705 men with the view o f setting up an HIV cohort through the testing of sera left over from the Hepatitis B studies. 4043 men were still alive (of whom 2877 consented to their bloods being tested), 699 had died (for 675 of these stored bloods were tested), and 1963 were lost to follow up (and whose blood was not tested for HIV).
O f the 2877 men alive who consented to their bloods being tested 1431 (49.7%) were HIV negative and 1446 (50.3%) were HIV positive (223 prevalent (i.e. positive on all sera tested), 165 incident with an HIV test interval of 24 months or less, and 1058 incident with a test interval greater than 24 months).
The date of seroconversion was estimated as the mid-point between the last negative and first positive test dates for incident seroconverters, and was determined for those with prevalent infection using a probability estimate based on the men with negative dates.
Hessol et al analysed data on the subset of men who had been enrolled in the Hepatitis B vaccine trial in 1980-1. O f 359 men, 320 agreed to their stored bloods to be tested for HIV. O f these, 158 were HIV positive (20 prevalent and 138 seroincident). The 39 persons whose sera were not tested for HIV had either declined (n= 22) or had become lost to follow up (n= 17).
From data on 135 men who were either incident seroconverters and with a window of less than 25 months between test dates (n=117) or prevalent positive (n=18) censored in mid-May 1989, the authors estimated the cumulative rate of progression to AIDS 9.2 years after seroconversion to be 39% (95% CI= 27%- 51%), slightly lower than estimates given by UCLA study
There was no significant effect of age at seroconversion, race or calendar time of seroconversion on the rate of progression but as the cohort was fairly homogeneous with respect to those factors the ability to detect such differences may have been limited.
Three further publications reporting the analysis of data on men fi*om the larger Hepatitis B cohort gave faster progression estimates than that for the men in the vaccine trial.
Data on 489 men censored at the end of December 1989, analysed by Rutherford et al gave estimates of cumulative progression to AIDS at 5, 10, and 11.1 years following seroconversion of 13%, 51%, and 54% respectively.
Lifson et al analysed data on 214 men with laboratory measurements for CD4 cell counts, p-2 microglobulin, and p24 antigen levels available and who were without AIDS at the time of these laboratory measurements censored at the end of November
Data censored at the end of December 1992 on 588 men gave estimates of progression to AIDS 3, 10 and 14 years following seroconversion as 3%, 51% and 69% respectively^^.
2.1.3 A m sterdam cohort o f hom osexual men
This prospective cohort was set up in October 1984 and initially enrolled sexually active homosexual men who were community volunteers. Almost one third of these men were HIV positive when enrolled, a number of whom had been participating in a Hepatitis B vaccine efficacy trial and specimens of stored bloods were still available. From February 1985 the cohort started enrolling HIV negative men only. Follow up was 3 -6 monthly. By the end of February 1990, 1004 men had been enrolled in total o f whom 269 were already positive. Further, 79 men seroconverted while under follow up.
Analysis of data on these 348 positive men was censored at 1 February 1990 The dates of seroconversion for the 269 prevalent positive men were estimated using a probability density function for the expansion o f the observed part of the incubation assuming different distributions. The authors’ preferred estimate, which allowed for a slowing of the hazard rate at 7 years following seroconversion, gave a median time to AIDS of 9.2 years.
By October 1991, 108 men had seroconverted under follow up, of whom 28 had developed AIDS Keet et al evaluated the role of clinical symptoms and laboratory markers present during primary HIV infection on progression estimates and found that: the presence of fever and skin rash, absence of antibodies to HIV core proteins and having detectable p24 antigen at seroconversion were all independent predictors of progression to AIDS. The authors concluded that even at a very early stage of HIV infection it is possible to predict persons at high risk of rapid disease progression.
2.1.4 O ther H epatitis B vaccine cohorts
The men in the HIV study had consented to have their bloods tested for HIV in the early 1980s, some of whom were found to be prevalent HIV positive and others were with incident infection. The studies were in Amsterdam (n=74), New York City (n=120) and San Francisco (n=168).
Data were censored in 31 December 1991 with all those not known to have died being censored at that date. For the analysis of time to AIDS, New York men were censored at the date of last visit, the median time from seroconversion to the development of AIDS was estimated to be 10.2 years with a cumulative progression rate of 62% 12 years following seroconversion (95% CI= 53- 70%). More recent calendar time was associated with faster progression to AIDS with those observed in the period July 1989 to December 1991 having a relative hazard of 1.77 (95% CI= 1.01- 3.10) relative to the time period before 1987.
A slight increase in risk was observed with each 10-year increase in age at seroconversion (RH per 10 year increase = 1.31, 95% CI= 0.95- 1.80) though this was not statistically significant.
The median time from seroconversion to death was estimated to be 12.3 years (95% CI= 10.75- 12.75 years). Older age at seroconversion was associated with faster progression to death with a relative hazard of 1.65 (95% CI= 1.12- 2.41) for each 10 year increase in age. No evidence of a change in calendar time was observed, however, leading the authors to conclude that the expansion of the AIDS case definition in 1987, improved diagnostic methods and a lower diagnostic threshold by clinicians have resulted in an AIDS diagnosis being made at an earlier stage of HIV infection in more recent time periods.
2.1.5 V ancouver L ym phadenopathy AIDS Study -V LAS
Schechter et al reported on analyses of data on 348 men (246 prevalent positive and 102 ineident), who completed at least 2 visits during the period November 1982- November 1987, and censored in July 1988. Progression rates given are from the first antibody positive test for those seroprevalent (and will therefore under-estimate the time from seroconversion to AIDS) and from the mid-point of the negative and positive test dates for the sero-incident members.
Five years following seroconversion (for incident seroconverters), and following the diagnosis of HIV (for prevalent positive subjects), 23% (95% CI= 17.5- 28.5%) of prevalent positive subjects progressed to AIDS, compared to 13% (95% CI= 4.6- 21.4%) of those with incident infection. The factors found to be independent predictors of AIDS were: an elevated IgA level (> 20 mg/dl), low CD4 counts (< 400 cells /ml), and having more than 20 male partners from a high risk area (San Franeisco, Los Angeles, New York) in the 5 years previous to enrolment.
Schechter et al further reported on 18 men with incident HIV infection who had progressed to AIDS by July 1989 and were treated as ‘cases’ each with 3 randomly selected controls who had seroconverted within 3 months o f the case but who had not progressed to AIDS .
They concluded that abnormalities which are predietive of more rapid progression to AIDS appear early in HIV infection and estimated a progression rate to AIDS o f 36.6% (95% CI= 21.6- 51.6%) 76 months (6.3 years) after HIV seroconversion.
Hogg et al reported on 364 HIV positive men censored in December 1993 (234 prevalent and 130 incident infections). The cumulative progression to AIDS 11.5 years after seroconversion was estimated to be 55%. Progression rate to what was considered to be HIV-related death was estimated to be 45% at 11.5 years after seroconversion.
2.1.6 M ulticenter AIDS C ohort Study- M A C S
Baltimore and Pittsburgh) since mid-1984. O f these, 1745 were HIV antibody positive at enrolment.
In the first 4 years after enrolment, 268 men seroconverted to HIV. Munoz et al reported on findings from data on 1861 men (1628 seroprevalent with values on baseline haematological variables available, and 233 sero-incident with a maximum of 8 months between the negative and positive test dates). Seroconversion was estimated as the mid-point between antibody tests for those with incident infection, and markers of infection from the seroincident members of the cohort were used to estimate the time from infection for those seroprevalent.
Progression to AIDS 5 years after seroconversion was estimated to be 21.8% (95% CI= 16-25%), with a median estimate at 10.7 years (95% CI= 8.4-19.3 years).
Data on 345 men who seroconverted by July 1989 were analysed, o f whom 32 (9.3%) developed AIDS by March 1990 Estimated progression rates to AIDS, of 6% and 10% 3 and 4 years following seroconversion respectively, were much lower than those made by Munoz suggesting that either the time of seroconversion for the prevalent members of the cohort (not included in analysis by Phair et al) was estimated to be later than the actual date or the IPD had lengthened.
2.1.7 T ricontinental Seroconverter Study
Data on HIV positive homosexual and bisexual men who had seroconverted under follow up were pooled from the following 5 cohorts:
1. VLAS- Canada. 128 seroconverters from a group of 715 men recruited from 6 general medical practices in November 1982- December 1984.
2. SAPS- Australia. 74 seroconverters from a group of 1057 men recruited from private clinical practices in 1984-1985.
3. Amsterdam cohort study- Netherlands, 137 seroconverters from a group of 748 men, community volunteers, who were enrolled before February 1985 (thereafter only HIV negative men were enrolled).
4. San Francisco General Hospital (SFGHS)- USA. 19 seroconverters from a group of 462 men enrolled from 1983.
5. San Francisco Men’s Health study (SFMHS)- USA. 45 seroconverters from a group of 807 men.
Data on all 403 seroconverters were analysed By November 1992, 114 men were diagnosed with AIDS (28%), and 67 died. The mean age at seroconversion varied with the lowest (31 years) in Vancouver cohort and highest (35 years) in the San Francisco cohorts.
Progression to AIDS 3 and 5 years after seroconversion were estimated to be 6.2% (95% CI= 3.9- 9.1) and 22.9% (95% CI= 18.0- 27.9) respectively, and a median time of 8.3 years (95% Cl =7.4- 9.1) was estimated. This represents the shortest published median time to AIDS. No significant differences were found between the cohorts with respect to progression times to AIDS, and no age effect was found (RH per 10-year increase = 1.11, 95% CI= 0.85-1.46). Hazard rates to AIDS increased slightly over time to 1986 but were not statistically significant.
those who seroconverted in 1985 compared to those who seroconverted before 1984 (RH= 2.36, 95% CI= 1.00- 5.54). Use of prophylaxis was associated with a decreased risk whereas the use of AZT was associated with an increased risk, neither was found to be statistically significant however. Older age at seroconversion was associated with faster progression to death with a relative hazard of 1.50 (95% CI= 1.06- 2.11) for each 10-year increase in age.
2.1.8 H om osexual men in Sweden
All records of HIV infected homosexual men who had ever attended any of 3 participating clinical centres were reviewed including those who had been diagnosed with AIDS, became lost to follow up or had died. The medical records o f all 389 eligible men were retrospectively examined in mid- 1988. For 102 men the date of seroconversion could be estimated within a 12-month period either from the availability of a previous antibody negative test, from the patient’s history including the results of contact tracing, or from evidence of primary HIV infection.
By mid- 1988, 7 of the 102 seroconverters had developed AIDS giving a mean time to the development of AIDS of 97 months (8.1 years)
2.2 C O H O R TS OF H A EM O PH ILIA C S
O f great advantage to these cohorts o f infected haemophiliacs is that the rate o f loss to follow up is much lower than for other groups of infected individuals as they are undergoing clinical follow up for their clotting disorders in any case. As follow up is more complete than for cohorts of homosexual men, this may lead to estimates o f longer time to AIDS than for homosexual men (see Section 4.6.1).
Furthermore, the high rate of mortality among these individuals, for reasons associated with their clotting disorder, leads to slower estimates of progression to AIDS as those who die without the diagnosis of AIDS are censored at the time of death.
All haemophilia cohorts found a strong association between age at seroconversion and progression to AIDS and to death, with older persons having higher rates than younger individuals.
Table 2.2 summarises findings of the progression estimates from cohorts of haemophiliacs at their longest follow-up times. These are not directly comparable, however, as the progression rates given for the whole cohort will very much depend on its age profile.
2.2.1 U K H aem ophilia cohorts
The UK Haemophilia Centre Directors’ Organisation (UKHCDO) cohort of 1201 haemophiliacs with HIV alive on 1st January 1985 was retrospectively assembled in
1986. Stored sera were tested to establish when seroconversion was likely to have taken place. For 341 persons a sample was found to be negative to HIV antibodies. For those positive at the earliest available sample it was assumed that they were negative on 1 January 1979. In order to estimate the date of seroconversion for the whole cohort (regardless of the availability of negative sera) the authors assumed that no-one was positive before 1 January 1979 and that the probabilities of seroconverting per unit time within each of 3 defined calendar time periods from 1 January 1979 and 31 December 1987 were calculated according to a ratio (suggested from an initial analysis of the data) in which the cumulative distribution of infections was estimated using methods for interval censored data
Table 2.2
A summary of published studies of HIV progression rates in cohorts of
persons with haemophilia
M ain author C ountry num ber in C um ulative progression
(year o f publication) analysis rate to A ID S
Eyster USA (1987) 92 18% - 6 yrs
Giesecke Sweden (1988) 98 5% - 5 yrs
Darby UK (1989) I20I 7% - 5 yrs
Jason USA (1989) 79 27%- 7.5 yrs
Goedert USA (1989) 319 25.1% - 9 yrs
Darby UK (1990) 1201 13% at 7 yrs
Biggar USA, Canada, Australia, 297 27.3 % - 7 yrs (adults) Ragni
Europe (1990) 19.7% - 7 yrs (children)
USA (1990) 84 49% - 7.5 yrs
Schinaia Italy (1991) 499 12.8% - 7 yrs
Phillips
L ee*^
UK (1991) 63 (>30 yrs: 7 yrs)
UK (1991) 111 45% at 11 yrs
Chiarotti Italy (1994) 732 14.9-17.8%-8 yrs
Operskalski USA (1995) 519 24% at 8 yrs