University of South Carolina
Scholar Commons
Theses and Dissertations
12-14-2015
Genetic and Epigenetic Variations in Asthma and
Wheeze Illnesses
Todd M. Everson
University of South Carolina - Columbia
Follow this and additional works at:https://scholarcommons.sc.edu/etd
Part of theEpidemiology Commons
This Open Access Dissertation is brought to you by Scholar Commons. It has been accepted for inclusion in Theses and Dissertations by an authorized administrator of Scholar Commons. For more information, please [email protected].
Recommended Citation
Everson, T. M.(2015).Genetic and Epigenetic Variations in Asthma and Wheeze Illnesses.(Doctoral dissertation). Retrieved from
G
ENETIC ANDE
PIGENETIC VARIATIONS IN ASTHMA AND WHEEZE ILLNESSESby
Todd M. Everson
Bachelor of Science Colorado State University, 2006
Master of Public Health
Oregon Health and Science University, 2011
Submitted in Partial Fulfillment of the Requirements
For the Degree of Doctor of Philosophy in
Epidemiology
The Norman J. Arnold School of Public Health
University of South Carolina
2015
Accepted by:
Melinda Forthofer, Major Professor
Hongmei Zhang, Committee Member
John Holloway, Committee Member
Wilfried Karmaus, Committee Member
A
CKNOWLEDGEMENTSI gratefully acknowledge the guidance I received from my dissertation committee.
I am sincerely grateful to my committee chair, Dr. Melinda Forthofer, whose unwavering
support guided me through this process and encouraged me to frame my research within
the broader context of public health. I thank Dr. John Holloway, Dr. Hongmei Zhang and
Dr. Wilfried Karmaus for fostering my interests in epigenetics and for their assistance in
exploring unique statistical and methodological approaches for answering difficult
epidemiologic questions. Above all, I am truly appreciative of my entire committee for
their mentorship and their patience throughout this dissertation. I also would like to thank
the Isle of Wight research team, including S. Hasan Arshad, Ramesh Kurukulaaratchy,
Susan Ewart, Veeresh Patil, and Gabrielle Lockett, for all of the hard work they did in
developing the cohort, generating the data, and contributing to discussions about my
research.
I would also like to acknowledge the funding that made this research possible. We
thank the High-Throughput Genomics Group at the Wellcome Trust Centre for Human
Genetics (funded by Wellcome Trust grant reference 090532/Z/09/Z and MRC Hub grant
G0900747 91070) for the generation of the methylation data. The research reported in
this work was supported by the National Institute of Allergy and Infectious Diseases
under award number R01 AI091905 (PI: Wilfried Karmaus) and R01 AI061471 (PI:
A
BSTRACTAsthma, a chronic respiratory condition, is common worldwide with no cure and
limited effective prevention strategies. It is well recognized that asthma has a
multifaceted etiology, though many of the underlying mechanisms involved in asthma
development, persistence and remission are still convoluted. Epigenetic mechanisms,
such as DNA methylation, regulate gene-expression but are not related to changes in the
actual DNA sequence. Recently, differential patterns of DNA methylation within many
genes have been associated with asthma, particularly within genes involved in the
differentiation of pro-inflammatory T-helper 2 (Th2) cells. DNA methylation patterns
within less known biologic pathways undoubtedly are involved in asthma pathogenesis as
well. The purpose of this dissertation was three-fold. First, we explored whether genetic
and epigenetic variations within Th2-genes differed among persons with different
phenotypic presentations of wheeze illnesses. Second, we conducted an epigenome-wide
association study (EWAS) to identify novel DNA methylation loci associated with
asthma. Last, we conducted a follow-up study of our top EWAS findings, to investigate
whether the expression of the associated genes were predictive of infant wheeze.
We found that DNA-M within GATA3 and IL4 varied based on different
wheeze-illness phenotypes, suggesting that Th2-genes are under differential epigenetic regulation
for different presentations of asthma. We also identified nine novel DNA methylation
[intergenic], cg04359558 in LITAF, cg20417424 in ST6GALNAC5, cg19974715
[intergenic], cg01046943 in NUP210 and cg14727512 in DGCR14) associated with
asthma at age 18. For two of those genes (HK1 and LITAF), expression levels in cord
blood were predictive of infant wheeze. Interestingly, the observed methylation and
expression patterns of HK1 and LITAF could be consistent with increased resistance to
apoptotic signaling. Apoptotic-resistance among pro-inflammatory cells can increase the
duration of an inflammatory response and is affiliated with asthmatic pathophysiology.
Thus we may have identified under-studied genes and their epigenetic regulation, which
could play important roles in asthma pathophysiology. These genes may offer new
insights into the etiology of asthma, be investigated as potential targets for therapy, or be
considered for inclusion in algorithms used to predict early-life wheeze and later-life
T
ABLE OFC
ONTENTSACKNOWLEDGEMENTS ... iii
ABSTRACT ... iv
LIST OF TABLES ... viii
LIST OF FIGURES ...x
LIST OF SYMBOLS ... xi
LIST OF ABBREVIATIONS ... xii
CHAPTER 1:BACKGROUND ON ASTHMA AND EPIGENETICS ...1
1.1ASTHMA BACKGROUND ...1
1.2EPIGENETICS AND DNAMETHYLATION ...6
1.3OBJECTIVES ...9
CHAPTER 2:GENOME-WIDE DNA METHYLATION ASSOCIATION STUDY OF ASTHMA ...11
2.1INTRODUCTION ...11
2.2METHODS ...13
2.3RESULTS ...21
2.4DISCUSSION ...30
CHAPTER 3:EXPLORATORY STUDY OF GENETIC AND EPIGENETIC VARIATIONS ASSOCIATED WITH YOUNG ADULT WHEEZE CLUSTERS ...49
3.1INTRODUCTION ...49
3.2METHODS ...51
3.4DISCUSSION ...58
CHAPTER 4:CORD BLOOD EXPRESSION LEVELS OF THE NOVEL GENES, HK1 AND LITAF, PREDICT WHEEZE WITHIN FIRST OF LIFE ...72
4.1INTRODUCTION ...72
4.2METHODS ...74
4.3RESULTS ...79
4.4DISCUSSION ...83
CHAPTER 5:CONCLUSIONS AND FINAL REMARKS ...96
5.1SUMMARY OF AIMS 1 AND 3 ...96
5.2SUMMARY OF AIM 2 ...99
5.3FINAL REMARKS ...101
L
IST OFT
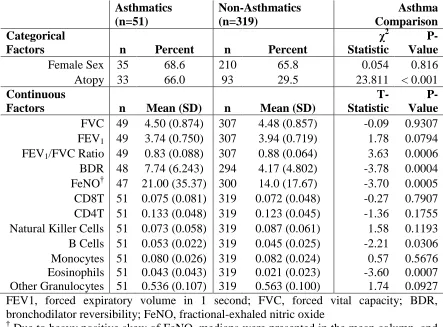
ABLESTable 2.1: Comparison of lung function and cell-type distributions between those with and without asthma in the overall epigenetic sub-sample ...36
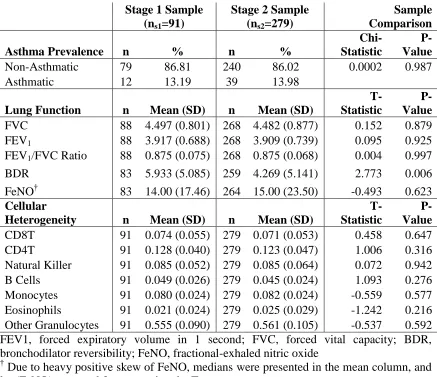
Table 2.2: Comparison of stage 1 and stage 2 samples for asthma variables and cell proportions ...37
Table 2.3: Stage 2 (ns2=279) – Crude logistic regression results for the sites within a 10% FDR. ...38
Table 2.4: Pooled Sample (n=370) – Crude and adjusted ORs for M-values predicting asthma status. ...39
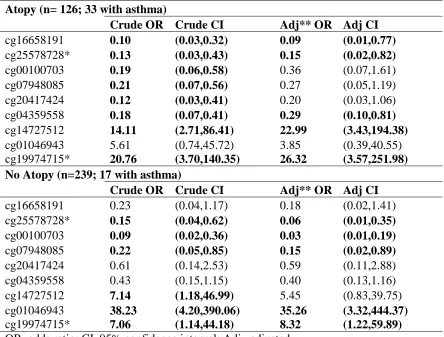
Table 2.5: Crude and adjusted ORs for M-values predicting asthma status stratified by atopy status, among the top nine sites. ...40
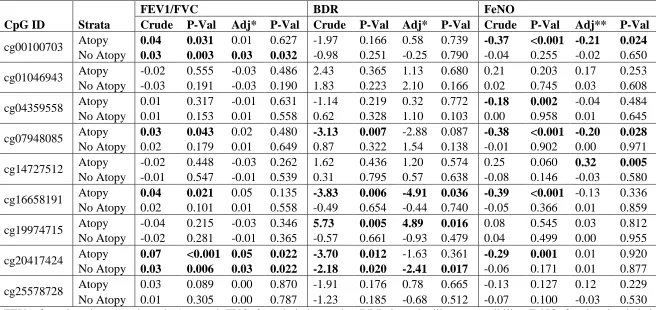
Table 2.6: Parameter estimates from linear regressions for measures of airway obstruction (FEV1/FVC), hyper-reactivity (BDR) and airway inflammation (FeNO) for the top 9 sites, stratified by atopy status. ...41
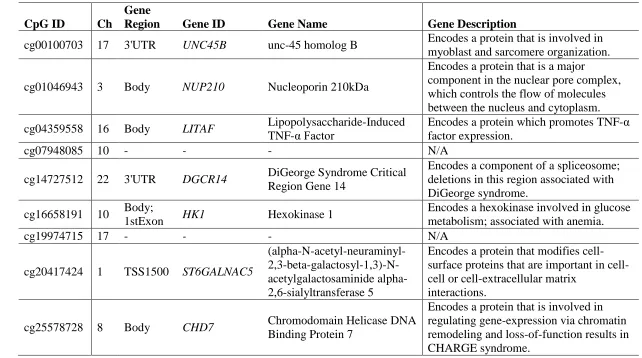
Table 2.7: Annotations and biological functions of genes associated with the nine CpG sites associated with asthma, independent of cellular heterogeneity and sex. ...42
Table 3.1: Prevalence and average values of physiologic, clinical, and symptomatic characteristics of the five wheeze clusters (n=75) ...63
Table 3.2: Proportions of genetic variants among selected Th2 SNPs within young adult wheeze clusters ...64
Table 3.3: Average DNA-M levels among selected Th2 CpGs within young adult wheeze clusters ...67
Table 4.1: Distribution of risk factors for infant wheeze and asthma, stratified by infant wheeze occurring apart from a cough or cold ...89
Table 4.2: Logistic regression results for cord blood gene-expression predicting wheeze within the first year of life ...90
Table 4.4: Spearman pairwise-correlation matrix of gene-expression levels in cord blood (n=80) ...92
L
IST OFF
IGURESFigure 2.1: Tracking of the misclassification rates (y-axis) across iterations (x-axis) of the
recursive RF feature selection ...43
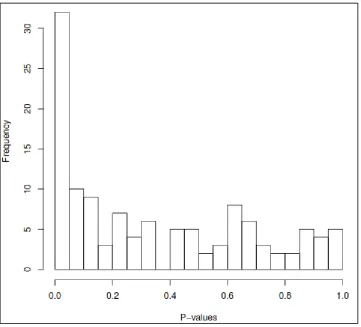
Figure 2.2: Histogram of P-values from 121 regressions in the stage 2 analyses ...44
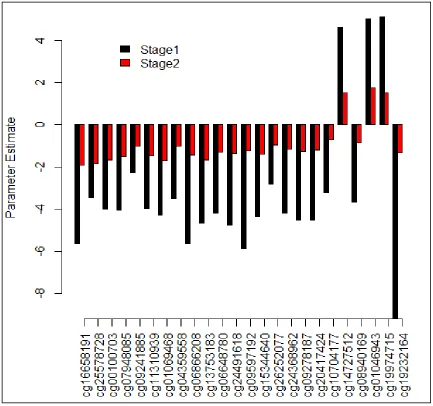
Figure 2.3: Comparison of parameter estimates from stage 1 and stage 2 logistic regression models, among the 24 sites within a 10% FDR in stage 2 analyses ...45
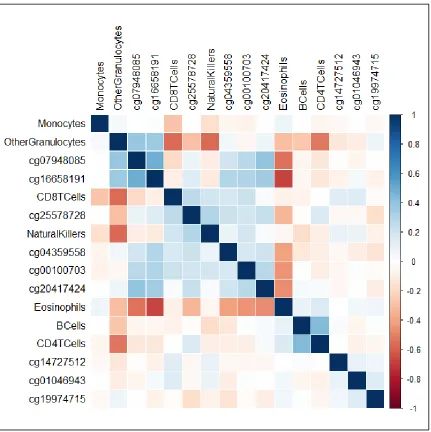
Figure 2.4: Correlation matrix of 9 CpGs associated with asthma, independent of cellular heterogeneity, and cell predicted cell proportions ...46
Figure 2.5: Correlation matrix of 15 CpGs associated with asthma, but confounded by cellular heterogeneity ...47
Figure 2.6: Cell and tissue morphology network, including seven genes with higher (red) or lower (green) methylation levels associated with asthma status ...48
Figure 3.1: LD Plot for GATA3...68
Figure 3.2: LD Plot for IL4R...69
Figure 3.3: LD Plot for IL4 and IL13 ...70
Figure 3.4: Conditional inference tree for classifying wheeze clusters with CpGs and SNPs that were nominally significant via ANOVA and Fisher’s Exact Tests ...71
Figure 4.1: Distribution of HK1 expression levels by any-wheeze-frequency ...94
L
IST OFS
YMBOLSβ Value of a parameter estimate from a regression model.
α Significance level used to determine statistically significant findings.
χ2
L
IST OFA
BBREVIATIONSBDR ... bronchodilator reversibility
BHR ... bronchial hyper-responsiveness
CpG ... cytosine-phosphate-guanine
DNA-M ... DNA methylation
EWAS ... epigenome-wide association study
FDR ... Multidrug Resistance
FeNO ... fractional exhaled nitric oxide
FEV1 ... forced expiratory volume in one second
FVC ... forced vital capacity
GWAS ... genome-wide association study
Ig ... immunoglobulin
IOW... Isle of Wight
LD ... linkage disequilibrium
MAF ... minor allele frequency
RF ... random forest
SNP ... single nucleotide polymorphism
SPT ... skin prick test
Th ... T-helper cell
TSS ... transcription start site
UTR... untranslated region
CHAPTER
1
B
ACKGROUND ONA
STHMA ANDE
PIGENETICS1.1 Asthma Background:
Asthma is a chronic respiratory disease often defined by reversible airway
obstruction, wheeze, bronchial hyper-responsiveness, and inflammation1. Many
molecular pathways influence the recruitment and the activity of different immune cells
during asthmatic symptoms, thus leading to heterogeneity in what triggers the symptoms
to occur as well as their severity and responsiveness to treatments1. Given the vast
heterogeneity in asthma, many possible phenotypes have been described. In fact, it is
unclear whether asthma is a single disease with multiple presentations, or instead several
different diseases, all with the common symptom of reversible restriction of the airways2.
Some characteristics allow for the distinction of common asthma sub-types. For
instance, those whose asthma symptoms are triggered by allergens (ie. pollen, cockroach,
mold, and dust mite) are often distinguished from those whose symptoms arise with no
apparent allergic triggers as “extrinsic” vs. “intrinsic” types1. Interestingly, there is also
some overlap in triggers for both extrinsic and intrinsic asthma. Both may be
symptomatic to exercise, cold air, and inhaled irritants3, suggesting some overlap in
common underlying mechanisms leading to exacerbations. Intrinsic asthma appears to be
more severe, as positive skin prick tests (SPTs) are less common in severe asthma
intrinsic3 but is more transient and responds better to treatment with corticosteroids1. The
exact distribution of extrinsic vs intrinsic asthma is unclear, although the majority of
asthmatics tend have the extrinsic characteristics of allergic sensitization such as high
serum immunoglobulin (Ig)E and/or positive SPT results3.
Aside from differences in triggers and allergic hypersensitivity characterized by
extrinsic vs. intrinsic phenotypes, asthmatics also may differ in many other characteristics
important in understanding disease progression such as age of symptomatic onset,
comorbidity with other allergic diseases (eczema and/or rhinitis), overall lung function,
responsiveness to inhaled corticosteroids (ICS) and other treatments, as well as markers
of airway eosinophilia such as fractional-exhaled nitric oxide (FeNO)4. These measures
inform us about the pathophysiology of asthma, but there is also heterogeneity in the
morbidity associated with asthma, such as frequency and severity of wheeze attacks, as
well as when wheeze disturbs sleep, limits speech, or limits exercise5. Thus, it is of great
importance to identify risk factors for the development, persistence, remission, and
relapse of different asthmatic phenotypes6.
Asthma Epidemiology:
The prevalence of asthma varies by many demographic characteristics: age, sex,
race, and socio-economic status (SES). The Centers for Disease Control and Prevention
(CDC) showed that between 2008 and 2010, the average annual prevalence of asthma in
the US tended to be higher in children than in adults, higher in females than males, higher
in blacks compared to other races, higher among Hispanics compared to non-Hispanic,
and higher among those in lower socio-economic groups7. The sex difference in asthma is
puberty, then tend to exhibit higher rates of remission, whereas females tend to have
higher incidence and prevalence as young adults6. Asthma severity parallels the same
sex-age-dependent pattern with males having more severe asthma in childhood and
females having more severe asthma in adulthood6.
Asthma, as well as other allergic diseases, have been increasing in prevalence
worldwide for decades and are some of the most common sources of chronic health
issues8,9, the Global Asthma Network estimates that as many as 334 million people are
affected by asthma10. Despite increasing global prevalence, region specific trends indicate
that asthma prevalence in many high-income countries has recently peaked, whereas
prevalence in low- or middle-income countries is still on the rise11. Despite the recent
decline in incidence, mortality, and health care utilization, the prevalence of asthma
symptoms remains high in high-income countries, ranging from 8.6-14.4%11. A recent
study in the UK found that new diagnoses of asthma have plateaued, but that the
lifetime-prevalence is still increasing12. In the US, the prevalence of asthma, which was only 3%
in the 1980s, steadily grew to 8.4% by 20107. The American Lung Association reports
that approximately 25.9 million people in the US had asthma in 2011 and an estimated
13.2 million (51% of those with asthma) had at least one asthma attack within the 12
months prior to the survey13. Asthma also generates a substantial burden on health-care
systems and was responsible for 10.6 million physician office visits and 2.1 million
emergency room visits in 2010 in the US alone13.
The prevalence of asthma symptoms was highly variable in low- or
middle-income regions, but in many cases was higher than that of high-middle-income countries, ranging
middle- income countries10. The increasing incidence of asthma in low- or
middle-income countries appears to be related to urbanization, which is expected to continue to
expand in most of these countries11. So it is possible that the increasing incidence of
asthma in low- and middle-income countries will actually accelerate in the years to come,
further increasing the already heavy global burden of asthma. High prevalence worldwide
and increasing prevalence in low- and middle- income countries means that millions of
people will continue to chronically medicate in order to prevent or relieve asthma
symptoms since there is no cure for this disease14.
Asthma Etiology:
Due to the increasing prevalence worldwide, research into asthmatic risk factors
and underlying mechanisms of disease received substantial focus. Yet, the etiology of
asthma is only partially understood, likely due to the multiple environmental and genetic
risk factors implicated in its pathogenesis and its complex symptomatic presentation2,15.
Although asthma is frequently defined by reversible airway obstruction, wheeze,
bronchial hyper-responsiveness, and/or inflammation, individual cases of asthma may
exhibit these characteristics and with varying frequency and severity2. Asthma has a large
heritable component16; yet, known genetic variations and heritable risk factors only
account for a small proportion of actual cases15. Also, identical twins are more likely to
both be asthmatic than fraternal twins, yet most identical twins with an asthmatic co-twin
are not affected by asthma, suggesting both genetic and non-genetic etiologies. Twin
studies have also shown that approximately one-third of the variation in age at onset of
asthma is due to genetic factors while the remaining two thirds are likely due to
elements in the pathogenesis of asthma, or its various phenotypes, which could then
become the targets for prevention or treatment.
Though it is well recognized that asthma has a multifaceted etiology, many of the
underlying mechanisms associated with asthma risk factors are still convoluted. Indeed,
many environmental and genetic components6,18 have been implicated as risk factors for,
or associated with, asthma. However, the only confirmed “cause” of the “underlying
asthma trait”, as opposed to triggers of asthmatic symptoms, is exposure to tobacco
smoke, prenatally, in childhood or in adulthood14. Studies of other possible “causes” have
produced conflicting evidence about their roles in the development of an underlying
asthma trait.
Potential environmental “causes” of asthma include pet ownership, living on a
farm, mold in homes, and antibiotic or paracetamol exposure in early childhood. Persons
with furry pets tend to have lower rates of asthma, though at least some of this
association appears to be driven by selective avoidance of pet-ownership by persons with
allergies19,20. Living on a farm has been observed as protective against the development
of asthma and other allergic diseases, possibly due to greater frequency and diversity of
microbial exposure leading to the development of a robust innate immune system ;
however, this is a hypothesized mechanism, the details of which remain unclear21. Mold
growth is more common in the homes of asthmatic children22, but most of these children
do not exhibit an allergic response to fungal molds, thus obscuring how this mechanism
could work10. Children that were exposed to antibiotics23 or paracetamol24 very early in
life are more likely to develop asthma, but this association may be a product of reverse
treatment for wheeze and infants with recurrent wheeze may already be pre-disposed to
developing asthma later in life23,25. Thus many of the environmental exposures that are
recognized as risk factors for asthma also have many questions surrounding whether or
not they are causally related to asthma.
Aside from possible environmental contributions to asthma risk, as many as 100
genes have been implicated in asthma etiology6,18. Many of these were identified using
genome-wide association studies (GWAS), which interrogate a large number potential
genetic risk factors with no prior knowledge about their possible relationships with
asthma26. Replication of these associations has been inconsistent and largely
unsuccessful18,26,27. A likely reason for the lack of consistent replication among GWAS is
that many of these studies were conducted within different populations which had
different rates of genetic variation at identified loci6. It is also likely that poor replication
could be due to lack of penetrance, in which some genetic causes may be necessary but
not sufficient risk factors for asthma27. Similarly, a genetic risk factor may only influence
the development of asthma under the correct environmental or epigenetic conditions as in
gene-environment and gene-epigenetic interactions18,26.
1.2 Epigenetics and DNA methylation:
Epigenetic mechanisms, consisting of DNA methylation (DNA-M), histone
modifications, and microRNAs (miRNA), are processes which influence gene-expression
that are independent of variations to the genetic sequence. The majority of epidemiologic
research into epigenetic mechanisms of disease has focused on DNA-M, the covalent
addition of a methyl group to a carbon at the 5-position of a cytosine residue that is
technological advancement allowing for fairly rapid, accurate and affordable
measurements28. Many of these studies utilize the Illumina 450K HumanMethylation
array29 because of its high-accuracy, expansive interrogation, and affordability, though it
is limited by biased measurement of CpG sites within promoter regions and CpG islands,
and that despite having high-throughput scale, it still only measures < 2% of the 28
million total CpG sites in human DNA30. Thus, studies with this array may be missing
key elements of the DNA-M profile that may still be important in the diseases under
study; however, this is currently the most appropriate array for conducting epidemiologic
research of DNA-M across the genome30. As new technology becomes more affordable
and more accurate, the field may switch toward sequencing technologies that measure
methylation at more, or even all, CpG sites.
Most early studies of DNA-M considered it to function as a silencer of gene
expression, potentially through the inhibition of transcription factor (TF) binding31. Since
its discovery as a regulator of expression, investigators have uncovered multiple effects
of DNA-M on expression depending on where the methylation occurs within the gene32:
(1) direct gene-silencing via promoter methylation, (2) interacting with or blocking
DNA-binding proteins, (3) repression of intragenic repetitive elements, and (4) influencing
alternative splicing via differential methylation at intron-exon boundaries. Complicating
the epigenetic landscape are the interactions between epigenetic mechanisms, and the
interactions between genetic and epigenetic variation. For instance, methylation at
particular sites can lead to histone modifications and vice versa33. Also, although
epigenetic modifications do not alter the genomic sequence, they can be influenced by
multi-factor interactions. These interactions between genetic variation and levels of DNA
methylation are referred to as methylation quantitative trait loci (methQTLs)34–36. Despite
these complex interacting mechanisms, DNA-M has been shown to have independently
important role in the regulation of gene expression and thus likely plays a role in many
complex diseases.
Role for Epigenetics in Asthma Etiology, a brief review:
Epigenetic mechanisms are known to play major roles in cellular differentiation
and immune cell activation33. DNA methylation biomarkers have been implicated in
airway inflammation37, immune cell fate, and asthma33. The majority of epidemiologic
research in this area has focused on candidate regions of the genome known to be
important in asthma pathogenesis, such as genes driving CD4+T cells toward Th2 rather
than Th1 phenotypes, an important polarization that occurs in asthmatics8. Such research
has shown that the loss of DNA-M, accompanied by histone modifications at Th2
cytokine loci (IL4, IL5, and IL13), promote a Th2 response whereas the presence of
DNA-M within the IL4 locus has been shown to promote a Th1 response38. Statistical
interactions between genetic variants and DNA-M within the genes for the IL4-receptor
(IL4R) and GATA Binding Protein 3 (GATA3), are also involved in Th2 polarization,
contribute to asthma risk in a potentially age-dependent pattern35,39. The majority of
strong associations between DNA-M and asthma have been observed within these and
other genes involved in T-cell differentiation40, though investigators have also found
associations related to specific characteristics of asthma such as FeNO and
bronchodilator responsiveness. Higher levels of FeNO were associated with lower levels
DNA-M plays an important role in the production of nitric oxide, which is an important
marker of airway inflammation and eosinophilic asthma. Others have shown that higher
levels of DNA-M within the promoter of the adrenoceptor β2, Surface (ADRB2), which
can induce relaxation of smooth muscle in the airways, have been associated with
decreased severity of dyspnoea and trended towards improved spirometry measures42.
Taken together, these findings indicate that DNA-M plays many roles in regulating
different biological pathways that are important in asthma etiology.
1.3 Objectives:
Purpose of the dissertation:
The overarching goal of this dissertation was to identify novel genetic and
epigenetic loci associated with asthma and complex wheeze phenotypes, and explore
whether a novel set of genes associated with young adult wheeze could also be predictive
of infant wheeze. We attempted to do this by conducting a genome-wide DNA-M study
of physician-diagnosed asthma, a cross-sectional study of Th2-path genetic and
epigenetic variations among complex wheeze phenotypes, and a prospective study of the
expression and DNA-M of a novel gene-set and infant wheeze.
Specific Aims:
1. Aim 1: To identify CpG loci associated with prevalent asthma at age 18 from a
genome-wide DNA methylation dataset with a two-stage design.
Research Question 1.1: What parameters in the recursive Random Forest (RF)
algorithm need to be changed from their default values?
Research Question 1.2: Stage 1 – What epigenetic loci are selected via
Research Question 1.3: Stage 1 – Was the site selection from recursive RF
feature selection confounded by cell-type proportions?
Research Question 1.4: Stage 2 – Which sites selected from Stage 1 can be
corroborated with multivariable logistic regression for their associations with
asthma status?
Research Question 1.5: Stage 2 – Are these sites associated with markers of
lung dysfunction or allergic inflammation of the lung?
Research Question 1.6: What are the biological functions of the genes that the
selected CpG sites are in?
2. AIM 2: To explore whether the combined genetic and epigenetic variation within an
asthma-associated pathway (ie. the Th2 path) can improve our classification of
asthmatic phenotypes at age 18.
Research Question 2.1: Are specific genetic and epigenetic variations in the
selected path able to classify different asthma phenotypes?
3. AIM 3: To identify whether the gene-set associated with our top DNA-M findings
from Aim 1 are differentially expressed in cord blood in relation to infant wheeze.
Research Question 3.1: How are gene expression levels related within the
selected gene-set?
Research Question 3.2: Which genes within the gene-set are differentially
expressed in cord blood samples in relation to wheeze within the one year of
birth?
Research Question 3.3: Which genes within the selected gene-set are
CHAPTER 2
G
ENOME-
WIDEDNA
METHYLATION ASSOCIATION STUDY OF ASTHMA2.1 Introduction:
Asthma is a common chronic respiratory disease affecting around 334 million
people worldwide13, causing substantial health care costs and morbidity-related
absenteeism14. Over the previous two decades, many studies have sought to characterize
the underlying mechanisms leading to the development and persistence of asthma. Yet,
the etiology of asthma remains only partially understood, likely due to its complex
physiology and the multiple environmental and genetic risk factors implicated in its
pathogenesis2,14.
Asthma is defined by multiple symptoms and characteristics such as airflow
obstruction, bronchial hyper-responsiveness and airway inflammation. However,
individual cases of asthma may exhibit only some of these characteristics and with
varying frequencies and severities. This dynamic leads some to hypothesize that asthma
is a diagnosis that encompasses multiple diseases, each of which may have its own
unique etiology and pathophysiology2,38. Also, asthma has a substantial heritable
component14,16, known genetic variations and heritable risk factors only account for a
small proportion of actual cases15.
Previous evidence suggests that asthma has no individual cause27; indeed, many
expression not related to changes in genomic sequence32, have received recent attention
in studies of asthma because these mechanisms are considered to be heritable and can be
altered via environmental exposures, particularly exposures that occur in utero14,38,43. One
of the most thoroughly studied epigenetic mechanisms is DNA methylation (DNA-M),
which is the covalent addition of a methyl group to the DNA at a cytosine residue that is
followed guanine (CpG site); this acts as an important regulator of gene transcription and
may influence alternative splicing32.
Recent work has shown that epigenetic mechanisms are important in regulating
the expression of pro- and anti-inflammatory cytokines, which drive T-cell differentiation
as well as the severity and duration of an inflammatory response44. Also a number of
association studies have found variations in DNA-M associated with asthma status40, lung
function45, and nitric oxide synthesis41. These studies have provided strong evidence that
epigenetic mechanisms play key roles in the biological processes that result in asthmatic
predisposition and the onset of symptoms. Thus further studies are necessary to reveal
key epigenetic elements in the pathogenesis and persistence of asthma, or its various
phenotypes, which can then become the targets for prevention or treatment.
We conducted an exploratory study aimed at identifying novel DNA-M markers,
from a genome-wide screening, which could be effective classifiers of current prevalent
asthma and which may reveal some of the underlying role that DNA-M plays in the
pathogenesis or persistence of asthma. Because asthma is heterogeneous condition, we
were also interested in learning whether some these markers were more strongly
specific phenotypic characteristics of asthma such as airway obstruction (FEV1/FVC
Ratio), bronchodilator reversibility (BDR) and fraction of exhaled nitric oxide (FeNO).
2.2 Methods:
The Isle of Wight birth cohort
The Isle of Wight (IOW) birth cohort was established to study the natural history
of asthma and allergies in children born between January 1, 1989 and February 28, 1990
in Isle of Wight, UK. The study was approved by the local research ethics committee
(now named the National Research Ethics Service, NRES Committee South Central –
Southampton B, 06/Q1701/34) and written informed consent was provided by the infants’
parents. Details about the birth cohort have been described in detail elsewhere46,47. After
exclusion of adoptions, prenatal deaths and refusals, 1,456 children were enrolled, and
followed-up at 1 (n=1,167; 80.2%), 2 (n=1,174; 80.6%), 4 (n=1,218; 83.7%), 10
(n=1,373; 94.3%), and 18 (n=1,313; 90.2%) years of age. At each follow-up, participants
were administered detailed questionnaires and evaluated for manifestations of allergic
disease. Questionnaires included the International Study of Asthma and Allergies in
Childhood (ISAAC)5 as well as study-specific questions about allergic disease and
relevant risk factors. At the 18 year follow-up, questionnaire data was obtained via
in-person interview (n=864; 66%), by telephone (n=421; 32%), or by mail (n=28; 2%).
Most of those who attended the follow-up visit in-person were also assessed via
spirometry, BDR, FeNO, and skin prick tests (SPTs). At this 18-year follow-up a random
subset of female (n=245) and male (n=125) participants were selected to take part in
Dependent Variables
The primary dependent variable for this study was dichotomous prevalent asthma
status (asthma vs. no asthma), determined by questionnaire. Participants were determined
to have asthma if they had an affirmative answer to “Have you ever had asthma?”, as
well as an affirmative response to either “Have you had wheezing in the last 12 months?”
or “Have you had asthma treatment in the last 12 months?”
Continuous measures of lung volume and airway obstruction were assessed via
spirometry at age 10 and 18 years. Lung function measurements were performed using a
Koko Spirometer and software with a desktop portable device (PDS Instrumentation,
Louisville, USA), according to American Thoracic Society guidelines 48,49. Prior to lung
function measurements children were required to be free from respiratory infection for 14
days and to not be taking oral steroids. In addition, they were required to abstain from
any beta-agonist medication for 6 hours and from caffeine intake for at least 4 hours.
Forced expiratory volume in one second (FEV1) measured the volume of air (in liters)
exhaled over the first second of a forced expiration done with maximal effort. Forced
vital capacity (FVC) was the total volume of air that could be expired after full
inspiration. The FEV1/FVC ratio was calculated by dividing FEV1 by FVC, and
represents the proportion of the vital capacity that an individual can expire over one
second, given maximal effort. BDR measured the percent change in FEV1, taken before
and after administration of 600 ng/ml salbutamol, which is a bronchodilator. Percent
change for BDR was calculated via pre-bronchodilator FEV1 minus post-bronchodilator
Fraction of exhaled nitric oxide (FeNO) is a marker of airway inflammation.
FeNO measurements (Niox mino, Aerocrine AB, Solna, Sweden) were obtained prior to
spirometric assessments and in accordance with American Thoracic Society (ATS)
guidelines. Expiratory flow against resistance was maintained at 50 ml/s to avoid
contamination of the airways. Participants with a current infection, as well as those with
asthmatic symptoms or treatment (with antibiotics or oral steroids) within the previous
two weeks, were rescheduled for a later date. Because the distribution of FeNO was
heavily positively skewed, all parametric analyses were performed with log-transformed
FeNO, which better approximated a normal distribution.
Atopy status, was assessed by skin prick tests (SPT) administered via a standard
method50 with a battery of 11 allergens. Food allergens tested were cows’ milk, hens’
egg, peanut and cod. Inhalant allergens tested were house dust mite, cat, dog, Alternaria
alternata, Cladosporium herbarium, grass pollen mix, and tree pollen mix. Histamine
and saline acted as positive and negative controls, respectively (Alk-Abello, Horsholm,
Denmark). Positive SPTs were defined as having a mean wheal diameter of 3 mm greater
than the negative control; if the positive control yielded a diameter less than 3mm, the
test was deemed inconclusive. Participants with at least one positive SPT were defined as
atopic, while those with no positive SPTs were defined as not having atopy.
Data Collection and DNA Methylation
Blood samples for epigenetic screening were collected at the 18 year follow-up,
DNA was extracted from whole blood using a standard salting out procedure 51. DNA
concentration was determined by the PicoGreen dsDNA quantitation kit (Molecular
thymine conversion using the EZ 96-DNA methylation kit (Zymo Research, CA, USA),
following the manufacturer's standard protocol. Genome-wide DNA methylation was
assessed using the Illumina Infinium HumanMethylation450K BeadChip (Illumina, Inc.,
CA, USA), which interrogates >484,000 CpG sites, regions of DNA where a cytosine
nucleotides are followed by a guanine nucleotide, associated with approximately 24,000
genes. The BeadChips were scanned using a BeadStation, and the methylation levels (
value, described below) were calculated for each queried CpG locus using the
Methylation Module of BeadStudio software. Arrays were processed using a standard
protocol as described elsewhere52, with multiple identical control samples assigned to
each bisulphite conversion batch to assess assay variability and samples were randomly
distributed on microarrays to control against batch effects.
Data Cleaning
The program for data cleaning was written in R (R Development Core Team,
2012). Quality control (QC) measures were employed to improve the reliability of data
prior to analysis. In our study, the detection P-value reported by BeadStudio (Illumina
software to process raw intensities) was used as a QC measure of probe performance.
Probes whose detection P-values > 0.01 in >10% of the samples were removed53. The
methylation data were then preprocessed and technical variations removed via
peak-correction using the Bioconductor IMA (Illumina methylation analyser) package54.
Dropping control probes and probes with poor detection P-values yielded 383,998
remaining probes; since males and females were studied together, CpGs on sex-specific
(X and Y) chromosomes were dropped. The arrays were processed in three different
to adjust for inter-array variation55. A very conservative approach was utilized for
addressing systematically biased probes. We also excluded all probes with SNPs that had
a minor allele frequency (MAF) > 1.0% in European populations (or any population if
European-specific MAF was not available) and within 10 nucleotides of, or directly at,
single base extension via dbSNP13756, resulting in a final set of 248,336 CpGs for
analysis. Dropping this large set of potentially biased probes was necessary because the
variable selection method depends on a conditional variable importance metric, which
means that the selection of biased probes could adversely affect the selection of
other-unbiased probes.
Methylation levels for each queried CpG were calculated as beta () values.
These represent the proportions of methylated probes for each specific CpG site and can
be interpreted as percent methylation. The β values close to 0 or 1 tend to suffer from
severe heteroscedasticity57. The β values were utilized for RF, described below, which is
a non-parametric method and does not assume a normal distribution. However, for
parametric statistical analyses, we utilized M-values which address the issue of
heteroscedasticity and were calculated via log2(β / (1-β))57. Because M-values expand the
distribution of the methylation levels, they may emphasize outliers; thus when using
M-values, strong outliers were recoded as missing. Potential outliers were identified using
adjusted boxplots and a coefficient of 2.5 via the robustbase package in R.
Random Sampling: Stage-1 vs Stage-2
The epigenetic sample was randomly divided into two independent sub-samples.
To create the stage-1 sample, 25% of participants with asthma and 25% of participants
discovery data set (nS1=91). The stage-2 validation data set (nS2=279) included all
samples not selected into the discovery data set. To improve the likelihood that findings
selected from stage-1 could be validated in stage-2, we compared the prevalence of
asthma and gender, as well as the mean values for airway obstruction and inflammation
across the two sub-samples. Differences in prevalence of asthma or gender, between the
stage-1 and stage-2 samples, were assessed with Pearson’s Chi-squared tests. Students
T-tests were used to determine whether the mean values of continuous variables differed
between the stage-1 and stage-2 samples. The specific analyses utilized within each stage
are detailed below.
Stage 1 (nS1=91) – Recursive RF feature Selection
For stage-1 we conducted recursive RF feature selection 58,59 described below. RF
is a non-parametric machine learning technique that can deal with substantially large
numbers of predictors (p) relative to the number of samples (n), it is robust to outliers and
noise, and it naturally incorporates conditional effects into the model via recursive binary
partitioning without needing to specify interactions a priori 60. The RF algorithm has
been thoroughly described elsewhere60,61. Briefly, this algorithm produces a series of
classification trees, grown from bootstrapped training samples with replacement; each
participant’s outcome status is predicted from the aggregate of all trees in which they
were not part of the training sample. We used ‘balanced sampling’, by specifying by the
sampsize parameter, to draw the same number of observations from the minority class
and majority class for each bootstrap sample, so that each individual classification tree
was grown from a balanced sub-sample58. We also altered the parameters for the number
trees to grow in the forest (ntree = 7500) due to sparsity in the data and to produce stable
VIMs, respectively.
We effectively implemented the RF algorithm recursively as a means of reducing
the size of the data62. For the recursive RF feature selection we (1) ran the RF algorithm
on all available predictors via the randomForest package in R63, (2) extracted out-of-bag
(OOB) misclassification rates and the variable importance measures, (3) sorted the
predictors by their variable importance measures (VIMs), (4) excluded half of the
predictors with the smallest VIMs, and (5) repeated the sequence until the stop criteria
was met. Our stop criterion was a leveling-off of the asthma-specific misclassification
rate; this would indicate that the predictors contributing noise to the RF classifications
had been effectively excluded and the remaining predictors offered some ability to
distinguish between asthmatics and non-asthmatics. Predictors that remained once the
stop criteria were met were then annotated with relevant genetic information and
analyzed for significant associations with asthma in the stage-2 validation sample.
Stage 2 (nS2=279) – Validation Tests in Independent Sample
The methylation levels for the selected CpGs were then converted to M-values as
previously described, then tested for crude association with asthma status via logistic
regression. The p-value distribution was then investigated via histogram, to determine
whether small p-values from the validation tests were likely due to random chance. We
generated q-values to estimate the false discovery rate (FDR)64 using the qvalue package
in R65. Sites from the stage-2 analyses that were within a 10% FDR were then selected as
our positive findings. We then validated that the direction (positive vs. negative) of the
parameter estimates for the selected sites for both stage-1 and stage-2 logistic regression
models. Any sites that did not show the same direction of association were excluded from
our positive findings.
Stage 3 (N=370) – Characterization of Findings
Post-hoc analyses were then conducted on the positive findings from stage-2
analyses, in the full sample. We assessed whether the odds of higher average methylation
was greater among asthmatics compared to non-asthmatics using logistic regression.
Potential confounders (sex and cell-type proportions from blood samples) were
determined a priori. Due to logistical constraints, complete blood counts (CBC) were not
possible for our participants, thus we predicted cell type proportions of CD8T cells,
CD4T cells, natural killer cells, B-cells, monocytes, eosinophils and other granulocytes66
using constrained projection67,68 via the minfi package in R69. To determine whether the
observed associations with asthma were driven by any confounding factors, we produced
three logistic regression models for each CpG site with asthma status as the dependent
variable and M-values as the independent variable, while including: (1) no additional
covariates for Model 1, (2) confounders associated with asthma status via t-tests as
adjustment covariates for Model 2, and (3) all potential confounders identified a priori as
adjustment covariates for Model 3. CpG sites that retained independent associations with
asthma, after adjustment for confounders, were considered as our top findings.
As a post-hoc analysis, we investigated whether our top findings between
DNA-M and asthma were also associated with some continuous measures of airway
obstruction, reversible airway obstruction, and airway hyper-reactivity commonly used in
conduct these analyses, we implemented Model 1 (crude) and Model 3 (adjusted) linear
regression models for each of the above dependent variables. Also, because the
underlying biological mechanisms leading to airway obstruction may differ between
those with allergic- versus non-allergic-asthma, we conducted a sensitivity analysis to see
whether the observed associations differed between those with and without atopy. For
these analyses we conducted Model 1 (crude) and Model 3 (adjusted) regressions
(logistic for asthma status, and linear for FEV1/FVC, BDR, and FeNO), stratified by
atopy status. Normal values of FEV1, FVCare dependent on age, sex, and height, thus all
statistical analyses utilizing these, or combinations of these, measures included sex and
height as adjustment covariates (all participants were matched on age by study design).
Last, to understand the functionality of the selected CpG sites, pathway analysis
was performed on the genes annotated to CpG sites that were internally validated in
stage-2. Where a CpG site was annotated to more than one gene, all annotated genes were
included in the list. Three CpGs were not annotated to any gene, so were not included in
pathway analysis. The resulting list of 22 asthma-associated genes and their parameter
estimate values was submitted to Ingenuity Pathway Analysis software (IPA, Qiagen),
using default analysis parameters. The networks tool was used to find gene expression
networks containing multiple differentially methylated genes.
2.3 Results:
All participants were 18 years old at the time of epigenetic screening for DNA-M
and ascertainment of physician diagnosed asthma status. Within our sample, 13.9%
(n=51) of participants were asthmatic, meaning they had received an asthma diagnosis
asthma medication within the previous 12 months. The majority of our sample was
female (66.2%), and there was no difference in the proportion of males and females
between asthmatics and non-asthmatics. Asthmatics had substantially higher prevalence
of concurrent atopy, determined by SPTs, (66.0% vs 29.5%; χ2 P-value < 0.0001) (Table
2.1). We also compared a number of lung function measures, markers of airway
reactivity, and proportions of circulating cell-types, between asthmatics and
non-asthmatics. On average, there was no difference in FVC (means: 4.50 vs 4.48; T-test
P-value = 0.93), but asthmatics had lower FEV1 (means: 3.74 vs 3.94; T-test P-P-value =
0.079), lower FEV1/FVC Ratio (means: 0.83 vs. 0.88; T-test P-value = 0.0006) greater
BDR (means: 7.74 vs. 4.17; T-test P-value = 0.0004) and greater FeNO (medians: 21.0 vs
14.0; T-test P-value = 0.0005).
Because methylation measurements were obtained from peripheral blood samples,
and persons with asthma likely have different circulating blood compositions than those
without asthma, we also compared the proportions of cell types between asthmatics and
non-asthmatics as estimated using the Houseman method 67,68. On average, those with
asthma had significantly greater proportions of circulating B-Cells (0.053 vs 0.045; T-test
P-value = 0.028) and eosinophils (0.043 vs 0.021; T-test P-value = 0.0007) when
compared to those with asthma, but only minor differences for all other cell-types.
To conduct the genome-scale DNA-M screening, this study first implemented a
supervised feature selection on DNA-M sites from the Illumina 450K microarray
(stage-1), then validated associations between DNA-M and asthma status for the set of selected
features (stage-2), and lastly tested the validated sites for their associations with asthma,
heterogeneity and sex (stage-3). To implement this design, the full data set (N=370) was
randomly divided into two independent sets: a stage-1 sample (nS1=91) used for feature
selection and a stage-2 sample used for validation testing (nS2=279). Prior to running the
stage-1 analyses, we compared the stage-1 and stage-2 samples to ensure that
randomization was effective for important variables: prevalence of asthma, prevalence of
female sex, average values for airway obstruction and airway hyper-reactivity, as well as
average cell-type proportions (Table 2.2). Only BDR was significantly different between
stage-1 and stage-2 samples (4.99 vs. 3.58; T-test P-value = 0.006).
Stage 1 Results (nS1=91) – Recursive RF feature Selection
The RF feature selection was implemented on the stage-1 sample, with a starting
set of 248,336 CpG sites. This was a four step process which utilized RF to sort the
predictors by their VIMs, then dropped least informative predictors in recursive
iterations; each iteration reduced the set of predictors by 50%, until all uninformative
predictors had been excluded. The overall forest’s ability to predict asthma in the
discovery sample was tracked across all iterations. We observed a leveling-off of the
misclassification rates at the 12th iteration, corresponding to zero misclassification of
asthmatics and 1% misclassification of non-asthmatics in the stage-1 sample (Figure 2.1).
This iteration included 121 CpG sites as possible predictors, which were annotated with
relevant genetic information and included in the supplemental materials. The forest
grown in the 12th iteration of stage-1 was then used to predict asthma status of stage-2
participants, with very poor accuracy (Sensitivity=20.5% & Specificity=92.9%).
The low sensitivity was likely due to the recursive RF data reduction over-fitting
with asthma and over-fitting the cut-points of truly associated sites used to distinguish
asthmatics from non-asthmatics in the stage-1 sample. To determine which of the
selected sites were likely to be truly informative for asthma, the selected sites were then
tested for their crude associations with asthma status via logistic regression in the stage-2
sample.
Stage 2 Results (nS2=279) – Validation Tests in Independent Sample
The p-values for the crude associations exhibited a strong left peak with positive
skew (Figure 2.2), indicating that the small p-values were unlikely to be purely chance
findings. Thus q-values were generated for the 121 crude tests, 24 of which were
associated with asthma (P-value range: 0.000045 – 0.027) at a FDR of 10% (Table 2.3).
For all of these 24 sites, the direction of the association was the same for stage-1 and
stage-2 logistic regression models (Figure 2.3). The majority of these sites were
negatively associated with probability of asthma: for 21 (87.5%) of the validated sites,
asthmatics were more likely to have lower average methylation levels than
non-asthmatics; asthma was associated with higher average methylation for only 3 validated
sites (12.5%). Given that these 24 sites were selected from 1 and validated in
stage-2, for both direction of association and statistically significant FDR q-values, they were
selected as candidate CpGs for follow-up analyses to better understand their associations
and potential roles in asthma.
Stage 3 (N=370) – Characterization of Findings
The remaining analyses utilized methylation data from all participants (N=370),
to provide the most accurate estimates of the relationships between DNA-methylation at
models (Model 1) for each of the 24 sites with asthma status as the dependent variable
and M-values as the independent variable. As expected, all sites had strong crude
associations with asthma (negative OR range: 0.09 to 0.34; positive OR range: 7.99 to
9.51) and 95% CIs that excluded the null for all.
Then we added the proportions of eosinophils and B-cells, which were present in
greater proportions among asthmatics (T-test P-values = 0.0007 and 0.0396,
respectively), as covariates to the regression models (Model 2) for each site. We found
that the majority of the ORs attenuated towards the null and 14 (58.3%) of the confidence
intervals crossed the null, indicating that these sites were not independently associated
with asthma, and may instead represent markers of eosinophils or B-cells. However, 10
sites retained independent associations with asthma after adjustment (negative OR range:
0.13 to 0.35; positive OR range: 8.96 to 10.56).
Last, we added in overall cellular heterogeneity (proportions of CD8T cells,
CD4T cells, B-cells, monocytes, natural killer cells, eosinophils, and other granulocytes)
and sex as covariates (Model 3). After adjusting for sex and proportions of all predicted
cell-types, only one more site lost statistical significance: 15 (62.5%) of the 95%
confidence intervals crossed the null. Given the potential dependence of associations
between DNA-M and asthma on overall cellular heterogeneity67,70 and sex71, as well as
the consistency of our results between Model 2 and Model 3, we considered the 9 sites
that retained independent associations with asthma in Model 3 as our top positive
findings. Lower average methylation levels were independently associated with increased
probability of asthma at cg25578728 in CHD7 (Model 3 OR = 0.109 (0.034, 0.333)),
(Model 3 OR = 0.177 (0.059,0.502)), cg07948085 [intergenic] (Model 3 OR = 0.280
(0.095, 0.784)), cg04359558 in LITAF (Model 3 OR = 0.352 (0.172, 0.694)), and
cg20417424 in ST6GALNAC5 (Model 3 OR = 0.353 (0.118, 0.998)). Whereas higher
average methylation levels were independently associated with increased probability of
asthma at cg19974715 [intergenic] (Model 3 OR = 8.785 (2.536, 31.879)), cg01046943
in NUP210 (Model 3 OR = 9.626 (2.229, 43.439)) and cg14727512 in DGCR14 (Model
3 OR = 10.464 (3.021, 38.637)). One site, cg19232164 in REXO2, retained independent
associations with asthma in Model 2 (OR = 0.254 (0.065,0.936)) but not in Model 3 (OR
= 0.281 (0.073, 1.073)).
To investigate which cell-types were the strongest confounders of our observed
associations we generated two correlation matrices of: (1) pair-wise correlations of
predicted cell proportions and the 9 sites with independent associations for Matrix 1
(Figure 2.4), as well as (2) pair-wise correlations of predicted cell proportions and the 15
sites that were confounded by cellular heterogeneity for Matrix 2 (Figure 2.5).
Interestingly, although all 9 sites in Matrix 1 showed strong associations with asthma
independent of cellular heterogeneity, methylation levels at some of these sites were still
moderately or even strongly correlated with proportions of eosinophils. For instance,
cg16658191 was moderatetostrongly correlated with proportions of eosinophils (r=
-0.67) while cg07948085 (r= -0.54), cg20417424 (r= -0.46), and cg00100703 (r= -0.44)
were moderately correlated with proportions of eosinophils. All other sites in Matrix 1
only exhibited weak correlations (|r| < 0.40) with any cell proportions. Although
proportions of B-cells differed between those with and without asthma, methylation
proportions but all were strongly negatively correlated with eosinophil proportions. CpG
sites in Matrix 2 exhibited very weak correlations with any of the other cell-type
proportions, indicating that eosinophils were likely driving the majority of confounding
from cellular heterogeneity.
Because the underlying biological mechanisms leading to asthmatic symptoms
may differ between those who have allergic hypersensitivity and those who do not, we
conducted a sensitivity analysis to determine whether the associations between DNA-M
and asthma differed between those with and without atopy among our top 9 findings.
Persons with atopy were far more likely to be asthmatic than persons without atopy
(26.2% vs. 7.1%). Also circulating cell-mixture showed larger differences between
persons with and without asthma, among those with atopy: asthmatics had lower
estimated proportions of natural killer cells (0.06 vs 0.08; T-test P-value = 0.0096) and
higher estimated proportions of both B-cells (0.06 vs 0.05; T-test P-value = 0.0211) and
eosinophils (0.05 vs 0.03; T-test P-value = 0.0027). However, among those without
atopy, there were no significant differences for any estimated cell-type proportions
between those with and without asthma. We also compared whether measures of airway
obstruction (FEV1/FVC Ratio), reversible airway obstruction (BDR), and airway
hyper-reactivity (FeNO) were differed between those with and without atopy. As expected,
higher log-FeNO was associated with asthma, but only among those with atopy (T-test P
-value = 0.006), whereas FEV1/FVC ratio and BDR were associated with asthma among
participants with (T-test P-values: 0.0153 and 0.0045, respectively) and without (T-test
Crude logistic regression models, stratified by atopy status (Table 2.5), revealed
that all sites were strongly associated with asthma among persons with atopy, except for
cg01046943 in NUP210; while 6 of the 9 sites were associated with asthma among those
without atopy. After adjusting for sex and cellular heterogeneity cg16658191 in HK1
(ORAtopy = 0.09 (0.01,0.77)), cg04359558 in LITAF (ORAtopy = 0.29 (0.10,0.81)), and
cg14727512 in DGCR14 (ORAtopy = 22.99 (3.43,194.38)) were only associated with
asthma among persons with atopy; cg00100703 in UNC45B (ORNo-Atopy = 0.03
(0.01,0.19)), cg07948085 [intergenic] (ORNo-Atopy = 0.15 (0.02,0.89)), and cg01046943 in
NUP210 (ORNo-Atopy = 35.26 (3.32,444,37)) were only associated with asthma among
persons without atopy; both cg25578728 in CHD7 (ORAtopy = 0.15 (0.02,0.82); and OR
No-Atopy = 0.06 (0.01,0.35)) and cg19974715 [intergenic] (ORAtopy = 26.32 (3.57,251.98); and
ORNo-Atopy = 8.32 (1.22,59.89)) were associated with asthma, irrespective of atopy status.
Finally, cg20417424 in ST6GALNAC5 was not associated with asthma within either
atopy-strata after adjustment for sex and cellular heterogeneity, though the CI only barely
crossed the null among those with atopy (ORAtopy = 0.20 (0.03,1.06)). These findings
provide evidence that there may be some shared epigenetic regulation (or dys-regulation)
involved in asthmatic processes, but also that there are likely some epigenetic alterations
that are unique to allergic and non-allergic asthma, respectively.
We next investigated whether the top 9 sites were associated with various
measures of overall airway obstruction (FEV1/FVC ratio), reversible airway obstruction
(BDR), and airway hyper-reactivity (FeNO), stratified by atopy status (Table 2.6).
Because the established normal values for FEV1 and FVC are dependent on age, height
BDR. Higher average methylation levels at cg00100703 in UNC45B were associated with
increased FEV1/FVC ratio (beta = 0.03 P-Value = 0.032), among those without atopy,
and with decreased average log-FeNO (beta = -0.21 P-Value = 0.024) among those with
atopy. Higher average methylation levels at cg07948085 [intergenic] were associated
with lower FeNO (beta = -0.20 P-Value =0.028), but only among those with atopy. Also,
higher methylation levels at cg14727512 in DGCR14 were associated with higher
log-FeNO (beta = 0.32 P-Value = 0.005) among those with atopy. Higher methylation levels
at cg16658191 in HK1 were associated with lower BDR (beta = -4.91 P-Value = 0.036),
but only among those with atopy. Higher methylation levels at cg19974715 [intergenic]
were associated with increased BDR (beta = 4.89 P-Value = 0.016), only among those
with atopy. Lastly, higher methylation levels at cg20417424 in ST6GALNAC5 were
associated with increased FEV1/FVC ratio , both for those with (beta = 0.05 P-Value =
0.022) and without (beta = 0.03 P-Value = 0.022) atopy as well as decreased BDR (beta =
-2.41 P-Value = 0.017) only among those without atopy.
The functional analyses for the 22 genes submitted to IPA revealed five
statistically significant canonical pathways related to trehalose degradation II (P-value =
3.41E-03), GDP-glucose biosynthesis (P-value = 6.80E-03), glucose and
glucose-1-phosphate degradation (P-value = 7.93E-03), UDP-N-acetyl-D-galactosamine
biosynthesis II (P-value = 1.02E-02), and CDP-diacylglycerol biosynthesis I (P-value =
1.80E-02). Interestingly, the top network associated with our gene list, Cell Morphology,
Tissue Morphology, Cellular Development, (Figure 2.6) included 7 of the 22 genes from
2.4 Discussion:
Asthma was prevalent in 13.8% of our epigenetic sub-sample; the majority of
which had atopy (66%) and on average had normal FEV1/FVC (mean = 83%), though
lower than non-asthmatics, high BDR (mean = 7.74 L), and high FeNO (median = 21.00
log(ppb)). Using a unique feature-selection technique and two-stage design, we identified
24 CpG sites within a 10% FDR associated with asthma-status at age 18; nine of which
had associations with asthma, atopy-specific asthma, airway obstruction, reversible
airway obstruction, and/or airway hyper-reactivity, independent of cellular heterogeneity
and sex. Gene annotations for these nine sites (Table 2.7) revealed that all of our top
findings were novel, as none of the genes encompassing these CpG sites had been
previously implicated in studies of asthma; though many of them are involved in
biological processes that may be important in asthma pathogenesis and persistence. Many
of the top sites were within genes involved in a network that influences cell and tissue
morphology. The present findings require replication in other cohorts with larger
samples.
Three of these CpG sites were most strongly associated with asthma among
persons with atopy: cg16658191 within the body (or 1st exon) of hexokinase 1 (HK1),
cg14727512 within the 3’UTR of DiGeorge Syndrome Critical Region Gene 14
(DGCR14) and within the 1st exon of testis-specific serine kinase 2 (TSSK2), and
cg04359558 within the body of lipopolysaccharide-induced TNF-α factor (LITAF).
Among persons with atopy, methylation levels at cg16658191 were also associated with
BDR, a measure of reversible airway obstruction, and methylation levels at cg1427512
hexokinase-1 which is integral in glucose metabolism, provides resistance to
TNF-induced apoptotic signals72, and mutations within this gene have been associated with
hemolytic anemia in mice73. Eosinophils of asthmatics not on corticosteroids74 and
activated T-cells of atopic asthmatics75 have been shown to be resistant to apoptotic
signals resulting in prolonged pro-inflammatory activity, though many aspects of the
molecular mechanisms involved in this resistance are still unclear75. DGCR14 is thought
to encode for a component of a spliceosome. Deletions at or near this gene have been
implicated in the etiology of DiGeorge syndrome, a heterogenous developmental disorder
that often is characterized by T-cell deficiency and/or craniofacial malformations76. Also
of note, increased expression of DGCR14 has been shown to up-regulate IL17α, thus
promoting Th17 cell differentiation77, and Th17 cells have been implicated for their roles
in non-atopic and steroid-resistant asthma78. LITAF, which has primarily been studied in
mouse models, encodes for a protein that is expressed in response to lipopolysaccharide
(LPS) challenge, and forms a complex with STAT6B which then up-regulates the
transcription of monocyte chemoattractant protein-1 (MCP-1)79 and tumor necrosis factor
alpha (TNF-alpha)80. Both MCP-1 and TNF-alpha are pro-inflammatory cytokines, and
thus over-expression could lead to prolonged inflammatory states79,80.
Another three sites were most strongly associated with asthma among those
without atopy: cg07948085 [intergenic], cg01046943 within the body of nucleoporin
210kDa (NUP210), and cg00100703 within the 3’UTR of unc-45 homolog B (UNC45B).
Interestingly, despite these sites being most strongly associated with asthma among
persons without atopy, cg07948085 and cg00100703 were associated with FeNO among