ISSN 2348 – 7968
Real Time Abnormal Situation Detection Based On
Crowd Motion Characteristics
Rukkumani VP
1
P
, Kiruthika BP
2
Assistant Professor, Department of Electronics and Instrumentation Engineering, Sri Ramakrishna Engineering College, Coimbatore, IndiaP
1
Student, Department of Control and Instrumentation Engineering, Sri Ramakrishna Engineering College, Coimbatore, India P
2
Abstract
The ability to detect unusual or abnormal event is one of
the most important issue to be addressed in the development
of intelligent surveillance systems. In particular, abnormal
situation detection in crowded scenes is a challenging
problem due to the potential complexity of a situation. As
network video technology has improved, the cost of installing
a surveillance system has dropped significantly, leading to an
exponential increase in the use of security cameras. This
paper aims at detecting the abnormal event of people at
crowded scenes on the road side. Image processing system is
capable of identifying human that can be used for
surveillance applications to monitor the unusual human
behavior. The unusual behavior of the human can be detected
based on comparison of sequence of frame for a certain time
period. The first few frames of the video are used to estimate
the background image and the pixels that represent the people
are separated from the pixels that represent the background.
Pixel that represents the people is detected as abnormal
situation image and that image is converted into gray scale
image. From the gray scale image particular area is extracted.
The moving persons can be tracked from the bounding boxes
around each person.
Keywords: Comparison of frames, Object identification,
Extraction of Particular Area, Object Detection and Tracking.
1.Introduction
A typical video surveillance system employs a number of
networked cameras and with the development of new
technology. The input is given as video and it is converted
into sequence of frames. Auto correlation is the technique
used to compare between two frames of images. The detected
abnormal rgb image is converted into gray scale image. A
gray scale digital image is an image in which the value of
each pixel is single sample that carries only intensity
information. This grayscale image is also known as black and
white, which is composed exclusively of shades of gray
varying from black at the weakest intensity to white at the
strongest. rgb to gray scale conversion of image will
eliminate the hue and saturation information while retaining
the luminance.
Analyzing with a large number of variables generally
requires a large amount of memory. So that the input data
with large number of variables will be transformed into a
reduced representation with set of features. Feature extraction
is the special form of dimensional reduction. The particular
area from the detected image is extracted for further
processing. In the segmentation subsystem, the Auto
threshold block uses the difference in pixel values between
the normalized input image and the background image to
determine which pixels correspond to the moving objects in
the scene.
The detection subsystem merges the individual bounding
boxes so that each person is enclosed by a single bounding
box. In the Tracking subsystem, the Kalman Filter block uses
the locations of the bounding boxes detected in the previous
frames to predict the locations of these bounding boxes in the
current frame. The Kalman Filter block is used to reduce the
effect of noise in the detection of the bounding box locations.
Because Kalman Filter block reduces noise, the bounding
box positions are calculated by the tracking subsystem have
smoother trajectories than those calculated by the detection
subsystem.
2.Related Work
To classify abnormal events in crowds, normal behaviors
of frame is extracted and deviations from those frames are
detected and tracked. The abnormal situation is like car
accident on road side, over crowd on escalator, shopping
malls.
InP
[2]
P
Spatio-temporal grid-based framework is used to deal
with the complexity of structured and unstructured motion
flows that can effectively group optical flows in the field of
view into crowds.Measures motion features including the
speed and direction of moving objects based on a
spatio-temporal grid-based approach for flow representation. Crowd
flux analysis to detect abnormal events in crowded scenes
using the crowd motion characteristics including the particle
energy and the motion directions.
A novel unsupervised learning frameworkP
[6]
P
to model
activities and interactions in crowded and complicated
scenes. Three hierarchical Bayesian models were used: the
ISSN 2348 – 7968
Hierarchical Dirichlet Processes (HDP) mixture model, and
the Dual Hierarchical Dirichlet Processes (Dual-HDP) model.
Directly using existing LDA and HDP models, only moving
pixels can be clustered into atomic activities. These models
can cluster both moving pixels and video clips into atomic
activities and into interactions.
A new technique of crowded objects motion analysis
(COMA) to deal with crowded objects scenes which consists
of three parts: background removal, foreground segmentation
and crowded objects density estimation. A combination
approach of Lucas-Kanade optical flow and Gaussian
background subtraction is proposed to obtain optimal
foregrounds.
3. Process Methodology
The input video is converted into the sequence of
frames. Original image that is without any abnormal event
is extracted and it is compared with the other sequence of
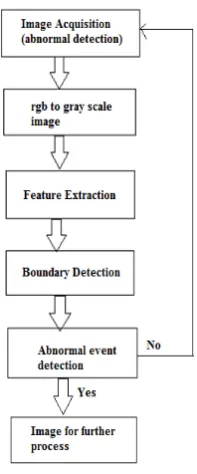
frames using auto correlation technique. Fig 3.1 illustrates
the process flow diagram of the abnormal event detection.
Initially the abnormal event frame is detected and
converted into gray scale image. Processing of rgb image
takes long time to process. A gray scale digital image is an
image in which the value of each pixel is single sample
that carries only intensity information. This grayscale
image is also known as black and white, which is
composed exclusively of shades of gray varying from
black at the weakest intensity to white at the strongest. rgb
to gray scale conversion of image will eliminate the hue
and saturation information while retaining the luminance.
Fig 3.1: Process Flow Diagram of Abnormal Situation
Detection
From the gray scale image particular area is extracted to
detect the abnormal event on the particular area. Feature
extraction is the special form of dimensional reduction.
Because processing large amount of data generally requires
large amount of memory and also takes more time to process.
So the gray scale image is converted into set of features.
Boundary detection is used to assign border for moving
persons in the extracted image. It assigns unique color for
each person to identify moving person in that images. From
the boundary detected imageabnormal event is obtained and
enhanced.
4. Model Description
The abnormal event of people during crowd on road side
can be detected and tracked using following block diagram
fig 4.1. This block detects and tracks people in a video
sequence with a stationary background using the following
process:
• Use the first few frames of the video to estimate the background image.
• Separate the pixels that represent the people from the pixels that represent the background.
• Group pixels that represent individual people
together and calculate the appropriate bounding
box for each person.
• Match the people in the current frame with those
in the previous frame by comparing the bounding
boxes between frames.
Fig 4.1: Block Diagram of Abnormal Situation Detection
The function of each block in the above figure is explained
below. From the multimedia file, video is given as the input.
Data type is given as infinity. Multimedia files can contain
audio, video or audio and video data.
4.1 Background Estimator Subsystem
Under each block in the above block diagram has its
subsystem. Background estimator block is used to estimate a
background without any abnormal situation on the image.
From the sequence of frames stationary background image is
ISSN 2348 – 7968
The subsystem block consists of median, buffer, reshape
blocks. Initially the input is given as triggered input to the
subsystem. Then it is reshaped by changing the dimensions
of the input signal to Row vector (2-D). The output of row
vector is given to the buffer block which converts scalar
samples to a frame output at a lower rate. Median block is
used after the buffer block. It is used to compute the median
value along the specified dimension of the input or across
time (running median). The output from the median is given
to frame conversion block. It is used to set sampling mode of
the output signal.
4.2 Segmentation Subsystem
The Segmentation subsystem, the Auto threshold block
uses the difference in pixel values between the normalized
input image and the background image to determine which
pixels correspond to the moving objects in the scene. Initially
the image with foreground and background is given to the
luminance block to reduce the intensity of the image. Then
Abs block is used to set the accurate value of the image. Next
to that block is auto threshold block which is used to convert
the intensity of the image to binary image.
From the auto threshold block EMetric output is given to
the compare to constant2 block which is to determine how
the signal compares with the constant signal. The BW output
is given to the overwrite value block to overwrite selected
portion of the input matrix to either submatrix or full
diagonal. Then the output of overwrite and comparison block
is given to the switch. The switch has 2 is control port where
1 and 3 are data ports. The switch pass through input 1 when
input 2 satisfies the selected criterion otherwise pass through
input 3. Auto threshold block converts an intensity image to
binary image. This uses otsu’s method which determines the
threshold by splitting the histogram of the input image.
4.3 Detection Subsystem
The detection block it will convert the background of
gray scale image black and white color and detect the moving
persons during the abnormal situation on road side. The
detection block contains the subsystem, in which the close
block merges object pixels that are close to each other to
create blobs. For example, pixels that represent a portion of a
person’s body are grouped together. Next, the blob analysis
block calculates the bounding boxes of these blobs. In the
final step, the detection subsystem merges the individual
bounding boxes so that each person is enclosed by a single
bounding box.
The image is given to the merge target pieces into blobs
block which is used to perform morphological closing on an
intensity or binary image. Uses the Neighborhood or
structuring element parameter to define the neighborhood or
structuring element that the block applies to the image. The
output of merge block is given to the blob analysis block
which calculates the bounding boxes of these blobs. The
output from the blob is given directly to the merge blob block
and also to the probe block detects whether the signal is
complex or not. Blob analysis is used to compute the
statistics for connected regions in the binary image. Selector
block is connected next to the probe to select or reorder the
specified elements of input. The input to the threshold and
enable in merge blob is constant. The merge blobs belonging
to the same target block merges individual bounding boxes so
that each person is enclosed by single bounding box.
4.4 Tracking
The tracking block uses gray scale image directly to track
the moving persons during the abnormal situation. In the
Tracking subsystem, the Kalman Filter block uses the
locations of the bounding boxes detected in the previous
frames to predict the locations of these bounding boxes in the
current frame. To determine the locations of specific people
from one frame to another, it compares the predicted
locations of the bounding boxes with the detected locations.
This enables to assign a unique color to each person. The
tracking system also uses the Kalman Filter block to reduce
the effect of noise in the detection of the bounding box
locations.
4.4.1 Kalman Filter
The most overlap target image output from the target
block is given to the recorder which reorders the current
target to match order from the previous sample time. The
Kalman filter is a recursive predictive filter that is based on
the use of state techniques and recursive algorithms. It
estimates the state of a dynamic system. This dynamic
system can be distributed by some noise, mostly assumed as
white noise. To improve the estimated state the Kalman filter
uses measurements that are related to the state but distributed
as well.
Thus the Kalman filter consists of two steps.
1.Prediction
ISSN 2348 – 7968
This block uses previously estimated state to predict the
current state. It can also use the current measuremet and the
predicted state to estimate the current state value. All the
filters have the same transition matrix, measurement matrix,
initial conditions and noise covariance but their state,
measurement, enable and MSE signals are unique.
In the first step the state is predicted with the dynamic
model. In the second step it is corrected with the observation
model so that the error covariance of the estimator is
minimized. In this sense it is said to be an optimal estimator.
This procedure is repeated for each time step as initial vlue.
Therefore the kalman filter is called a recursive filter. The
basic components of kalman filter are the state vector, the
dynamic model and the observation model.
4.5 Display System
The Detected window shows, the people in the scene are
surrounded by bounding boxes. The result assigns each
bounding box a color based on the order that each person is
detected. For example, the first person detected has a red
bounding box and the second person detected has a green
box. The color of these boxes changes because the people in
the scene are not tracked. In the Tracked window, each
person has a unique bounding box color for the duration of
the video.
The edit parameters block is used to plot the coordinates of
the bounding boxes over time. The coordinates of each
bounding box are defined by the row and column location of
its upper-left corner as well as its width and height.
Accordingly, each person in the video corresponds to four
lines in the plot. Because the Kalman Filter block reduces
noise, the bounding box positions calculated by the Tracking
subsystem have smoother trajectories than those calculated
by the Detection subsystem.
Uses the target tracking threshold parameter to specify the
maximum distance a target can travel between two
consecutive frames. The distance is defined as Distance=
abs(2*(c1-c2)+(w1-w2)+abs(2*(r1-r2)+(h1-h2))/ (h1+h2). R
and c are the coordinates of the top-left corner of the target
and w and h are its width and height.
5. Results
Based on the simulation, results were studied and
analyzed. The results are taken from two different videos.
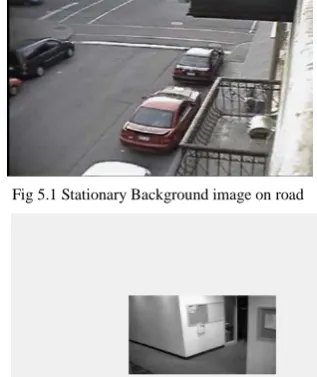
From the sequence of frames a stationary background image
is extracted and compared with the remaining frames. The
stationary background image is shown below in fig 5.1.
Fig 5.1 Stationary Background image on road
Fig 5.2 Stationary background image in confidential room
This stationary background image is compared with the other
sequence of frames and abnormal situation image is detected
in below fig 5.3.
Fig 5.3 Abnormal situation detection
Processing the rgb image of abnormal situation detection
takes more time to process and large memory is required to
store the pixels. So rgb image is converted into gray scale
image as shown in the fig 5.4.
Fig 5.4 Converted gray scale image
From the gray scale image particular area is extracted i.e
abnormal situation area in the below fig 5.5.
ISSN 2348 – 7968
People in the extracted image are detected and tracked using
bounding boxes to each person in the image. In the detected
image there is high noise present as shown below in fig 5.6.
Fig 5.6 Detected image on road side
Fig 5.7 Detected image in confidential room
To remove the high noise present in the detected image
Kalman filter is used and track the persons in that particular
image. The tracked image is shown in the below fig 5.8.
Fig 5.8 Tracked image on road side
Fig 5.9 Tracked image in confidential room
6. Conclusion and Future Work
Thus the abnormal situation is detected during crowd on
side as well as in confidential room is simulated. The output
of the detection subsystem leads to poor rsults with noise and
complex trajectories. So by using Kalman filter the tracked
image will give better results with smooth trajectories.
When applying this proposed method the quality of the
image is increased. In future this method will be
implemented in the real time abnormal situation detection to
get high accuracy in image at the output.
Acknowledgement
First and foremost I place this project work on the feet of
GOD almighty who is the power of strength in each step of
progress towards the successful completion of phase I
project.
Words are inadequate in offering my thanks to
Mrs.V.Rukkumani, M.E., Assistant Professor(Sr.G),
Department of EIE-UG, for her encouragement and
cooperation in carrying out the project work. Finally, I would
like to express my heartfelt thanks to my beloved parents for
their blessings, my friends, teaching and non-teaching staffs
of my department for their help and wishes for the successful
completion of this project.
References
1. Yunyoung Nam, Sangjin Hong(2014), “ Real-time
abnormal situation detection based on particle
advection in crowded scenes”, Journal Real-Time
Image Proc.
2. Nam,Y.(2013a),“Crowd flux analysis and
abnormal event detection in unstructured and
structured scenes”, Multimed. Tools Appl. pp. 1–
29.
3. Nam, Y., Rho, S., Park, J.,(2013),“Inference
topology of distributed camera networks with
Multiple cameras”, Multimed. Tools Appl.67(1),
pp.289-309.
4. Nam, Y., Rho, S., Park, J.,(2012)“ Intelligent
video surveillance system: 3-tier context-aware
surveillance system with metadata”, Multimed.
Tools Appl. 57, pp. 315–334.
5. M. Valera and S.A. Velastin (2011), “Intelligent
distributed surveillance systems: a review”,
Multimed Tools Appl , 57,pp.315–334.
6. Li, W., Wu, X., Zhao, H.A.(2011), “New
techniques of foreground detection, segmentation
and density estimation for crowded objects
motion analysis”. Journal of information
processing 19, pp.190–200.
7. Wang, X., Ma, X., Grimson, W.E.L.(2009),
“Unsupervised activity perception in crowded and
complicated scenes using hierarchical bayesian
models”, IEEE Trans. Pattern Anal. Mach. Intell.
31, pp.539–555.
8. Juan Pav’on, Jorge G’omez-Sanz, Antonio
Fern’andez-Caballero, Juli’an J.
Valencia-Jim’enez (2007), “ Development of intelligent
multisensor surveillance System with agents”,
Robot Auton. Syst. 55(12), pp.892-903.
9. Zhang.D., Gatica-Perez.D., Bengio.S.,
ISSN 2348 – 7968
hmms for unusual event detection”, In IEEE
Computer Society Conference on Computer
Vision and Pattern Recognition, vol. 1, pp. 611–
618.
10. Valera.M, Velastin.S (2005),“Intelligent
distributed surveillance systems: a review”, In
IEEE Proceedings on Vision, Image and Signal
Processing, vol. 152(2), pp. 192–204.
11. Bruhn, A., Weickert, J., Kohlberger, T., Schn’rr,
C.(2005b), “Discontinuity preserving computation
of variational optic flow in real time”, In: Scale
Space and PDE Methods in Computer Vision, pp.
279–290. Springer, Berlin.
12. Duong, T., Bui, H., Phung, D., Venkatesh, S.
(2005), “Activity recognition and abnormality
detection with the switching hidden semimarkov
model”, In: IEEE Computer Society Conference
on Computer Vision and Pattern Recognition,
CVPR, vol. 1, pp. 838–845.
13. Black, M.J, Anandan, P. (1993), “A framework
for the robust estimation of optical flow”, In:
Proceedings of Fourth International Conference
on Computer Vision, pp. 231–236. IEEE press,
New York.
14. Barron, J., Fleet, D., Beauchemin, S., Burkitt, T.A
(1992), “Performance of optical flow techniques”,
In: Proceedings CVPR ’92, IEEE Computer
Society Conference on computer vision and
pattern Recognition, pp.236-242.