Article
1
Polycyclic Aromatic Hydrocarbons in Soil Samples
2
from Diboll, East Texas (USA)
3
Kefa K. Onchoke 1*, Jorge J. Ojeda 1,2,3, Michael A. Janusa 1
4
1 Department of Chemistry & Biochemistry, Stephen F. Austin State University, Box 13006 – SFA Station,
5
Nacogdoches, Texas, 75962-3006
6
2 Texas Department of Public Safety, https://www.dps.texas.gov, Breath Alcohol Laboratory, 5805 N. Lamar
7
Blvd, Austin TX, 78752
8
3 Texas Department of Public Safety, https://www.dps.texas.gov, Lufkin Office, Breath Alcohol Laboratory,
9
2809 S John Redditt Dr Lufkin, TX 75904.
10
*Corresponding author: KKO: Tel: (936) 468-2386; Fax: 936-468-7634; E-mail address: [email protected]
11
Abstract: Concentrations of six polycyclic aromatic hydrocarbons (benzanthrone,
12
benz[a]anthracene, chrysene, fluoranthene, pyrene, and triphenylene) of soil samples from Diboll,
13
an East Texas city (USA), were analyzed with gas chromatography-mass spectrometry (GC-MS).
14
Samples were collected from five sites; Old Orchard Park, two heavy traffic intersections (Judd
15
Street and Lumberjack Drive), an industrial site (West Borden Drive), and a truck stop. Acetone and
16
dichloromethane extracts in all samples showed the presence of fluoranthene and pyrene. The sum
17
of fluoranthene and pyrene concentrations in sites followed the order West Borden Drive > Judd
18
Street > Lumberjack Drive > Old Orchard Park > truck stop. Concentrations of fluoranthene and
19
pyrene were in the range 12.3 – 396.5 μg kg-1 (ppb) and 13.6 – 209.8 μg kg-1 (in dry soil), respectively.
20
Benzanthrone, benz[a]anthracene, chrysene, and triphenylene concentrations were < 2 ppb levels.
21
The higher concentrations in soils were associated with sites close to heavy traffic and vehicular
22
emissions.
23
Keywords: Soil; PAHs; Diboll; fluoranthene; pyrene; gas chromatography-mass spectrometry
24
25
1. INTRODUCTION
26
The increased use of fossil fuels raises global concerns that stem from environmental
27
contaminations [1]. Of particular note are polycyclic aromatic hydrocarbons (PAHs), environmental
28
pollutants that exhibit health hazardous risks including carcinogenic and/or mutagenic effects to
29
humans and other organisms [2-5]. PAHs are produced mainly by oil derivatives and high
30
temperature processes. Because of the toxic properties of PAHs and their mutagenicity, extraction
31
methods have been developed for quantitation of PAHs in water, soil and air particulates [6][7-10].
32
The United States Environmental Protection Agency (USEPA) [10] has classified PAHs into
33
various categories based on their mutagenic and carcinogenic effects [11]. Of the sixteen priority
34
PAHs, seven are classified as human carcinogens by the International Agency for Research on Cancer
35
(IARC, benzo[a]anthracene, benzo[a]pyrene, benzo[b]fluoranthene, benzo[k]fluoranthene, chrysene,
36
dibenzo[a]anthracene, and indeno[1,2,3-c,d]pyrene) or as non-carcinogenic (acenaphthene,
37
acenaphthylene, anthracene, benzo[g,h,i]perylene, fluoranthene, fluorene, naphthalene,
38
phenanthrene, and pyrene). The ubiquitous and persistent nature of PAHs in environmental matrices
39
such as soils, makes humans directly or indirectly exposed to PAHs.
40
Ninety percent of PAHs in the environment accumulate in soils, which acts as a sink for
41
atmospheric deposition [13]. Besides, other possible sources of PAHs in soils include disposal and/or
42
use of wastewater sewage sludge, urban run-off and cultivation of crops using compost or fertilizers
43
[13, 14]. The analysis of PAHs, especially the 16 priority PAHs in soils have been investigated in the
44
USA and the world. The analysis of soils and sediments for PAHs reflect the contamination sources
45
and concentrations, and the anthropogenic inputs into the environment [15].
46
Various methods including supercritical fluid extraction, microwave-assisted solvent extraction,
47
Soxhlet extraction, ultra-sonication, and mechanical agitation [7, 16, 17] are often used for extracting
48
PAHs from soil and sediment. Some disadvantages of Soxhlet method include the large amount of
49
solvent used for extraction and reflux time. Up to 150 mL of solvent may be used for a 10 g soil
50
extraction with a reflux time of 24 hours per solvent system [17], while other researchers have used
51
50 mL for 8 hrs [17]. Reports show that Soxhlet extractions may produce gas chromatograms with
52
artifact peaks, in addition to humic substances and n-alkanes co-extracted along with PAHs [18, 19].
53
Ultra-sonication uses the acoustic energy of ultrasonic waves to create rapid compression and
54
rarefaction of fluid movement [16]. Advantages of ultra-sonication include decreased extraction
55
times of 30 – 60 minutes per extraction, decreased sample size (~1 g), and reduced solvent usage [20].
56
Sun et al. [21] showed that ultra-sonication methods yielded PAHs at higher efficiencies than Soxhlet
57
method. However, prolonged exposure to irradiation from ultra-sonication might degrade the PAHs
58
[22]. In addition, ultra-sonication requires additional work-up which consists of centrifugation or
59
filtration prior to collection of the supernatant mixture.
60
Mechanical agitation uses a mixing action to agitate the soil samples, via magnetic stirring or
61
placement of the soil/solvent mixture on a rotary shaker. Mechanical agitation, however, requires
62
additional work-up such as centrifugation or filtration of the extract. Published reports show
63
mechanical agitation to yield low PAH extraction efficiency (< 75%) compared to Soxhlet or
ultra-64
sonication methods (> 95%) [17, 18]. The reported low efficiencies are however for short extraction
65
times of 5 minutes and 10 mL of solvent. Increased extraction times, sample sizes, and solvent
66
normally increases the extraction efficiency [23]. Because of ease of use of method, and minimal
67
glassware requirements, mechanical agitation was utilized for the extraction of six PAHs
68
(benzanthrone (BA), benz[a]anthracene (BaA), chrysene (CHR), fluoranthene (FLT), pyrene (PY),
69
triphenylene (TP)) in soil samples from Diboll, Texas (See Scheme 1).
70
The aim of the present study was to determine concentrations of six PAHs (BA, BaA, CHR, FLT,
71
PY, TP, shown in Scheme 1) from top soils close to the Highway-69 (a major highway) and industrial
72
sites collected from Diboll, a city in East Texas, USA, using gas chromatography-mass spectrometry
73
(GC-MS). The choice of the six PAHs was based on their reported abundancies (FL and PY), their ring
74
structures (4 rings) and their mutagenic potencies to animals. While BaA is a carcinogen [24], it is the
75
nitrated, hydroxyl, and other metabolites of BA, BaA, CHR, FLT, PY, TP that are known carcinogens
76
or mutagenic substances [25-34]. Thus, the monitoring of PAHs in the environment is essential for
77
the planning of sound environmental actions, evaluating potential health risks posed to humans and
78
organisms. This research is essential to understanding the sources and apportionment of PAHs from
79
a busy traffic passing through a major highway.
80
81
A: Fluoranthene (FLT) B. Triphenylene (TP) C: Chrysene (CHR)
82
D. Benzanthrone (BA) E. Benz(a)anthracene (BaA) F. Pyrene (PY)
84
Scheme 1. Structures of six PAHS studied in Diboll soils.
85
2. EXPERIMENTAL DETAILS
86
2.1. Study Site and Soil Sample Collection
87
Diboll city is located in Angelina County, East Texas (USA) at latitudes N 31.1861/-94.781 and
88
longitudes W 94.7854. The city is ~ 110 miles northeast of Houston and has a population ≈ 5,500. Five
89
sampling sites (Figure 1), namely, Old Orchard Park, an intersection of Lumberjack Drive with U.S.
90
Highway-59, the intersection of Judd Street with U.S. Highway-59, a truck stop site, and West Borden
91
Drive, were selected for the study. The selection of sites (especially intersections and truck stop) was
92
based on their close proximity to Highway-59 and the frequent traffic of from diesel vehicles. The
93
West Borden Drive site, which is in close proximity to four industrial locations and railroad lines, is
94
near an industrial area (and one mile from Highway-59). The Old Orchard Park experiences less
95
vehicle traffic, is one mile from the Highway-59, and two miles east of an industrial site. The other
96
sites (West Borden, Lumberjack Drive, a truck stop) are near to heavy traffic areas but have low
97
vehicle traffic.
98
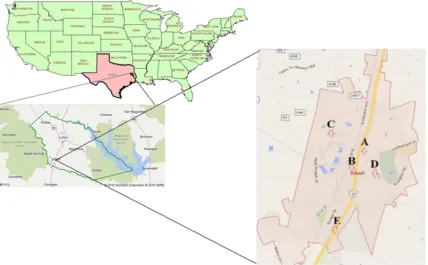
99
Figure 1. Map of USA, Texas, and Angelina County in East Texas. The five soil sampling sites
100
(Intersection of Lumberjack Drive (A), intersection of Judd Street (B), West Borden Drive (industrial
101
site, C), Old Orchard Park (D), and a truck stop (E)) in Diboll, TX are shown in the inset.
102
2.2. Reagents
103
High purity (≥ 98%) benzanthrone (BA), triphenylene (TP), benz[a]anthracene (BaA), chrysene
104
(CHR), fluoranthene (FLT), and pyrene (PY) were purchased from Sigma-Aldrich or Alfa-Aeser. The
105
PAHs were dissolved in dichloromethane (DCM, HPLC grade, 99.8%, Sigma-Aldrich) and used as
106
calibration reference standards. Mixtures of standard solutions (5 - 500 mg L-1) containing the six
107
PAHs were prepared in cyclohexane (Merck) and stored in the dark at 4 °C before use.
108
Soil physico-chemical properties of the soil samples from Diboll were characterized in the lab
110
and summarized in Table 1. Previous characterization [35] is included in Table 1. During analysis soil
111
samples were air-dried and passed through a 2-mm mesh screen. The pH was determined using the
112
suspension of soil to water (1:1 w/v) following USEPA method 9045D [36]. The CEC (Cation Exchange
113
Capacity) was measured by summing Na, K, Mg, and Ca concentrations.
114
2.4. Extraction and Analysis of PAHs from Soils
115
Top soil samples (0 - 10 cm depth) from Highway-59 or close to the road were collected in
116
triplicate from the five locations in June 2015. The samples were cored from the soils using plastic
117
pipes, put in nanopure-washed ziplock bags, labeled on site, and transported to the laboratory. To
118
minimize contaminations, soil samples were handled with gloves, plastic spoons or using plastic
119
pipes. Scheme 2 summarizes the soil sample collection and analysis protocol. The samples were
120
homogenized by mixing thoroughly with a stainless steel spatula. Ten grams of dried soil was placed
121
into an Erlenmeyer flask filled with 50 mL of a hexane: acetone (1:1, v/v) solution, and agitated in an
122
orbital shaker for 12 hours (200 RPM at 25 oC). The solution was filtered and the filtrate collected. The
123
soil was mixed with a further 50 mL of the hexane: acetone solution (v/v) and the extraction procedure
124
repeated. Further extraction was repeated 3 more times using 50 mL of dichloromethane (DCM) each
125
time. The collected filtrates were pooled and concentrated using rotary evaporator, and re-dissolved
126
in 5.00 mL of DCM. Aliquots of the soil extract solutions were then analyzed using GC-MS.
127
128
Scheme 2. Protocol used for extraction of PAHs from soil.
129
2.5. Instrumentation
130
A Varian 450-GC gas chromatograph equipped with an autosampler (Varian CP-8400) was
131
coupled to an ion-trap mass spectrometer (Varian 240-MS). A Phenomenex, Zebron ZB-5 fused silica
132
capillary column (60 m, 0.25 mm i.d., 0.25 μm film thickness) was interfaced to Varian 240-MS mass
133
selective detector operating in the scan mode for GC-MS analyses. A 1.0 μL sample was injected using
134
a splitless mode (20% split ratio). The injection port, transfer line, and ion-trap temperatures were set
135
at 240 o C, 250 o C, and 230 o C, respectively. The carrier gas (helium gas, 99.999% purity), was
136
maintained at a constant flow rate of 1 mL min-1. The oven temperature, initially held at 50 oC, was
137
temperature-programmed at a ramp rate of 20 oC min-1 to 300 oC (hold time 35.00 minutes). The
GC-138
MS Varian mass-selective detector was operated in the scanning mode. The six PAHs BaA, CHR, FLT,
139
PY (four USEPA priority PAHs), BA and TP, and soil extracts, were ionized by electron impact
140
ionization. The total ion chromatogram (TIC) obtained was confirmed with standard mass spectral
141
Weigh 10 g of
dry soil
Add 50 mL of
hexane: acetone
Agitate for 12
hours
Filter sample
• Collect
filtrate
Redissolve soil
in 50 mL of
hexane: acetone
Agitate for 12
hours
Filter
• Collect
filtrate
Repeat
EXTRACTION twice using 50 mL
of DCM each
time
Rotovap
fragmentation patterns. Identification of PAHs was achieved using the selected ion mode (SIM) with
142
m/z values 202.2, 228.5, and 230.4. Calibration curves, with r2 ≥ 99.9%, obtained in CH2Cl2 were used
143
for the quantitation of PAHs.
144
2.6. Identification of PAHs in Soil Samples
145
Prepared standard solutions of BA, BaA, CHR, FLT, PY, and TP were initially analyzed
146
independently on GC-MS and identified based on their retention times and the full scan mass spectral
147
data. To minimize contaminations laboratory procedures were used for quality control and quality
148
assurance including the analyses of method solvent blanks and spiked PAH blanks. Figure 2 shows
149
GC elution profiles of standards, namely, FLT, PY, and BA with retention times (tr) 19.4, 19.7, and
150
22.6 minutes, respectively. The elution profile is in agreement with known or calculated dipole
151
moments (BaA = 0.00D, FLT= 0.35 Debye, BA = 3.85 D, CHR = 0.00 D, PY = 0.00D, TP = 0.000 D [30,
152
37, 38]). Because of similar polarities, dipole moments [37, 38], molecular weights, size, and ring
153
structure, BaA, CHR, and TP eluted from ZB-5 column with close retention times 22.2, 22.3, and 22.3
154
minutes (Figure 2), respectively.
155
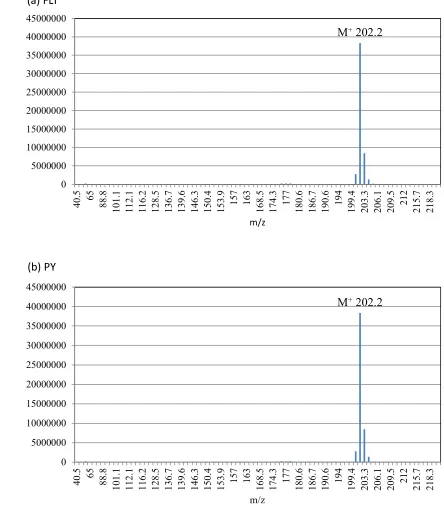
Figures 3(a) and 3(b) show FLT and PY MS data, with m/z = 202.3 exhibiting similar
156
fragmentation patterns. Figures 4(a), 4(b) and 4(c) show that MS fragmentation patterns for BaA,
157
CHR, and TP (m/z = 228.5) are the same. Figure 4(d) shows MS spectral data for BA (M+ =230.4). The
158
concentrations for BaA, CHR, and TP in soil samples were below LOD = 0.2 ppb. Calibration curves
159
from 0 - 500 ppb for the determination of fluoranthene and pyrene (FLT and PY) were constructed,
160
and equations derived, namely, Intensity (MCounts) = 378.35Conc. (FL). (r2 = 0.999, for FLT) and
161
Intensity (MCounts) = 368.63[PY] (r2 = 0.997; for PY) derived.
162
163
164
Figure 2. Gas chromatographic profiles of PAH standards benzo[a]anthracene (BaA), benzanthrone
165
(BA), chrysene (CHR), fluoranthene (FLT), pyrene (PY), and triphenylene (TP). A Zebron ZB-5
166
capillary column (60 m, 0.25 mm i.d., 0.25 μm film thickness; Phenomenex, Torrance, CA) was used
167
with a temperature-program: hold time 5 minutes, initial oven temperature held at 50 oC, ramp rate
168
of 20 oC min-1 to 300 oC, run time = 35.00 minutes.
169
Time (minutes)
18 19 20 21 22 23
M
Coun
ts
0 1e+7 2e+7 3e+7 4e+7
P
y
(
1
9
.7
)
BaA
C
H
R
an
d
T
P
(
2
2
.3
)
B
A
(
2
2
.6
)
2.7. Quantification, Detection, and Statistical Analysis of PAHs in Soil Samples
170
Standard solutions in the range 0.0 – 500.0 ppb of PAHs (BA, BaA, CHR, FLT, PY, and TP) were
171
prepared for making calibration curves. By plotting peak areas versus concentration, linear
172
calibration curves with r2 = 0.9968 - 0.9990 were established. The method limit of detection (LOD =
173
; S/N =10 for the LOQs) of the standard solution was evaluated through signal/noise ratios using 10
174
replicates and a standard deviation (); where s is the standard deviation of at least 10 replicate
175
measurements at the 99 % confidence level. The calculated LOD was ≤ 0.2 ppb for fluoranthene, BA,
176
BaA, CHR, and TP, and 0.4 ppb for pyrene.
177
2.8. Quality Assurance of Measurements
178
To avoid any contamination, HPLC analytical grade solvents were used throughout the
179
analytical procedures. All glassware was washed and dried using nanopure water and appropriate
180
solvents. Quality control samples analyzed included fifteen laboratory blanks and at least three
181
triplicates at each site. Identification and quantification of individual PAHs, were carried out by
182
comparing their retention times with a standard PAH mixture. The PAHs namely, benzanthrone,
183
benz[a]anthracene, chrysene, fluoranthene, pyrene, and triphenylene with purity > 98% were
184
dissolved in dichloromethane (DCM, HPLC grade, ≥ 99.8%, Sigma-Aldrich) and used as calibration
185
reference standards. Several blanks (n = 3) were treated in same way as samples. Method blanks,
186
spiked blanks, and sample triplicates were analyzed along with the field samples in this study. The
187
recoveries calculated using the formula:
188
(% recovery = X 100%) were determined ≥ 88 % (% recoveries: BA =
189
92 ± 4%, BaA= 89 ±5%, CHR = 93 ± 2%, FLT = 87±3, PY = 97± 2%, and TP = 88 ± 4 %).
190
3. Results
191
3.1. Physical and Chemical Characterization of Soil samples
192
The physico-chemical soil characteristics from Diboll are summarized in Table 1. These soils are
193
characterized as fine-silty, siliceous, superactive, thermic Albic Glossic Natraqualfs [35] The
194
determined pH was in the range 7.6 – 8.9 (Table 1). The loamy soils are capable of holding
195
contaminants in their lattice structure. Macroelements including Ca, Mg, Na, K are present in the A
196
horizon, although typically deficient of Al, Si, Mn, Na, C, S and organic matter. Table 1 shows that
197
within the 1-13 cm depth, the Diboll soils have K (64.1 - 90.99 ppm), Ca (1178 - 4428 ppm), and Mg
198
(76.5 – 192 ppm), organic matter (1.6 – 5.5 ppm), total N (0.13 - 0.30 wt %). The available P follows the
199
trend: 9.197 ppm (Old Orchard) < 9.968 ppm (West Borden Dr.) < 25.475 ppm (Truck Stop) < 53.905
200
(Judd Street) < 54.479 (Lumberjack Drive). The cation exchange capacity was earlier determined
201
to be (0.062, Table 1). In the current determination the electrical conductivity of the soils is in the
202
range 9.27 S/cm - 10.1 S/cm vi-a-vis earlier determination of ~ 4 S/cm [35].
203
TABLE 1. Physico-chemical properties of Diboll soils at 0 -10 cm depths.
204
Parameter. Valuea*
Old Orchard Park
West Borden Drive
Lumberjack
Drive Judd St. Truck Stop
pH 8.0 7.85 7.7 8.9 7.6
Bulky density (g cm-3) 1.50
-1.51a ND ND ND ND ND
Chemical properties
C/N ratio 13a 6.289 9.442 8.722 9.484 9.51
Potassium (K), ppm 70.4 ± 1.5 63.7± 0.6 65.6± 0.5 70.31± 2.0 90.99±1.01 Calcium (Ca), ppm 3662± 335 4428 ±235 1095 ± 108 3796 ± 307 1178± 122 Magnesium (Mg), ppm 192.0±45.3 133±57 76.5 ± 28.5 115.24±18.76 117.02±21.76
Cation exchange
capacity (CEC) 0.62
Ammonium nitrogen
(NH4+-N) ppm 5.4
a 6.13 ±1.20 6.51± 0.39 7.57 ± 4.21 8.63 ± 0.42 5.79 ± 0.01
Organic matter 1.65 ± 0.07 4.78 ±1.10 2.73 ± 0.08 5.47 ±0.35 3.08 ± 0.04 Organic carbon (% wt.,
OC) 1.66
a 0.83 ± 0.01 2.39 ±0.02 2.73 ± 0.01 2.74 ± 0.01 1.54 ± 0.01
Total nitrogen (% wt) 0.080 0.13 ± 0.07 0.25 ±0.04 0.16 ± 0.02 0.29 ± 0.04 0.16 ±0.05 Total phosphorus
(ppm) 9.197 9.968 54.479 53.905 25.475
Electrical conductivity
S/cm 8.2
a 9.70±0.20 10.1±0.30 9.58 ± 0.04 9.27 ±0.40 9.27± 0.35
ND = Not determined. *aData from Ref # [35]. All other measurements were performed in the lab in this
205
study.
206
The parameters such as organic matter and total organic carbon may influence the PAH
207
distributions in the soils. The lowest organic carbon (TOC) content was found at the Old Orchard
208
Park (0.826 %) and the Truck stop (1.54%) sites (Table 1). Higher TOCs in other sites increased in the
209
order West Borden Drive (2.39 %) < Lumber Jack Drive (2.73 %) ≈ Judd Street (2.74 %). The low TOC
210
values vis-à-vis higher concentration sites may be due to the low adsorption capacity of the sandy
211
(quartz soils) present at the Old Orchard Park and Truck Stop sites.
212
3.2. Concentrations of Polycyclic Aromatic Hydrocarbons in Soil Samples
213
The selected ion mode (SIM) has the advantage of enhancing the peak intensity of selected ions
214
while ignoring undesired peaks that occur at low concentrations (ppb). The m/z = 202.2 (FLT and PY),
215
228.5 (BaA, CHR, and TP), and 230.4 (BA) were selected for SIM mode analysis. The concentrations
216
of PAHs determined from each sampling site are presented below.
217
Old Orchard Park: Figure 5(a) shows the SIM chromatogram of soil samples from Old Orchard Park
218
site. Of the six PAHs analyzed, FLT and PY were detected in all soil samples in concentrations > 0.2
219
ppb. FLT was detected in all samples and quantified (via peak area) in samples at 24.2 ± 18.4 μg kg-1
220
(ppb, in dry soil).
221
Although PY was detected in all sites, the concentrations found at the Old Orchard Park and
222
Truck stop were less than 0.4 ppb (See Table 2). Samples from Old Orchard Park showed the second
223
lowest fluoranthene concentrations. This park receives regular vehicular traffic and is about a mile
224
from U.S. Highway-59. The large standard deviation suggests that the soil samples extracted were
225
inhomogeneous, which may result from the uneven deposits of PAHs into the soil.
226
West Borden Drive (Industrial Site): Figure 5b shows the SIM chromatogram of soil samples from
227
the West Borden Drive, an industrial site. The FLT concentrations 142 - 397.7 μg kg-1 (indry soil (ppb)
228
(Table 2) were 11-fold higher than that found in samples from Old Orchard Park 5.8 - 42.6 μg kg-1
229
(ppb, dry soil). The pyrene concentrations were determined to be 1477.9 -1590.7 μg kg-1 (in dry soil). Other
230
PAHs (benzanthrone (BA), benz[a]anthracene (BaA), chrysene (CHR), and triphenylene (TP)) were <
231
0.2 ppb. Due to its proximity to several industrial plants and a railroad line, high concentrations of
232
234
235
Figure 3. Mass spectra of fluoranthene (a), and pyrene (b). Fragmentation patterns are similar, and
236
both compounds have an M+ of 202.2.
237
M
+202.2
0 5000000 10000000 15000000 20000000 25000000 30000000 35000000 40000000 45000000
40.
5 65
88.
8
101.
1
112.
1
116.
2
128.
5
136.
7
139.
6
146.
3
150.
4
153.
9
157 163
168.
5
174.
3
177
180.
6
186.
7
190.
6
194
199.
4
203.
3
206.
1
209.
5
212
215.
7
218.
3
m/z
(a) FLT
M
+202.2
0 5000000 10000000 15000000 20000000 25000000 30000000 35000000 40000000 45000000
40.
5
65
88.
8
101.
1
112.
1
116.
2
128.
5
136.
7
139.
6
146.
3
150.
4
153.
9
157 163
168.
5
174.
3
177
180.
6
186.
7
190.
6
194
199.
4
203.
3
206.
1
209.
5
212
215.
7
218.
3
m/z
238
239
240
(d) BA
241
242
Figure 4. Mass spectra of benz[a]anthrace (a), chrysene (b), triphenylene (c), and benzanthrone (d,
243
with a m/z+= 230.4). The fragmentation patterns of benz[a]anthrace, chrysene, and triphenylene with
244
M/z+ = 228.5 amu are identical.
245
M
+228.5
0 5000000 10000000 15000000 20000000
53.5 114.7 141.1 174.8 193 214.5 228.5 237.1 248.2
m/z
(a) BaA
M
+228.5
0 10000000 20000000 30000000
53.5 114.7 141.1 174.8 193 214.5 228.5 237.1 248.2
m/z
(b) CHR
M
+228.5
0 5000000 10000000 15000000 20000000 25000000 30000000
53.5 114.7 141.1 174.8 193 214.5 228.5 237.1 248.2
m/z
(c) TP
M
+230.4
0 100000 200000 300000 400000 500000 600000 700000
40.
3
45.
1
51.
2
56.
4
64.
2
73.
2
77.
2
82.
8
88.
3 95
99.
2
106.
9
112.
2
120.
2
126.
3
135.
2
139.
4
149.
4
153.
3
159.
1
165.
4
175.
3
185.
4
196.
7
200.
3
204.
2
209.
2
213.
4
221.
3
231.
2
235.
3
243.
3
246
247
248
Figure 5. Selected ion spectrum (SIS) gas chromatograms of soil extracts from sample sites and
249
retention times in the 18.0 – 20.0 minutes region: Old Orchard Park (a), West Borden industrial site
250
(b), Lumberjack Drive (c), Judd Street (d), and Truck Stop (e). Selected ions with m/z 202.2, 228.5, and
251
230.4 were chosen. Conditions used: Zebron ZB-5 capillary column (60 m, 0.25 mm i.d., 0.25 μm film
252
thickness; Phenomenex, Torrance, CA); a temperature-program: hold time 5 minutes, initial oven
253
temperature held at 50 oC, ramp rate of 20 oC min-1 to 300 oC, run time = 35.00 minutes.
254
Chromatograms were detected with a UV-Vis (DAD) detector.
255
TABLE 2. Concentrations (g kg-1, in dry soil) of fluoranthene, pyrene, benzanthrone,
256
benz[a]anthracene, chrysene, and triphenylene in soil samples collected from five sites from Diboll,
257
East Texas (USA). n = 3.
258
Sampling site/PAH Fluoranthene
(FLT) Pyrene (PY) BA BaA CHR TP Conc. and
range
Old Orchard Park Conc. 24.2 ± 18.4 0.4 <0.2 <0.2 <0.2 <0.2 Range 5.8 – 42.6
Time (minutes)
18 19 20 21 22 23
In te n si ty ( K il o co u n ts ) 0 1000 2000 3000 4000 5000 6000 U n k n o w n ( 1 8 .1 ) P Y ( 1 9 .7 ) F L T ( 1 9 .4 )
(a) Old Orchard Park
Time (minutes)
18 19 20 21 22 23
In te n si ty ( k il o co u n ts ) 0 2e+4 4e+4 6e+4 8e+4 1e+5 u n k n o wn ( 1 8 .1 ) F L T ( 1 9 .4 ) P Y (1 9 .7 )
(b) West Borden Drive (Industrial Area)
C HR a n d T P ( 2 2 .3 ) B aA (2 2 .2 ) Time (minutes)
18 19 20 21 22 23
In te n si ty ( k il o co u n ts ) 0 5000 10000 15000 20000 25000 30000 U n k n o w n ( 1 8 .1 ) FLT (19.4) P Y ( 1 9 .7 )
(c) Lumberjack Drive
U n k n o w n ( 1 8 .3 ) C H R a n d T P ( 2 2 .3 ) Time (minutes)
18 19 20 21 22 23
In ten si ty ( k il o co u n ts ) 0 10000 20000 30000 40000 50000 unknown (18.1) U n k n o w n ( 1 8 .3 ) F L T ( 1 9 .4 ) P Y ( 1 9 .7 )
(d) Judd St.
B A ( 2 2 .6 ) C H R an d T P ( 2 2 .3 ) B aA ( 2 2 .2 ) Time (Minurtes)
18 19 20 21 22 23
In te n si ty ( k il o co u n ts ) 0 10000 20000 30000 40000 50000 Unknown (18.1) U n k n o w n ( 1 8 .3 U n k n o w n ( 1 8 .5 ) F L T ( 1 9 .4 ) P Y ( 1 9 .7 )
(e) Truck Stop
West Borden Drive
(Industrial Site) Conc. 270.0 ± 127.7 1534.6 ± 56.7 <0.2 <0.2 <0.2 <0.2 Range 142.3 – 397.7 1477.9 -1590.7
Lumberjack Drive Conc. 46.9 ± 28.0 19.4 ±8.2 <0.2 <0.2 <0.2 <0.2 Range 18.9 – 74.9 11.2 - 27.6
Judd St. Conc. 86.0 ± 64.0 41.2 ± 12.9 <0.2 <0.2 <0.2 <0.2 Range 22.0 -150.0 28.3 - 54.1
Truck Stop Conc. 18.1± 8.2 < 0.4 <0.2 <0.2 <0.2 <0.2 Range 9.9 - 26.3
Note:BA = Benzanthrone, BaA= benz[a]anthracene, CHR = chrysene, and TP = triphenylene were below
259
detection levels in all sampling sites; BD = Below Detection limit of 0.2 ppb.
260
Lumberjack Drive: Figure 5(c) depicts the SIM gas chromatogram in soil samples from the
261
intersection of Lumberjack Drive with U.S. Highway-59. The detected FLT and PY concentrations in
262
samples were 14 .9 – 74.9 μg kg-1 and 11.2 -27.6 μg kg-1 (in dry soil), respectively. The minimum and
263
maximum FLT concentrations are two-fold higher vis-a-vis Old Orchard Park samples. This is
264
feasible because the intersection of Lumberjack Drive site is located along the busy U.S. Highway-59.
265
Notably, opposite the Lumberjack Drive is a tractor trailer weigh station used by various industrial
266
plants in the city. The engines of the many tractor trailers often run on “idle mode” at this intersection
267
prior to weighing. In addition, Lumberjack Drive intersection has a STOP light where vehicles
268
engines may idle. The heavy traffic and its exhaust emissions may contribute to higher PY and FLT
269
concentrations. Notably, BA, BaA, CHR, and TP concentrations were at < 2 ppb this site (Table 2).
270
Judd Street intersection: Figure 5(d) depicts the SIM gas chromatogram of soil extracts from the
271
intersection of Judd Street and U.S. Highway-59. Although BA, BaA, CHR, and TP concentrations
272
were found below detection limits (< 0.2 ppb), FLT and PY concentrations in samples were detected
273
in the range of 20.6 -148.6 μg kg-1, in dry soil) (ppb) and 28.3 - 54.1 μg kg-1 (ppb, in dry soil) respectively.
274
The fluoranthene concentrations in sites follow the order: West Borden Drive (Industrial Site) (142.3
275
– 398.4 g kg-1) > Judd Street (22.0 -150.0 g kg-1) > Lumberjack Dr. (18.9 – 74.9 kg-1 > Truck stop (9.9
276
-26.3 μg kg-1 (in dry soil). The pyrene concentrations follow the order: 1477.9-1590.7 g kg-1 (Western
277
Borden Drive) > 28.3 -54.1 g kg-1 (Judd Street) > 11.2 -27.6 g kg-1 (Lumber jack Dr.) > Old Orchard
278
park ≈ Truck Stop (< 0.2 ppb, in dry soil). The Judd Street sampling site showed the second highest
279
maximum FLT and PY concentrations. This intersection is further away from a weigh station and
280
receives much less idle traffic vis-a-vis Lumberjack Drive intersection. However, this site receives
281
many moving vehicular traffic, which operate at higher revolutions per minute (RPM) in contrast to
282
idling vehicles. This is in agreement with studies that show that PAH concentrations in vehicle
283
exhaust emissions increase with increasing RPM [34]. The Judd Street intersection is the site of the
284
only bus stop in the city with frequent bus stops, which could contribute to higher FLT, PY, BaA,
285
CHR, TP and BA amounts.
286
Truck Stop: Figure 5(e) shows the SIM gas chromatogram of soil samples from a Truck Stop site.
287
The concentrations of FLT in these samples was 9.9 - 26.3 μg kg-1 (ppb, in dry soil), while PY was
288
detected at low concentrations (~ < 0.4 ppb). The Truck Stop (showing the second lowest FLT
289
concentration) is the first refueling station in a 30-mile span of U.S. Highway-59, and is visited
290
constantly by tractor trailers and personal vehicles. Considering the number of vehicles at this
291
sampling site, the PAH concentrations were surprisingly low. Such results could be explained by the
292
PAH change from the vapor phase to particulate phase with increasing molecular weight. The lower
293
molecular weight compounds may be volatile and photooxidative in the atmosphere or under
294
atmospheric conditions, in contrast to higher molecular weights that are associated with the soil
295
particles [39].
296
3.3. Possible isomers of Fluorathene and Pyrene, and Analysis of Unknown Peaks in Soil Samples
297
In addition to detecting PY, FLT, BaA, CHR and TP as major PAHs in the Diboll soils, other
298
unidentified peaks were found in the in the soils. A possibility of the existence of isomers of FLT and
299
mixtures in two standard reference air particular samples. Various 4-ring cata-condensed isomers of
301
pyrene and fluoranthene, namely, chrysene, triphenylene were found in the study. Using a
normal-302
phase LC on an aminosilane column, the analysis showed that pyrene chrysene, benz[a]anthracene
303
eluted from the column albeit having close dipole moments. The 4-ring cata-condensed isomers
304
eluted from the column at different retention times, and separately from PY and FLT. In the present
305
study the proper identification of FLT and PY was determined from the use of known standards as
306
well as the spiking of samples.
307
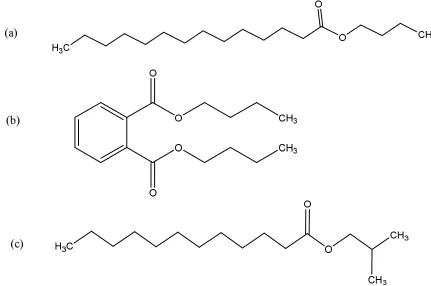
Figures 5(a), 5(b), 5(c), 5(d), and 5(e) show unidentified peaks with retention times ~18.1, 18.3,
308
and 18.5 minutes, with corresponding m/z peaks 229.0, 149.0, and 201.0, respectively. From a NIST
309
library database, these peaks could be assigned (possibly) to n-butyl myristate, dibutyl phthalate, and
310
isobutyl laurate (Figure 6), respectively. These compounds are commonly used as plasticizers in
311
cellulosic plastics and polyvinyl chlorides (PVC) [41]. It is also possible that the identities of
312
compounds may include other organic species derived from humic and fulvic substances; products
313
of biodegradation of dead organic matter. Humic and fulvic derivatives constitute a great part of
314
dissolved organic matter in surface soils [7, 41]. However, the identity of these peaks could not be
315
positively confirmed without the use of standard samples or further spectroscopic techniques such
316
as NMR.
317
318
Figure 6. Possible structures of unknown compounds (n-butyl myristate (a), dibutyl phthalate (b),
319
and isobutyl laurate (c)) in soil sample extracts.
320
4. DISCUSSION
321
4.1. Comparison of Present Studies to Previous Studies
322
Fluoranthene (FLT) and pyrene (PY) were detected in soil samples in the range12.3 – 396.5 and
323
13.6 – 209.8 μg kg-1 (ppb, in dry soil), respectively. From these investigations it is concluded that
324
determined concentrations are comparable with reported FLT concentrations from 565 – 3,167 μg kg
-325
1 (ppb) in urban areas and 28 – 65 μg kg-1 (ppb) in United States rural areas [42-46]. PY concentrations
326
have been reported from 692 - 3,463 μg kg-1 (ppb) in United States urban areas and 25 - 62 μg kg-1
327
in India [48]. However, concentrations of FLT and PY were determined up to 20 times higher (381 –
329
6,461 ppb) in one study in Taiwan [49]. In the present study, internal comparisons show that the West
330
Borden Drive site has the highest PY and FLT concentrations. The West Borden Drive sampling area
331
is located at the center of four industrial plants in Diboll. Previously, one of the industrial sites near
332
this sampling site received regular deliveries of coal-tar base creosote by rail car. The creosote was
333
used majorly for the preservation of wood and petrified wood products. FLT and PY are major
334
contaminants of creosote, and are among the more predominant and regulated PAHs in coal tar [47,
335
50]. Remnants of creosote are likely causes for the elevated concentrations in this area.
336
The presence of FLT and PY in low traffic areas is usually indicative of FLT and PY emitted to
337
high concentrations of in the environment [51, 52]. As would be expected areas of high vehicular
338
traffic (Lumberjack Drive and Judd Street) had higher PAH concentrations than low traffic areas (Old
339
Orchard Park). However, the “Truck Stop”, which is frequented on a daily basis by hundreds of diesel
340
and gasoline powered vehicles, showed the lowest concentrations of FLT or PY. Most of the diesel
341
vehicles remain idle while powered on in this location. Consequently, PAHs are released from
342
vehicular exhaust emissions to the atmosphere.
343
Notably, other organic species were detected at these sampling sites. Although the NIST mass
344
spectral library identifies them as carboxylic acids, possibly resulting from being likely derivatives of
345
humic and fulvic substances extracted from the soil [7]. However, the identities of these signals have
346
not been positively confirmed. The detection of benzanthrone (BA), benz[a]anthracene (BaA),
347
chrysene (CHR), triphenylene (TP) and other PAH-derivatives at low concentrations shows their low
348
abundancies in soils at these sampling sites.The detection of these PAHs and their derivatives would
349
be improved by extracting larger amounts of soil (> 10 g) and concentrating the extracts to smaller
350
volumes (< 5.00 mL). Additionally, a standard addition method would be explored for PAHs
351
extractions from soil samples. These would help detect and quantitation of the low quantities of these
352
PAHs.
353
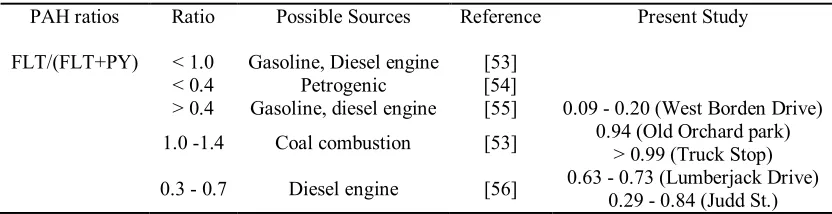
TABLE 3. Diagnostic ratios of fluoranthene and pyrene (FLT/(FLT+Pyr)) ratios and possible source
354
identification. Ratios are also reported in Ref. # [48].
355
PAH ratios Ratio Possible Sources Reference Present Study
FLT/(FLT+PY) < 1.0 Gasoline, Diesel engine [53] < 0.4 Petrogenic [54]
> 0.4 Gasoline, diesel engine [55] 0.09 - 0.20 (West Borden Drive) 1.0 -1.4 Coal combustion [53] 0.94 (Old Orchard park)
> 0.99 (Truck Stop) 0.3 - 0.7 Diesel engine [56] 0.63 - 0.73 (Lumberjack Drive)
0.29 - 0.84 (Judd St.)
4.2. Possible Source Identification of Fluoranthene and Pyrene
356
PAHs of varying molecular weights are released to the environment from varied sources.
357
Diagnostic ratios of PAHs are valid tools of PAH sources analysis because isomer pairs are diluted
358
to a similar extent and distributed similarly to environmental media [57]. Diagnostic ratios are often
359
applied for identification and apportionment of the probable environmental sources [58, 59]. Table 3
360
shows the diagnostic ratios [53-56] often used for predicting probable PY and FLT sources. Studies
361
show that combustion derived PAHs (pyrogenic) usually contain high molecular weight PAHs,
362
normally generated at high temperatures [60] while petroleum derived residues (petrogenic) contain
363
a high abundance of low molecular weight PAHs (LMW-PAHs) [53-56]. A FLT/PY ratio greater than
364
1.0 most likely predicts that the PAHs originate from pyrolytic sources [53-56], while a FLT/PY ratio
365
less than 1.0 predicts petrogenic sources. Other studies show that FLT /(FLT+PY) ratio < 0.4 indicate
366
pyrogenic sources, values of 0.4 - 0.5 indicate fuel combustion, and > 0.5 suggests grass/coal/wood
367
combustion sources [60]. The calculated FLT/(FLT+PY) ratios of 0.94, < 0.99 (Table 3) were obtained
368
at the Old Orchard Park, and Truck Stop, respectively, which implicates the gasoline and diesel
369
Borden Drive (Industrial Site) and Lumberjack Drive, respectively. This shows that possible PAH
371
sources at the West Borden Drive (Industrial Site) and Lumberjack Drive may be from gasoline and
372
diesel engines; diesel-powered engines/or machines are commonly used at the West Borden Drive
373
site (0.09 - 0.20 ratio). Based on the calculated ratios we conclude that the major PAH sources are
374
diesel combustion, gasoline, wood combustion, vehicle emission, coal combustion and traffic
375
emissions. This is in accord with other studies from rural areas [60, 61].
376
4.3. Implications of this Study
377
The concentrations of FLT, PY and other PAHs in the soil samples might raise concerns about
378
human exposure to these PAHs, albeit classified as non-carcinogenic to humans [62-65]. The U.S.
379
Environmental Protection Agency (USEPA) provides guideline exposure limits of FLT and PY in soil
380
samples as 3,100 mg kg-1 and 2,300 mg kg-1 (ppm) [66]. However, their degradation derivatives such
381
as nitrated-PAHs are known carcinogens. Notably, 3-nitrofluoranthene (3-NFLT) and 1-nitropyrene
382
(1-NPY), and other nitro-PAHs (NPAHs) exhibit mutagenic and carcinogenic properties [29, 67, 68].
383
Although nitrated compounds were not investigated or identified in the soil samples legitimate
384
concerns and pertinent investigations will be sought in future to ascertain their absence. Larger
385
sample sizes and analysis of standard NPAH standards will be needed to determine their presence
386
at the ppb, ng or lower detection levels. Such studies will chart future research into the apportionment
387
of concentrations of PAHs in Diboll, a rural city.
388
5. CONCLUSIONS
389
Six polycyclic aromatic hydrocarbons (PAHs) were determined in soil samples from Diboll, East
390
Texas (USA) by using GC-MS. Whereas fluoranthene and pyrene were found most abundant in all
391
soils [69, 70], BaA, BA, CHR, and TP were detected in soil sample extracts at low concentrations. This
392
analysis provides the following conclusions. Firstly, mechanical agitation is an appropriate method
393
for the extraction of PAHs from soil samples when the extraction time is increased to 12 hours.
394
Secondly, the sum of the concentrations of FLT and PY in soil samples decreased in the order of West
395
Borden Drive (industrial site) > Judd Street > Lumberjack Drive > Old Orchard Park > truck stop.
396
Thirdly, GC-MS detected other compounds in the soil samples, with shorter retention times than FLT
397
and PY, indicating that they are likely more polar. Fourthly, the extraction of PAHs from soil samples
398
via mechanical agitation identified unidentified organic substances in soils samples. Although this
399
investigation only used the agitation method, other extraction methods including Soxhlet and
ultra-400
sonication will be explored in future. It is further noted that pre-concentration methods would be
401
beneficial to the detection of benzanthrone (BA), benz[a]anthracene (BaA), chrysene (CHR),
402
triphenylene (TP) in environmental samples.
403
404
ACKNOWLEDGMENTS: This research was supported by Stephen F. Austin State University
405
Faculty Research Grants (ORSP # 107552, and Research minigrants) and Robert A. Welch Foundation
406
Grant Number AN-0008. JJ Ojeda was supported through the SFASU Chemistry & Biochemistry
407
Department. Special thanks go to Professor Michele Harris (SFASU Chemistry & Biochemistry
408
Department for the use of the centrifuge. Any opinions expressed in this paper are those of the
409
authors, and therefore, no official endorsement should be inferred.
410
NOTES ON CONTRIBUTORS
411
Kefa K. Onchoke is a Professor of Chemistry and Biochemistry at Stephen F. Austin State
412
University (SFASU).
413
Jorge J. Ojeda received a Master of Natural Science from SFASU.
414
Michael A. Janusa is Chair and Professor of Chemistry and Biochemistry at Stephen F. Austin
415
State University (SFASU).
416
REFERENCES
418
1. Ramírez, N., Cuadras, A., Rovira, E., Marcé, R. M., Borrull, F. Risk assessment related to atmospheric
419
polycyclic aromatic Hhydrocarbons in gas and particle phases near industrial sites. Environ. Health
420
Persp. 2011, 119 (8), 1110 - 1116.
421
2. Notar, M., Leskovšek, H., Faganeli, J. Composition, distribution and sources of polycyclic aromatic
422
hydrocarbons in sediments of the Gulf of Trieste, Northern Adriatic Sea. Mar. Pollut. Bull. 2001, 42(1),
423
36 - 44.
424
3. Ololade, I. A. Prediction of polycyclic aromatic hydrocarbons toxicity using equilibrium partitioning
425
approach and Narcosis Model. Bull. Environ. Contam. Toxicol. 2010, 242 (85), 238-242.
426
4. Schneider, K., Roller, M., Kalberlah, F., Schuhmacher-Wolz, U. Cancer risk assessment for oral
427
exposure to PAH mixtures. J. Appl. Toxicol. 2002, 22 (1), 73-83.
428
5. IARC (International Agency for Research on Cancer). A Review of Human Carcinogens: Some
429
Chemicals in Industrial and Consumer Products, Food Contaminants and Flavorings, and Water
430
Chlorination by-products.: France: Lyon, France. (2012).
431
6. Zimmermann, K., Jariyasopit, N., Simonich, S. L. M., Tao, S., Atkinson, R., Arey, J. Formation of
nitro-432
PAHs from the heterogeneous reaction of ambient particle-bound PAHs with N2O5/NO3/NO2.
433
Environ. Sci. Technol. 2013, 47 (15), 8434−8442.
434
7. Rocha, M. J., Ferreira, P. C., Reis, P. A., Cruzeiro, C., Rocha, E. Determination of polycyclic aromatic
435
hydrocarbons in coastal sediments from the Porto Region (Portugal) by microwave-assisted
436
extraction, followed by SPME and GC–MS. J. Chromatogr. Sci. 2011, 49 (9), 695-701.
437
8. Huang, B., Liu, M., Bi, X., Chaemfa, C., Ren, Z., Wang, X., Sheng, G., Fu, J. Phase distribution, sources
438
and risk assessment of PAHs, NPAHs and OPAHs in a rural site of Pearl River Delta region, China.
439
Atmos. Pollut. Res. 2014, 5(2), 210–218.
440
9. Oketola, A. A., Akpotu, S. O. Assessment of solid waste and dumpsite leachate and topsoil. Chem.
441
Ecol. 2015, 31 (2), 134-146.
442
10. USEPA. Toxic Release Inventory Public Data Release. Washington, D.C.: Office of Environmental
443
Information, United States Environmental Protection Agency; 2000.
444
Http://www.epa.gov/triinter/tridata/index.htm. Accessed on 18 February 2018.
445
11. Yan, J., Wang, L., Fu, P. P., Yu, H. Photomutagenicity of 16 polycyclic aromatic hydrocarbons from
446
the USEPA priority pollutant list. Mutat. Res. 2004, 557 (1), 99-108.
447
12. Yang, W., Lang, Y.-h., Li, G.-l. Concentration, source, and carcinogenic risk of PAHs in the soils from
448
Jiaozhou Bay Wetland. Polycycl. Aromat. Comp. 2014, 34 (4), 439-451.
449
13. Pham, C. T., Tang, N., Toriba, A., Hayakawa, K. Polycyclic aromatic hydrocarbons and
450
nitropolycyclic aromatic hydrocarbons in atmospheric particles and soil at a traffic site in Hanoi,
451
Vietnam. Polycycl. Aromat. Comp. 2015, 35(5), 355-371.
452
14. Hong, J., Jia, H., Ma, L., Sinha, R. K., Moon, H.-B., Nakata, H., Minh, N. H., Chi, K. H., Li,
W.-453
L., Kannan, K., Sverko, E., Li, Y.-F. Distribution, fate, inhalation exposure and lung cancer risk of
454
atmospheric polycyclic aromatic hydrocarbons in some Asian countries. Environ. Sci. Technol. 2016, 50,
455
7163−7174.
456
15. Zhang, J., Liu, G., Wang, R., Liu, J. Distribution and source apportionment of polycyclic aromatic
457
hydrocarbons in bank soils and river sediments from the middle reaches of the Huaihe river, China.
458
16. Lau, E. V., Gan, S., Ng, H. K. Extraction techniques for polycyclic aromatic hydrocarbons in soils,
460
http://dx.doi.org/10.1155/2010/398381. Int. J. Anal. Chem. 2010, 2010, 1-9.
461
17. Dean, J. R., Xiong, G. Extraction of organic pollutants from environmental matrices: selection of
462
extraction technique. TrAC Trends Anal. Chem. 2000, 19(9), 553-564.
463
18. Hawthorne, S. B., Grabanski, C. B., Martin, E., Miller, D. J. Comparisons of Soxhlet extraction,
464
pressurized liquid extraction, supercritical fluid extraction and subcritical water extraction for
465
environmental solids: recovery, selectivity and effects on sample matrix. J. Chromatogr. A. 2000,
892(1-466
2), 421-433.
467
19. Graham, M. C., Allan, R., Fallick, A. E., Farmer, J. G. Investigation of extraction and clean-up
468
procedures used in the quantification and stable isotopic characterisation of PAHs in contaminated
469
urban soils. Sci. Total Environ. 2006, 360 (1-3), 81-89.
470
20. Kayali-Sayadi, M. N., Rubio-Barroso, S., Díaz-Díaz, C. A., Polo-Díez, L. M. Rapid determination of
471
PAHs in soil samples by HPLC with fluorimetric detection following sonication extraction. Fresenius J.
472
Anal. Chem. 2000, 368 (7), 697-701.
473
21. Sun, F., Littlejohn, D., Gibson, M. D. Ultrasonication extraction and solid phase extraction clean-up for
474
determination of US EPA16 priority pollutant polycyclic aromatic hydrocarbons in soils by
reversed-475
phase liquid chromatography with ultraviolet absorption detection. Anal. Chim. Acta. 1998, 364 (1-3),
476
1-11.
477
22. Stephens Jr, D. L., mcfadden, T., Heath, O. D., Mauldin, R. F. The effect of sonication on the recovery
478
of polycyclic aromatic hydrocarbons from coal stack ash surfaces. Chemosphere 1994, 28 (10),
1741-479
1747.
480
23. Kalbe, U., Berger, W., Eckardt, J., Simon, F.-G. Evaluation of leaching and extraction procedures for
481
soil and waste. Waste Manage. 2008, 28 (6), 1027-1038.
482
24. Savinov, V. M., Savinova, T. N., Matishov, G. G., Dahle, S., Naes, K. Polycyclic aromatic hydrocarbons
483
(PAHs) and organochlorines (OCS) in bottom sediments of the Guba Pechenga, Barents Sea, Russia.
484
Sci. Total Environ. 2003, 306 (1-3), 39 -56.
485
25. Ishii, S., Hisamatsu, Y., Inazu, K., Aika, K.-i. Environmental occurrence of nitrotriphenylene observed
486
in airborne particulate matter. Chemosphere 2001, 44 (4), 681-690.
487
26. Ishii, S., Hisamatsu, Y., Inazu, K., Kadoi, M., Aika, K.-I. Ambient measurement of nitrotriphenylenes
488
and possibility of nitrotriphenylene formation by atmosphereic reaction. Environ. Sci. Technol. 2000, 34
489
(10), 1893-1899.
490
27. El-Bayoumy, K., Desai, D., Boyiri, T., Rosa, J., Krzeminski, J., Sharma, A. K., Pittman, B., Amin, S.
491
Comparative tumorigenicity of the environmental pollutant 6-nitrochrysene and its metabolites in the
492
rat mammary gland. Chem. Res. Toxicol. 2002, 15 (7), 972-978.
493
28. Ramdahl, T., Zielinska, B., Arey, J., Atkinson, R., Winer, A. M., Pitts, J. N. J. Ubiquitous occurrence of
494
2-nitrofluoranthene and 2-nitropyrene in air. Nature (London, United Kingdom) 1986, 321(6068),
425-495
427.
496
29. Onchoke, K. K., Ojeda, J. J. A DFT study of vibrational spectra and mutagenicity predictions of
497
mononitrated fluoranthenes. Polycycl. Aromat. Comp. 2013, 33 (5), 473-500.
498
30. Onchoke, K. K. A TD-DFT study of the absorption spectra of mono-nitrated fluoranthenes. Comput.
499
Theoret. Chem. 2014, 1042, 23-34.
500
31. Ohnishi, S., Murata, M., Fukuhara, K., Miyata, N., Kawanishi, S. Oxidative DNA damage by a
501
32. Lopes, W. A., Pereiraa, P. A. D. P., Viertlerb, H., Andradea, J. B. D. Electrochemical reduction
503
potentials of 1-nitropyrene, 9-nitroanthracene, 6-nitrochrysene and 3-nitrofluoranthene and their
504
correlation with direct-acting mutagenicities. J. Braz. Chem. Soc. 2005, 16 (6A), 1099-1103.
505
33. Phousongphouang, P. T., Grosovsky, A. J., Eastmond, D. A., Covarrubias, M., Arey, J. The
506
genotoxicity of 3-nitrobenzanthrone and the nitropyrene lactones in human lymphoblasts Mutat. Res.
507
2000, 472 (1-2), 93-103.
508
34. Enya, T., Suzuki, H., Watanabe, T., Hirayama, T., Hisamatsu, Y. 3-Nitrobenzanthrone, a powerful
509
bacterial mutagen and suspected human carcinogen found in diesel exhaust and airborne
510
particulates. Environ. Sci. Technol. 1997, 31(10), 2772 -2776.
511
35. NSSL, United States Department of Agriculture (Natural Resources Conservation Service - National
512
Soil Survey Center Natural Resources Conservation Service) USDA-NRCS-NSSC-Soil Survey
513
Laboratory; Pedon ID: 80TX005005; . In
514
(http://www.nrcs.usda.gov/wps/portal/nrcs/surveylist/soils/survey/state/?Stateid=TX, ed.): Lincoln,
515
Nebraska. Accessed on 18 Febraury 2018.
516
36. USEPA (2004), Method 9045D: Soil and Waste pH, part of Test Methods for Evaluating Solid Waste,
517
Physical/Chemical Methods1/ 5; https://
www.epa.gov/sites/production/files/2015-518
12/documents/9045d.pdf. Accessed on 18 February 2018.
519
37. Onchoke, K. K. DFT/TD-DFT investigation of optical absorption spectra, electron affinities, and
520
ionization potentials of mono-nitrated benzanthrones. Comput. Theoret. Chem 2011, 963(1), 40-50.
521
38. Onchoke, K. K. Structure-mutagenicity relationships and energies of 1-, and 2-nitrotriphenylenes. J.
522
Mol. Structure (Theochem) 2009, 899 (1-3), 79-85.
523
39. Creäpineau, C., Rychen, G., Feidt, C., Roux, Y. L., Lichtfouse, E., Laurent, F. Contamination of
524
pastures by polycyclic aromatic hydrocarbons (PAHs) in the vicinity of a highway. J. Agric. Food
525
Chem. 2003, 51(16), 4841−4845.
526
40. Wise, S. A., Benner, B. A., Chesler, S. N., Hilpert, L. R., Vogt, C. R., May, W. E. Characterization of the
527
polycyclic aromatic hydrocarbons from two standard reference material air particulate samples. Anal.
528
Chem. 1986, 58, 3067-3077.
529
41. Gooch, J. W. Ed. (2011). N-Butyl Myristate. In Encyclopedic Dictionary of Polymers. P. 480. (New York,
530
NY: Springer).
531
42. Wang, G., Mielke, H. W., Quach, V., Gonzales, C., Zhang, Q. Determination of polycyclic aromatic
532
hydrocarbons and trace metals in New Orleans soils and sediments. Soil Sediment. Contam., 2004,
533
13(3), 313-327.
534
43. Saltiene, Z., Brukstiene, D., Ruzgyte, A. Contamination of soil by polycyclic aromatic hydrocarbons in
535
some urban areas. Polycycl. Aromat. Comp., 2002, 22, 23-35.
536
44. Van Metre, P. C., Mahler, B. J., Wilson, J. T. PAHs underfoot: contaminated dust from coal-tar
537
sealcoated pavement is widespread in the United States. Environ. Sci. Technol. 2009, 43(1), 20-25.
538
45. Mackay, A. A., Gschwend, P. M. Enhanced concentrations of PAHs in groundwater at a coal tar site.
539
Environ. Sci. Technol. 2001, 35 (7), 1320-1328.
540
46. Chibwe, L., Geier, M. C., Nakamura, J., Tanguay, R. L., Aitken, M. D., Simonich, S. L. M. Aerobic
541
bioremediation of PAH contaminated soil results inincreased genotoxicity and developmental
542
toxicity. Environ. Sci. Technol. 2015, 49(23), 13889 −13898.
543
47. Peters, C. A., Knightes, C. D., Brown, D. G. Long-term composition dynamics of PAH-containing
544
48. Kumar, B., Verma, V. K., Kumar, S., Sharma, C. S. Polycyclic aromatic hydrocarbons in residential
546
soils from an indian city near power plants area and assessment of health risk for human population.
547
Polycyclic Aromat. Compd. 2014, 34, 191-213.
548
49. Dong, C.-D., Chen, C.-F., Chen, C.-W. Determination of polycyclic aromatic hydrocarbons in
549
industrial harbor sediments by GC-MS International Journal of Environmental Research and Public Health
550
(Int. J. Environ. Res. Public Health) 2012 9 2175-2188.
551
50. USEPA (1990). U.S. Environmental Protection Agency Approaches for Remediation of Uncontrolled
552
Wood Preserving Sites; EPA/625/7-0/011; U.S. Environmental Protection Agency: Washington, DC,
553
1990. (USEPA, ed.).
554
51. Onchoke, K. K., Parks, M. Experimental and theoretical study of vibrational spectra of
3-555
nitrofluoranthene. J. Mol. Struct. 2011, 999, 22-28.
556
52. WHO (2000). Polycyclic Aromatic hydrocarbons (PAHs) in Air Quality Guidelines for Europe, Second
557
Edition: World Health Organization Regional Office for Europe, Copenhagen, Denmark.
558
53. Lee, W. J., Wang, Y. F., Lin, T. C., Chen, Y. Y., Lin, W. C., Ku, C., Cheng, J. T. PAH characteristics in
559
the ambient air of traffic-source. Sci. Total Environ. 1995, 159, 185-200.
560
54. Hwang, H. M., Wade, T. L., Sericano, J. L. Concentrations and source characterization of polycyclic
561
aromatic hydrocarbons. Atmos. Environ. 2003, 37, 2259-2267.
562
55. Fadzil, M. F., Tahir, N. M., Zin, W. M. K. W. M. Concentration and distribution of polycyclic aromatic
563
hydrocarbons (PAH) in the town of Kota Bharu, Kerantan Darul Naim. Malaysian J. Anal. Sci. 2008, 12
564
(3), 609-618.
565
56. Kavouras, J. G., Koutrakis, P., Tsapakis, M., Lagooudaki, E., Stephanou, E. G., Baer, D. V., Oyola, P.
566
Source apportionmnt of the urban particulate and polynuclear aromatic hydrocarbons (PAHs) using
567
multivariate methods Environ. Sci. Technol. 2001, 35, 2288 - 2294.
568
57. Liu, Y., Beckingham, B., Ruegner, H., Li, Z., Ma, L., Schwientek, M., Xie, H., Zhao, J., Grathwohl, P.
569
Comparison of sedimentary PAHs in the rivers of Ammer (Germany) and Liangtan (China):
570
Differences between early- and newly industrialized countries. Environ. Sci. Technol. 2013 47, 701−709.
571
58. Khalili, N. R., Scheff, P. A., Holsen, T. M. PAH source fingerprints for coke ovens, diesel and gasoline
572
engines, highway tunnels, and wood combustion emissons. Atmospheric Environment 1995, 29,
533-573
542.
574
59. Wilcke, W. Global patterns of polycyclic aroamatic hydrocarbons (PAHs) in soil. Geoderma 2007, 141,
575
157-166.
576
60. Ortiz, R., Vega, S., Gutiérrez, R., Gibson, R., Schettino, B., Ramirez, M. D. L. Presence of polycyclic
577
aromatic hydrocarbons (PAHs) in top soils from rural terrains in Mexico City. Bull. Environ. Contam.
578
Toxicol. 2012, 88(3), 428-432.
579
61. Wang, C. H., Wu, S. H., Zhou, S. L., Wang, H., Li, B. J., Chen, H., Yu, Y. N., Shi, Y. X. Polycyclic
580
aromatic hydrocarbons in soils from urban to rural areas in Nanjing: concentration, source, spatial
581
distribution, and potential human health risk. Sci. Total Environ. 2015, 527–528, 375-383.
582
62. Gehle, K. Case Studies in Environmental Medicine Toxicity of Polycyclic Aromatic Hydrocarbons
583
(PAHs); Agency for Toxic Substances and Disease Registry, 2009:
584
http://www.atsdr.cdc.gov/csem/pah/docs/pah.pdf. Accessed on Feb 18, 2018.
585
63. Arey, J., Atkinson, R., Zielinska, B., McElroy, P. A. Diurnal concentrations of volatile polycyclic
586
aromatic hydrocarbons and nitroarenes during a photochemical air pollution in Glendora, California.
587
64. Ahlrichs, R., Bär, M., Häser, M., Horn, H., Kölmel, C. Electronic structure calculations on workstation
589
computers: The program system turbomole. Chem. Phys. Lett. 1989, 162(3), 165-169.
590
65. Ball, L. M., Stocking, L. M., Kohan, M. J., Warren, S. H., Lewtas, J. Metabolic activation of the
591
genotoxic ennvironmental contaminants 2- and 3-nitrofluoranthene in variants of Salmonella
592
typhimurium TA98. Mutagenesis 1995, 10 (6), 497-504.
593
66. USEPA (2012). Summary of Maximum Allowable Concentrations of Chemical Constituents In
594
Uncontaminated Soil Used as Fill Material At Regulated Fill Operations (35 Ill. Adm. Code
595
1100.Subpart F). Http://www.epa.state.il.us/land/ccdd/new-max-allowable-concentrations-table.pdf
596
(USEPA, ed.). Accessed on 18 February 2018.
597
67. Chu, W.-C., Hong, W.-F., Huang, M.-C., Chen, F.-Y., Lin, S.-C., Liao, P.-J., Su, J.-G. J. 1-Nitropyrene
598
stabilizes the mRNA of cytochrome P450 1a1, a carcinogen-metabolizing enzyme, via the Akt
599
pathway. Chem. Res. Toxicol. 2009, 22, 1938-1947.
600
68. Ohgaki, H., Matsukura, N., Morino, K., Kawachi, T., Sugimura, T., Morita, K., Tokiwa, H., Hirota, T.
601
Carcinogenicity in rats of the mutagenic compounds 1-nitropyrene and 3-nitrofluoranthene. Cancer
602
Letters 1982, 15, 1-7.
603
69. Kazunga, C., Aitken, M., D, Gold, A., Sangaiah, R. Fluoranthene-2,3- and -1,5-diones are novel
604
products from the bacterial transformation of fluoranthene. Environ. Sci. Technol. 2001, 35 (5), 917-922.
605
70. Heywood, E., Wright, J., Wienburg, C. L., Black, H. I. J., Long, S. M., Osborn, D., Spurgeon, D. J.
606
Factors influencing the national distribution of polycyclic aromatic hydrocarbons and polychlorinated
607
biphenyls in British soils. Environ. Sci. Technol. 2006, 40, 7629-7635.
![Figure 2. Gas chromatographic profiles of PAH standards benzo[a]anthracene (BaA), benzanthrone (BA), chrysene (CHR), fluoranthene (FLT), pyrene (PY), and triphenylene (TP)](https://thumb-us.123doks.com/thumbv2/123dok_us/7892185.1309793/5.595.100.498.390.680/chromatographic-profiles-standards-anthracene-benzanthrone-chrysene-fluoranthene-triphenylene.webp)

![Figure 4. Mass spectra of benz[a]anthrace (a), chrysene (b), triphenylene (c), and benzanthrone (d, with a m/z+= 230.4)](https://thumb-us.123doks.com/thumbv2/123dok_us/7892185.1309793/9.595.44.502.78.715/figure-mass-spectra-benz-anthrace-chrysene-triphenylene-benzanthrone.webp)
![TABLE 2. Concentrations (g kg-1, in dry soil) of fluoranthene, pyrene, benzanthrone, benz[a]anthracene, chrysene, and triphenylene in soil samples collected from five sites from Diboll, East Texas (USA)](https://thumb-us.123doks.com/thumbv2/123dok_us/7892185.1309793/10.595.54.511.69.561/concentrations-fluoranthene-benzanthrone-anthracene-chrysene-triphenylene-collected-diboll.webp)