A validated RP-HPLC method for the simultaneous estimation of paracetamol and naproxen in bulk and tablet dosage forms
10
0
0
Full text
(2) Krishanu Pal et al / Int. J. of Pharmacy and Analytical Research Vol-2(4) 2013 [184-193]. under this category and has good analgesic and antipyretic properties but mild anti-inflammatory activity. It is commonly used for the relief of headaches and other minor aches and pains, and is a major ingredient in numerous cold and flu remedies. It works by blocking the action of the enzyme cyclooxygenase which is responsible for the production of PGs. NPX is a propionic acid derivative related to the arylacetic acid group of nonsteroidal anti-inflammatory drugs which is chemically (2S)-2-(6-methoxynaphthalen2-yl) propionic acid (Figure 1b). It is commonly used to treat pain or inflammation caused by acute masculo-skeletal pain, headaches and migraines, and conditions such as arthritis, ankylosing spondylitis, tendinitis, bursitis, gout, or menstrual cramps.. It works by reducing PGs synthesis by inhibiting the enzyme cyclooxygenase, both COX-1 and COX-2 enzymes that cause inflammation and pain in the body. It is clinically proven as the most cardio safe NSAID with reduced side effects like considerable hepatic and renal safety. This combination of PCM and NPX exhibits antiinflammatory, analgesic and antipyretic activities. PCM has central action and NPX has peripheral action. Thus the combination is more effective when individual drugs act by different mechanism and act synergistically. By activating multiple pain inhibitory pathways PCM and NPX combination has more effective pain relief property and at the same time decreased adverse effects.. Figure-1a: Structure of Paracetamol. Figure-1b: Structure of Naproxen. Literature survey shows that there are several UV spectrophotometric, HPLC, LC-MS and HPTLC methods been reported for estimation of PCM and NPX individually in bulk drugs and also in respective formulations. Even there are many UV, HPLC and HPTLC methods reported for estimation of PCM and NPX in combination with other drugs in various formulations. But there are three UV spectrophotometric, one HPLC and one UPLC method been reported till now for simultaneous estimation of PCM and NPX in fixed dose combination formulations. So in the present work an attempt was made for developing a simple, sensitive, accurate, precise, reproducible, specific and cost-effective RP-HPLC method for the simultaneous estimation of PCM and NPX in the bulk drug and pharmaceutical dosage form, and also to validate the same as per ICH guidelines.. control, and a PDA detector using Waters (Alliance) Empower-2 software. For normal UV absorbance estimations during trials were done by a Lab India UV- VIS spectrophotometer UV 3000+, and weighing of drugs and chemicals were done by a Shimadzu precision balance AUX-220.. Chemicals and reagents Paracetamol and Naproxen sodium RSwere obtained as a gift samples from Aurbindo Pharma Ltd, Hyderabad. Due to unavailability of the Mkd. formulation in the local market during the time of experimentation PCM and NPX synthetic mixture was prepared by placebo technique and formulated as tablet. HPLC grade acetonitrile and water were procured from Merck (Mumbai, India) and potassium dihydrogen phosphate , dipotasssium hydrogen phosphate and potassium hydroxide of analytical grade were used for the studies. The solvents and mobile phases after preparation were filtered using Millipore 0.45 µm filter medium.. EXPERIMENTAL Instrumentation A Waters Alliance 2695 Separation Module-HPLC system comprising of quaternary, low pressure mixing pump and inline vacuum degasser with auto sampler and programmable temperature. Chromatographic conditions A Nucleosil C8 (250 X 4.6 mm, 5μm) column was used as a stationary phase, and phosphate buffer. 185.
(3) Krishanu Pal et al / Int. J. of Pharmacy and Analytical Research Vol-2(4) 2013 [184-193]. pH-6.5 adjusted with 1N potassium hydroxide and acetonitrile in the ratio of 70:30 v/v was used as a mobile phase. With a flow rate of 1.0 ml/min, detection wavelength at 240 nm and column temperature was maintained at 300C.. METHOD DEVELOPMENT Selection of suitable detection wavelength As per literature survey methanol was found to be the most suitable solvent for both PCM and NPX. So suitable dilutions of 100 µg/ml were prepared for both PCM and NPX and were scanned within the range of 200-400 nm using a UV-Visible spectrophotometer. From the obtained spectrums of both drugs the isobestic point was found to be 240 nm, which was selected as the suitable detection wavelength.. Preparation of mobile phase 1.36 gm of potassium dihydrogen phosphate and 0.6 gm of dipotasssium hydrogen phosphate were dissolved in 500 ml of HPLC-grade water and finally the volume was made upto 1000 ml with same, and adjust pH 6.5 with 1 N potassium hydroxide. Now mix the phosphate buffer pH-6.5 solution with HPLC-grade acetonitrile in the ratio of 70:30 v/v, sonication was done for 15 minutes to remove any dissolved gases and finally filter with Millipore 0.22 µm filter.. Optimized chromatographic conditions Initially many trials were performed using different combination of mobile phases, different columns and varying chromatographic conditions in attempt to obtain the best separation and resolution between the PCM and NPX in chromatograms. So finally a Nucleosil C8 (250 X 4.6 mm, 5μm) column was found to be best suitable stationary phase, and phosphate buffer pH6.5 adjusted with 1N potassium hydroxide and acetonitrile in the ratio of 70:30 v/v was found to be best suitable mobile phase. Flow rate was adjusted to 1.0 ml/min, detection wavelength at 240 nm and column temperature was maintained at 300C, and the same chromatographic conditions were maintained throughout the study.. Preparation of standard stock solutions Weigh accurately about 100 mg of PCM and NPX reference standards separately and transfer into two different 100 mL volumetric flasks, and 50 mL of mobile phase was added as diluent. Shake the mixtures for 15 minutes and sonicate the solutions to remove any dissolved gases and finally make up volume upto the neck mark with same diluent.. Preparation of working standard solutions Take 10 ml of the PCM and NPX stock solutions from the respective containers and transfer into two different 100 mL volumetric flasks and make up volume upto the neck mark with diluent.. System suitability The system suitability parameters like theoretical plate, asymmetric factor, capacity factor, resolution, retention time and tailing factor were calculated with Waters (Alliance) Empower software. In order to establish system suitability for the instrument, six consecutive injections of PCM and NPX mixed standard were prepared from working standard solutions, each having 10 µg/ml and 8 µg/ml of PCM and NPX respectively, and analyzed.. Preparation of Sample solution Twenty tablets each containing 500 mg of PCM and 400 mg of NPX, were weighed accurately and finely powdered. From this an amount equivalent to 100 mg of PCM and 80 mg of NPX was weighed and transferred to a 100 ml clean volumetric flask. Around 50 ml of diluent was added and the mixture was shaken for 15 minutes for three times. The mixture was sonicated for 20 minutes to remove any dissolved gases and finally make up volume upto the neck mark with same diluent. Next filter the above solution with Whatmann filter paper with pore size of 40 A 0. From this 10 ml of the filtrate was diluted upto 100 ml in another volumetric flask. Finally 2 ml of the previous solution was taken and transferred to a 10 ml volumetric flask and the volume was made upto the neck mark using same diluent.. Method Validation As per ICH guidelines, the method validation parameters were performed for specificity, linearity, accuracy, precision, limit of detection, limit of quantification, robustness and ruggedness.. Specificity The specificity of the method was established through resolution factor of the drug peak from the nearest resolving peak and also among all other peaks. Specificity of the method was assessed by. 186.
(4) Krishanu Pal et al / Int. J. of Pharmacy and Analytical Research Vol-2(4) 2013 [184-193]. comparing chromatograms of blank, individual and mixed reference standards and formulation tablets. A blank solution (mobile phase) was injected and the chromatogram showed no interfering peaks at the retention time of both the drugs. The chromatograms of PCM and NPX extracted from the tablets were compared with the chromatograms acquired from PCM and NPX reference standards; correlation was found good in terms of Rt and peak area which indicates specificity of method.. After observing a steady base line with the optimized chromatographic conditions, three mixed drug dilutions of PCM and NPX bulk drugs each having 10 µg/ml and 8 µg/ml of PCM and NPX respectively were prepared and injected and the chromatograms were recorded. The procedure was repeated for the tablet sample dilutions having 10 µg/ml and 8 µg/ml of PCM and NPX respectively. Finally using the peak area values of PCM and NPX standard drug dilutions the % purity of the bulk drug and tablet formulation was calculated.. Linearity and Range Accuracy. Aliquots of standard stock solutions of PCM and NPX were taken in 10 ml volumetric flasks and diluted with diluent to get final concentrations in range of 2.5-15 μg/ml for PCM and 2-12 μg/ml for NPX. Triplicate injections were made five times for each concentration for each drug separately. The peak areas of the chromatograms were plotted against the concentrations for PCM and NPX both to obtain the respective calibration curves.. To ensure the reliability (accuracy) of the method, recovery studies were carried out by mixing standard quantity of standard drug with the preanalyzed sample formulation and the contents were reanalyzed by the proposed method. The accuracy of the method was determined by calculating recoveries of PCM and NPX by standard addition method. In this known amount of standard solutions of PCM and NPX (50%, 100% and 150% spike level) added to previously spiked tablet sample dilutions containing PCM and NPX were prepared in triplicate. A mixed standard dilution of 5: 4 µg/ml of PCM and NPX was prepared, and 50%, 100% and 150% from this solution was individually added to diluted sample formulation having 5: 4 µg/ml of PCM and NPX respectively, and analyzed.. LOD and LOQ The limit of detection (LOD) and limit of quantification (LOQ) were estimated from the set of 5 calibration curves obtained from serial dilutions of PCM and NPX working standard solution in order to obtain signal-to -noise ratio of 3:1 for LOD and 10:1 for LOQ. The LOD and LOQ may be calculated as – LOD = 3.3XSD/Slope and LOQ = 10XSD/Slope Where, SD= standard deviation of the Y-intercepts of the 5 calibration curves. Slope= Average of slopes of the 5 calibration curves.. Ruggedness The ruggedness of an analytical method is the degree of reproducibility of the test results Obtained by the analysts of the same samples under a variety of normal test conditions such as different laboratories, different analysts using same operational and environmental conditions that may differ but are still within the specified parameters of the assay. Ruggedness of the proposed method was determined by analysis of aliquots of the sample solution having 10 µg/ml and 8 µg/ml of PCM and NPX respectively by two analysts using same operational conditions.. Precision The precision study was carried out as both system and method precisions. The repeatability was carried out by performing assay of six dilutions of test sample preparation each having 10 µg/ml and 8 µg/ml of PCM and NPX respectively and from this % RSD was calculated (intraday). Intermediate precision of the method was checked by performing same procedure on a different day (interday) by another person under same experimental conditions.. Robustness Robustness of the method was determined by small, deliberate changes in flow rate, mobile phase ratio and detection wavelength. Typical changes include flow rate changing to 1.0±0.1 ml/min, column temperature change ±20C and detection wavelength change to 240±1 nm.. Assay study. 187.
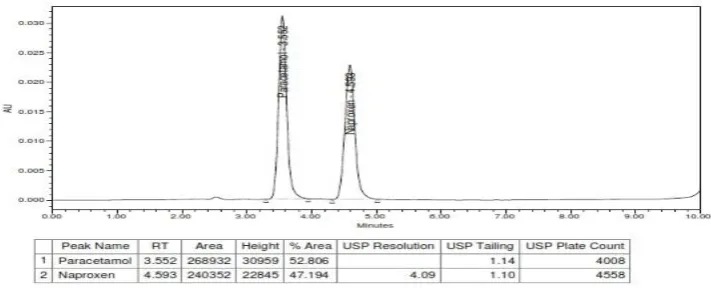
(5) Krishanu Pal et al / Int. J. of Pharmacy and Analytical Research Vol-2(4) 2013 [184-193]. 4.595±0.004 for NPX with flow rate of 1.0 ml/min and detection wavelength at 240 nm. With the optimized chromatographic conditions method validation parameters were performed for specificity, linearity, accuracy, precision, limit of detection, limit of quantification, robustness and ruggedness, and analyzed.. Result and discussion The present study was carried out with a view to develop a simple, accurate, precise and economical RP-HPLC method for simultaneous estimation of PCM and NPX in bulk drugs and pharmaceutical dosage forms. In order to achieve optimum separation of the component peaks, mixture of acetonitrile with phosphate and acetate buffer with different combinations were tested on a C-18 type stationary phase. Finally a mixture of phosphate buffer pH-6.5 adjusted with 1N potassium hydroxide and acetonitrile in the ratio of 70:30 v/v was selected as the most suitable mobile phase, as the chromatographic peaks were well defined and resolved with no tailing. The retention times were obtained 3.550±0.003 for PCM and. Specificity Specificity of the method was assessed by comparing chromatograms of blank, individual and mixed reference standards and formulation tablets, having a concentration of 10 µg/ml of PCM and 8 µg/ml of NPX. Respective chromatograms were compared for retention time, resolution factor and purity.. Figure-2: A typical chromatogram showing peaks of PCM and NPX in mixed standard solution. Table no-1: Specificity study for PCM and NPX in reference and tablet drug. S. No.. Sample type. Rt. Blank. Concentration of Drug in µg/ml PCM NPX 0 0. 1.. PCM -. 2.. PCM_RS. 10. 0. 3.. NPX _RS. 0. 4.. Mixed Standard Tablet Drug. 5.. Peak Area. Resolution. USP Plate Count. Tailing Factor. NPX -. PCM -. NPX -. PCM -. PCM -. NPX -. PCM -. NPX -. 3.552. -. 264699. -. -. 4069. -. 1.13. -. 8. -. 4.595. -. 240560. -. -. 4523. -. 1.10. 10. 8. 3.552. 4.593. 268932. 240352. 4.09. 4008. 4558. 1.14. 1.10. 10. 8. 3.551. 4.590. 269132. 239894. 4.11. 4013. 4569. 1.13. 1.10. 0.0162. 0.0548. 0.9356. 0.1418. 0.3449. 0.8404. 0.5279. 0.5095. 0. % RSD. NPX. drugs calibration curves were plotted, the correlation coefficient values were found to be linear (r2 = 0.999) and slope and intercept values were calculated.. Linearity The method shows linearity in the range of 2.5-15 μg/ml for PCM and 2-12 μg/ml for NPX. From the respective concentrations and peak areas of both. 188.
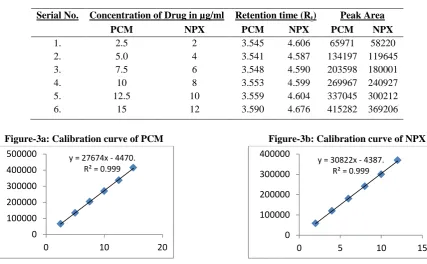
(6) Krishanu Pal et al / Int. J. of Pharmacy and Analytical Research Vol-2(4) 2013 [184-193]. Table no-2: Linearity values of PCM and NPX in mixed standard dilutions. Serial No. 1. 2. 3. 4. 5. 6.. Concentration of Drug in µg/ml PCM NPX 2.5 2 5.0 4 7.5 6 10 8 12.5 10 15 12. Retention time (Rt) PCM NPX 3.545 4.606 3.541 4.587 3.548 4.590 3.553 4.599 3.559 4.604 3.590 4.676. Figure-3a: Calibration curve of PCM 500000 y = 27674x - 4470.. Figure-3b: Calibration curve of NPX 400000. R² = 0.999. 400000. Peak Area PCM NPX 65971 58220 134197 119645 203598 180001 269967 240927 337045 300212 415282 369206. y = 30822x - 4387. R² = 0.999. 300000. 300000. 200000. 200000. 100000. 100000 0. 0 0. 10. 20. 0. 5. 10. 15. Table no-3: Statistical report of linearity study of PCM and NPX. Statistical Parameters. PCM. NPX. Correlation coefficient (r 2). 0.999. 0.999. Slope. 27674. 30822. Intercept. -4470. -4387. Precision intermediate precision (interday). The % RSD values were found to be less than 2% which falls within the acceptance criteria.. Six dilutions each having 10 µg/ml and 8 µg/ml of PCM and NPX respectively were selected for performing both repeatability (intraday) and. Table no-4: Repeatability study of PCM and NPX in mixed standard dilutions. Serial No.. 1. 2. 3. 4. 5. 6.. Concentration of Drug in µg/ml. PCM. NPX. PCM. NPX. Rt. Peak Area. Rt. Peak Area. 10 10 10 10 10 10. 8 8 8 8 8 8. 3.548 3.549 3.549 3.553 3.553 3.550. 266577 266909 270154 271218 270165 269846. 4.591 4.593 4.595 4.599 4.599 4.595. 239985 239990 240247 240122 241029 239998. Avg. SD % RSD. 3.5503 0.0022 0.062. 269144.83 1920.496 0.713. 4.5953 0.0032 0.070. 240228.50 405.411 0.169. 189.
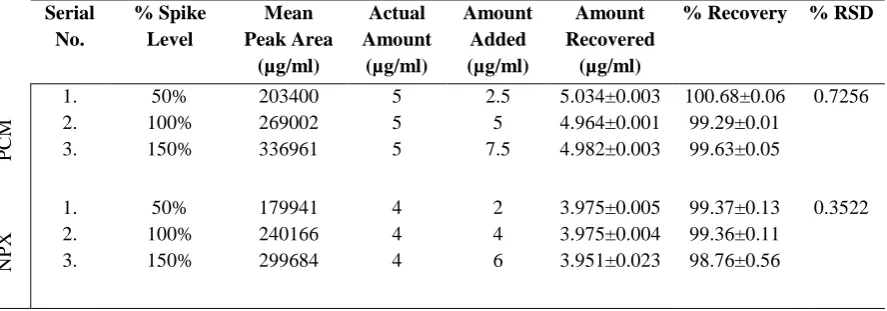
(7) Krishanu Pal et al / Int. J. of Pharmacy and Analytical Research Vol-2(4) 2013 [184-193]. Assay The assay study for PCM and NPX was performed for bulk and tablet formulations, and % purity values were calculated, which were found to be within the acceptance limit of 97-103%. Figure-3: A typical chromatogram showing peaks of PCM and NPX in tablet sample dilution. Table no-5: Assay results of PCM and NPX in bulk and tablet formulation dilutions.. Formulat ion. Bulk Drug. Serial No.. Concentration of Drug in µg/ml. Peak Area. Amount Obtained. % Purity. % RSD. 1. 2. 3.. PCM 10 10 10. NPX 8 8 8. PCM 271218 271323 270427. NPX 242099 241988 241027. PCM 10.046 10.050 10.017. NPX 8.039 8.035 8.003. PCM 100.46 100.50 100.17. NPX 100.49 100.44 100.04. PCM 0.1794. NPX 0.2458. 1. 2. 3.. 10 10 10. 8 8 8. 268834 268929 270443. 240344 241012 241326. 9.958 9.961 10.018. 7.981 8.003 8.013. 99.58 99.61 100.18. 99.76 100.04 100.16. 0.3388. 0.2053. 150% spike level. From the results obtained the % recovery and %RSD values were calculated and found to be within the acceptance criteria (< 2).. Accuracy Method accuracy was achieved by performing standard addition method with 50%, 100% and. Serial No.. % Spike Level. Mean Peak Area (µg/ml). Actual Amount (µg/ml). Amount Added (µg/ml). Amount Recovered (µg/ml). % Recovery. % RSD. 50% 100% 150%. 203400 269002 336961. 5 5 5. 2.5 5 7.5. 5.034±0.003 4.964±0.001 4.982±0.003. 100.68±0.06 99.29±0.01 99.63±0.05. 0.7256. PCM. 1. 2. 3. 1. 2. 3.. 50% 100% 150%. 179941 240166 299684. 4 4 4. 2 4 6. 3.975±0.005 3.975±0.004 3.951±0.023. 99.37±0.13 99.36±0.11 98.76±0.56. 0.3522. NPX. Table no-5: Recovery study of PCM and NPX by standard addition method.. 190.
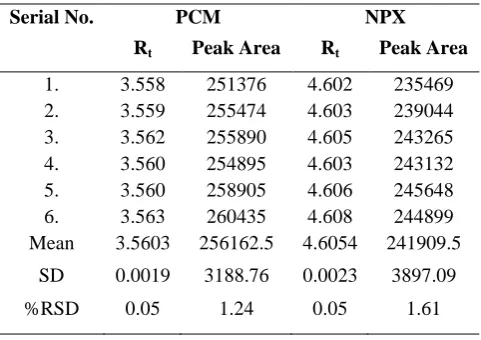
(8) Krishanu Pal et al / Int. J. of Pharmacy and Analytical Research Vol-2(4) 2013 [184-193]. LOD and LOQ. System suitability. Limit of detection and limit of quantification were established by evaluating the five calibration curves obtained from the five set of serial dilutions of PCM and NPX working standard solutions. The LOD values were found to be 0.572 µg/ml and 0.684 µg/ml for PCM and NPX respectively, and LOQ values were found to be 1.733 µg/ml and 2.072 µg/ml for PCM and NPX respectively.. System suitability was achieved by performing six consecutive injections of PCM and NPX mixed standard each having 10 µg/ml and 8 µg/ml of PCM and NPX respectively, and analyzed for their peak area, resolution, theoretical plates and tailing factor. The results of system suitability study were shown in the table-6, which shows within the acceptance limit.. Table no-6: System suitability results for PCM and NPX mixed standard dilutions.. Parameters. PCM. NPX. Acceptance. Retention time (Rt) in minutes USP Resolution (Rs). 3.550±0.003. 4.595±0.004. ˃2.5. USP Tailing. 1.13. 1.10. 0.8-1.2. USP Plate count (N). 4273.17±14.83. 5136.83±6.17. ˃2000. ˃2. 4.29. Ruggedness NPX respectively by two analysts using same operational conditions, and the data obtained was given in the table-6.. Ruggedness of the proposed method was determined by analysis of aliquots of the sample solution having 10 µg/ml and 8 µg/ml of PCM and. Table no-6: Ruggedness study for PCM and NPX in sample dilutions. Serial No.. PCM. NPX. Rt. Peak Area. Rt. Peak Area. 1. 2. 3. 4. 5. 6. Mean. 3.558 3.559 3.562 3.560 3.560 3.563 3.5603. 251376 255474 255890 254895 258905 260435 256162.5. 4.602 4.603 4.605 4.603 4.606 4.608 4.6054. 235469 239044 243265 243132 245648 244899 241909.5. SD. 0.0019. 3188.76. 0.0023. 3897.09. %RSD. 0.05. 1.24. 0.05. 1.61. deliberate change in some operational analytical conditions such as temperature and flow rate. The data obtained was given in the table-7.. Robustness Robustness was determined by analyzing same sample at normal operating conditions but. 191.
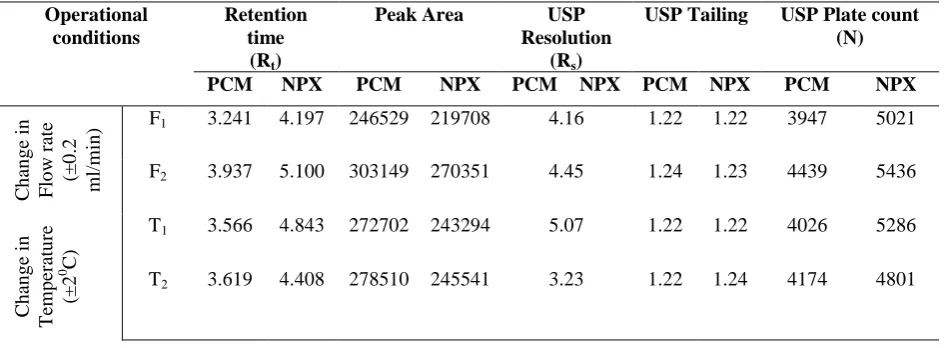
(9) Krishanu Pal et al / Int. J. of Pharmacy and Analytical Research Vol-2(4) 2013 [184-193]. Table no-7: Robustness study for PCM and NPX in sample dilutions. Peak Area. PCM. NPX. USP Resolution (Rs) PCM NPX. USP Tailing. USP Plate count (N). PCM. NPX. PCM. NPX. Change in Flow rate (±0.2 ml/min). Retention time (Rt) PCM NPX F1. 3.241. 4.197. 246529. 219708. 4.16. 1.22. 1.22. 3947. 5021. F2. 3.937. 5.100. 303149. 270351. 4.45. 1.24. 1.23. 4439. 5436. Change in Temperature (±20C). Operational conditions. T1. 3.566. 4.843. 272702. 243294. 5.07. 1.22. 1.22. 4026. 5286. T2. 3.619. 4.408. 278510. 245541. 3.23. 1.22. 1.24. 4174. 4801. has unique advantage of LC conditions being compatible with MS detection. Therefore this method can be employed in quality control to estimate the amount of PCM and NPX in bulk and combined dosage forms.. CONCLUSION In the proposed project work a RP-HPLC method was developed and also successfully validated as per ICH guidelines. So the proposed method was found to be suitable enough for routine quality control analysis for simultaneous estimation of PCM and NPX in bulk drugs and as well as in combination using isocratic mode of elution. The results of linearity, precision, accuracy, and specificity proved to be within the limit. The method provides selective quantification of PCM and NPX without interference from diluents and placebo. The proposed method was found highly sensitive, reproducible, reliable, rapid and also. ACKNOWLEDGEMENT The authors are grateful to Bio-Leo labs, Hyderabad for permitting to carry out the research work, Aurobindo Pharma, Hyderabad for providing gift samples of PCM and NPX, and also to SriKrupa Institute of Pharmaceutical Sciences, Siddepet for project guidance and support.. REFERENCES [1] Indian Pharmacopoeia-2010, The Indian Pharmacopoeia Commission, published by Ministry of Health and Family Welfare, Govt. of India, vol-III: 1754&1859. [2] The United States Pharmacopoeia by United States Pharmacopoeial Convention Inc, Rock Hill, MD; 2010, vol-III: 2760& 2985. [3] British Pharmacopoeia volume-I Monographs: medicinal and pharmaceutical substances, 2002, volI, 1200& 1300. [4] ICH, Q2(R1), Validation of analytical procedures: Text and methodology, International Conference on Harmonisation, IFPMA, Geneva, 2005. [5] KD Tripathi, Essentials of Medical Pharmacology, 6 th edition, Jaypee publishers, 2008, 266-69. [6] Karuna B Singh, Shekhar B Waikar and Suhas P Padmane, A validated RP-HPLC method for the simultaneous estimation of Paracetamol and Naproxen in tablet formulation, International journal of pharmaceutical sciences and research, 2012, vol- 3(10): 3742-3745. [7] Prinesh N Patel, Gananadhamu Samanthula, Vishal Kumar Shrigod, Sudip Kumar C Modh and Jainish Kumar R Chaudhari, RP-HPLC method for determination of several NSAIDs and their combination drugs, Chromatography Research International, 2013: 1-13. [8] Md. Shozan Mondal, Md. Ahsanul Haque, Mohammad Safiqul Islam and SM Ashraful Islam, Development and Validation of RP-HPLC method for the simultaneous estimation of Domperidone. 192.
(10) Krishanu Pal et al / Int. J. of Pharmacy and Analytical Research Vol-2(4) 2013 [184-193]. and Naproxen in tablet dosage form, Journal of Applied Pharmaceuticaal Sciences, 2011, vol 01(07): 145-148. [9] Sunil Singh, Surabhi Sharma, Ajit Kumar Yadav and Hemendra Gautam, Simultaneous estimation of Naproxen and Domperidone using UV- Spectrophotometer in tablet dosage form, Bulletin of Pharmaceutical Research, 2013, vol- 3(2): 66-70. [10] CK Oza, R Nighawan, MK Pandya, AJ Vyas, AI Patel, Q-Analysis Spectrophotometric method for the Simultaneous determination of Nabumetone and Paracetamol in tablet dosage forms, Asian J. Pharm. Ana, 2013, vol- 3(1): 09-16. [11] T Manikya Rao, T Prabhakar, G Girija Sankar and PVL Naidu, Stability indicating assay of Esomeprazole and Naproxen in tablets by RP-UPLC PDA method, International Journal of Pharma Sciences, 2013, vol- 3(2): 205-210. *******************************. 193.
(11)
Figure
+2
Related documents
Patients with inflammatory bowel disease (IBD) may have increased risk of developing CDI, along with worse outcomes, higher rates of colectomy and higher rates of recurrence
According to the principle of the inferential privacy, to avoid the dependence on a particular learning model, we proposed a mutual information based feature selection method and
This study investigated the influence of five El Niño–Southern Oscillation (ENSO) types on rainy-season precipitation in China: central Pacific warming (CPW), east- ern Pacific
We investigated the impact of physical fitness, BMI and gender of the provider on the quality of ECC when per- forming CVRs of 15:2 and 30:2. Our main findings are as follows: 1)
DICs: Drop in Centers; FSW: Female sex workers; HIV: Human Immunodeficiency Virus; IBBSS: Integrated Biological and Behavioral Surveillance Survey; ICCPR: International Covenant
Respondents who wanted to see risk information as three disease outcomes over one time horizon per graph argued that they liked everything "all on one sheet", and that
ACR: American College of Rheumatology; AS: Ankylosing spondylitis; ASAS: The Assessment of Spondyloarthritis Society; BASDAI: The Bath Ankylosing Spondylitis Disease Activity
The strength of the study is that 1) interventions from the evidence based Clinical Nursing Rehabilitation Stroke Guideline are implemented in the rehabilitation care of older
