Volume 3, Issue 3, March 2014
Page 271
Abstract
This paper deals with the study of ECG signals using wavelet transform analysis. The Electrocardiogr am (ECG) shows the electrical action of the heart and is used by physicians to check the heart’s condition. Analysis of ECG becomes complex if noise is rooted with signal during acquirement. In this paper, denoising techniques for ECG signals based on Decomposition will be compared. Firstly different wavelets will be applied like Haar,dbN and Symlet wavelet. Then thresholding technique will be applied for getting denoised signal.
Keywords – ECG,Wavelet, Denoising, Thresholding.
1. Introduction
The electrocardiogram (ECG) is a graphical recording of the electrical signals generated by the heart. The signals are generated when cardiac muscles depolarise in response to electrical impulses generated by pacemaker cells. Upon depolarisation, the muscles contract and pump blood throughout the body. The ECG reveals many things about the heart, including its rhythm, whether its electrical conduction paths are intact, whether certain chambers are enlarged, and even the approximate ischemic location in the event of a heart attack (myocardial infarction).
Waves are labeled using the letters P, QRS, T and U. The typical normal ECG may not show a U wave. ECG is used clinically in diagnosing various abnormalities and conditions associated with the heart.
Figure 1. ECG signal
It has been used extensively for detection of heart disease. ECG is non-stationary bioelectrical signal including valuable clinical information, but frequently the valuable clinical information is corrupted by various kinds of noise. The main sources of noise are:
power-line interference from 50–60 Hz pickup and harmonics from the power mains;
baseline wanders caused by variable contact between the electrode and the skin and respiration; muscle contraction form electromyogram (EMG) mixed with the ECG signals; electromagnetic interference from other electronic devices and noise coupled from other electronic devices, usually at high frequencies. The noise degrades the accuracy and precision of an analysis. Obtaining true ECG signal from noisy observations can be formulated as the problem of signal estimation or signal denoising. So denoising is the method of estimating the unknown signal from available noisy data.
2 .Literature Review
Raw ECG data contain some noise and artifact components that alter the expression of the ECG trace from the ideal structure described previously and render the clinical interpretation inaccurate and misleading; consequently, a preprocessing step for improving the signal quality is a necessity. It is therefore important to be familiar with the most common types of noise and artifacts in the ECG and address a method which can compensate for their presence before proceeding to the feature extraction step.
Noise Removal from ECG Signal by
Thresholding with Comparing Different
Types of Wavelet.
Upasana Mishra[1], Mr. Love Verma[2]
[1] [2]
Volume 3, Issue 3, March 2014
Page 272
In recent years wavelet transform (WT) has become good technique in the field of signal processing. Donoho et al [1][2] proposed the denoising method called “wavelet shrinkage”; it has three steps: forward wavelet transform, wavelet coefficients shrinkage at different levels and the inverse wavelet transform, which work in denoising the signals such as Universal threshold, SureShrink, Minimax.
De-noising using traditional DWT has a translation variance problem which results in Pseudo-Gibbs phenomenon in the Q and S waves, so the following algorithms tried to solve this problem: used cyclic shift tree de-noising technique for reducing white Gaussian noise or random noise, EMG noise and power line interference[3].
The performance of ECG analyzing system depends mainly on the accurate and reliable detection of the QRS complex, as well as T- and P waves. The P-wave represents the activation of the upper chambers of the heart, the atria, while the QRS complex and T-wave represent the excitation of the ventricles or the lower chamber of the heart. The detection of the QRS complex is the most important task in automatic ECG signal analysis. Once the QRS complex has been identified a more detailed examination of ECG signal including the heart rate, the ST segment etc. can be performed [4].
Wavelet thresholding de-noising methods deals with wavelet coefficients using a suitable chosen threshold value in advance. The wavelet coefficients at different scales could be obtained by taking DWT of the noisy signal. Normally, those wavelet coefficients with smaller magnitudes than the preset threshold are caused by the noise and are replaced by zero, and the others with larger magnitudes than the preset threshold are caused by original signal mainly and kept (hard-thresholding case) or shrunk (the soft-(hard-thresholding case). Then the denoised signal could be reconstructed from the resulting wavelet coefficients. These methods are simple and easy to be used in de-noising of ECG signal. But hardthresholding de-noising method may lead to the oscillation of the reconstructed ECG signal and the soft thresholding de-noising method may reduce the amplitudes of ECG waveforms, and especially reduce the amplitudes of the R waves. To overcome the above said disadvantages an improved thresholding de-noising method is proposed [5][6][7][8].
ECG signal is easy to be contaminated by random noises uncorrelated with the ECG signal, such as EMG, baseline wandering and so on, which can be approximated by a white Gaussian noise source[9].
EMD (Emperical mode decomposition) has recently been proposed by N.E.Huang in 1998 which is developed as a data-driven tool for nonlinear and non-stationary signal processing.
Two rules are generally used for thresholding the wavelet coefficients (soft/hard thresholding). Hard thresholding sets zeros for all wavelet coefficients whose absolute value is less than the specified threshold limit. It has shown that hard thresholding provides an improved signal to noise ratio [12].
Martinez et al. [11] presented a robust ECG delineation method based on discrete wavelet transform (DWT) over a wide range of morphologies that was able to handle different noises and outperformed the results of other well known algorithms, especially in determining the end of the T wave.
3. Wavelet
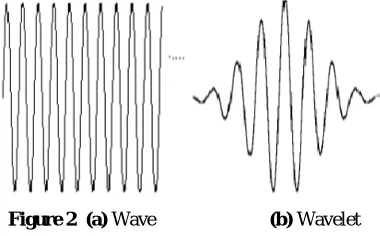
A ‘wavelet’ is a small wave which has its energy concentrated in time. It has an oscillating wavelike characteristic but also has the ability to allow simultaneous time and frequency analysis and it is a suitable tool for transient, non-stationary or time-varying phenomena [1, 2].
Figure 2 (a) Wave (b) Wavelet
3.1 What Can Wavelet Analysis Do?
One major advantage afforded by wavelets is the ability to perform local analysis -- that is, to analyze a localized area of a larger signal.
Volume 3, Issue 3, March 2014
Page 273
4. Methodology
4.1 De-Noising Procedure Principles
The general de-noising procedure involves three steps. The basic version of the procedure follows these steps: 1. Decompose
2. Choose a wavelet, choose a level N. Compute the wavelet decomposition of the signal s at level N. 3. Threshold detail coefficients
4. For each level from 1 to N, select a threshold and apply soft thresholding to the detail coefficients. 5. Reconstruct
6. Compute wavelet reconstruction using the original approximation coefficients of level N and the modified detail coefficients of levels from 1 to N.
7. Performance Evalaution.
5. Decomposition of signal
5.1 Multiple-Level DecompositionThe decomposition process can be iterated, with successive approximations being decomposed in turn, so that one signal is broken down into many lower resolution components. This is called the wavelet decomposition tree.
Figure 3. Decomposition of signal
6. Types of Wavelets
6.1 Haar Wavelet-
Any discussion of wavelets begins with Haar wavelet, the first and simplest. Haar wavelet is discontinuous, and resembles a step function. In mathematics, the Haar wavelet is a sequence of rescaled "square-shaped" functions which together form a wavelet family or basis.
The technical disadvantage of the Haar wavelet is that it is not continuous, and therefore not differentiable. This property can, however, be an advantage for the analysis of signals with sudden transitions, such as monitoring of tool failure in machines.[2]
6.2 dbN
These wavelets have no explicit expression except for db1, which is the Haar wavelet. However, the square modulus of the transfer function of h is explicit and fairly simple.
Ingrid Daubechies, one of the brightest stars in the world of wavelet research, invented what are called compactly supported orthonormal wavelets -- thus making discrete wavelet analysis practicable
6.3 Symlet Wavelets: symN
In symN, N is the order. Some authors use 2N instead of N. Symlets are only near symmetric; consequently some authors do not call them symlets.
7. Thresholding Techniques
7.1 Thresholding
Thresholding is one of the most often used processing tools in wavelet signal processing. It is used in noise reduction, in signal and image compression, and sometimes in signal recognition. The four types of thresholding we use are (l)hard thresholding, (2)soft thresholding, (3)quantile thresholding, and (4)universal thresholding. The choice of thresholding methods depends on the application. We discuss each type here briefly.
7.2 Hard thresholding
Hard thresholding sometimes is called gating. If a signal (or a coefficient) value is below a preset value, it is set to zero.
Volume 3, Issue 3, March 2014
Page 274
where is the threshold value or the gate value.
7.3 Soft thresholding
Soft thresholding is defined as
The function f (x) generally is a linear function (a straight line with slope to be chosen). However, spline curves of third or fourth orders may be used to effectively weight the value greater than a.
7.4 Quantile thresholding
In certain applications, such as image compression, where a bit quota has been assigned to the compressed file, it is more advantageous to set a certain percentage of wavelet coefficients to zero to satisfy the quota requirement. In this case, the setting of the threshold value a is based
on the histogram and total number of coefficients. The thresholding rule is the same as hard thresholding.
7.5 Universal thresholding
In some noise removal applications in which the noise statistics is known, it may be more effective to set the threshold value based on the noise statistics. For example, Donoho and Johnstone [8] set the threshold value to be
where v is the standard deviation of the noise and l is the cardinality of the data set. This threshold value can be used in either hard or soft thresholding as shown earlier.
8-Results
0 2000 4000 6000 8000 1800
2000 2200
original
0 2000 4000 6000 8000 2000
2100 2200
a5
0 2000 4000 6000 8000 1800
2000 2200
a4
0 2000 4000 6000 8000 1800
2000 2200
a3
0 2000 4000 6000 8000 1800
2000 2200
a2
0 2000 4000 6000 8000 1800
2000 2200
a1 Original Signal and its approximation for db6 wavelet
Figure 8.1Original ECG signal and its approximations using bd6 wavelet
0 2000 4000 6000 8000 1800
2000 2200
original
0 2000 4000 6000 8000 2000
2100 2200
a5
0 2000 4000 6000 8000 1800
2000 2200
a4
0 2000 4000 6000 8000 1800
2000 2200
a3
0 2000 4000 6000 8000 1800
2000 2200
a2
0 2000 4000 6000 8000 1800
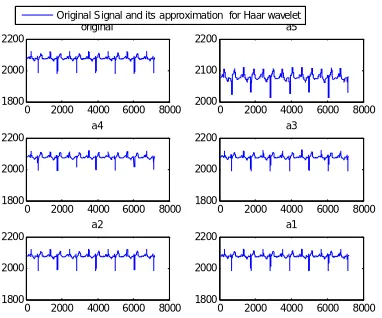
2000 2200
a1 Original Signal and its approximation for Haar wavelet
Volume 3, Issue 3, March 2014
Page 275
0 1000 2000 3000 4000 5000 6000 7000 8000
1950 2000 2050 2100 2150
ORIGINAL ECG SIGNAL
0 1000 2000 3000 4000 5000 6000 7000 8000
1950 2000 2050 2100 2150
DENOISED ECG SIGNAL AT ALPHA=2 WHEN DECOMPOSED AT4 LEVEL haar
Figure 8.3 Original ECG signal and its denoised version using haar wavelet for alpha=2 and decomposition level 4 using Birge Techique
.
0 1000 2000 3000 4000 5000 6000 7000 8000
1950 2000 2050 2100 2150
ORIGINAL ECG SIGNAL
0 1000 2000 3000 4000 5000 6000 7000 8000
1950 2000 2050 2100 2150
DENOISED ECG SIGNAL AT ALPHA=2 WHEN DECOMPOSED AT4 LEVEL db6
Figure 8.4 Original ECG signal and its denoised version using Doubechie 6 wavelet for alpha=2 and decomposition level 4 using Birge Techique
0 1000 2000 3000 4000 5000 6000 7000 8000
1950 2000 2050 2100 2150
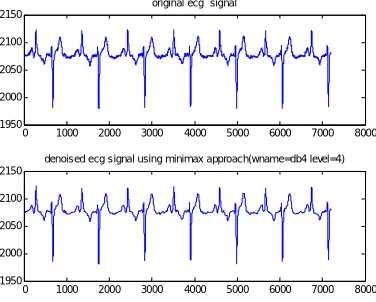
original ecg signal
0 1000 2000 3000 4000 5000 6000 7000 8000
1950 2000 2050 2100 2150
denoised ecg signal using minimax approach(wname=db4 level=4)
Figure 8.5 applied minimax denoising technique at 4 level of decomposition for wavelet doubechie 4 and the results obtained were shown.
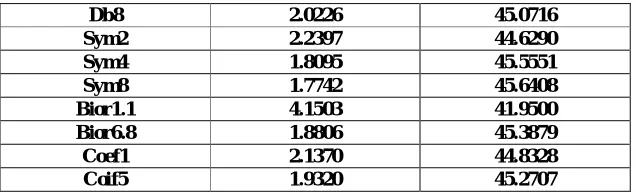
Table 8.1 MSE and PSNR (db) for minimax technique at 4 decomposition level.
Parameter Wavelets
MSE PSNR(db)
Haar 4.1503 41.9500
Db2 2.2397 44.6290
Volume 3, Issue 3, March 2014
Page 276
Db8 2.0226 45.0716
Sym2 2.2397 44.6290
Sym4 1.8095 45.5551
Sym8 1.7742 45.6408
Bior1.1 4.1503 41.9500
Bior6.8 1.8806 45.3879
Coef1 2.1370 44.8328
Coif5 1.9320 45.2707
We have calculated the MSE and PSNR for 1, 2, 3 and 4 level of decomposition and the results of 4 decomposition levels are indicated in table 5.1. The table 5.1 indicates that higher wavelet of a particular family shows better results in terms of MSE and PSNR.
Table 8.2 MSE and PSNR (db) for Heursure technique at 5 decompostion level.
Parameters
Wavelets MSE PSNR
Haar 2.9720 43.4004
Db2 2.2090 44.6888
Db4 1.7205 45.7743
Db8 1.7339 45.7405
Sym2 2.2090 44.6888
Sym4 1.6755 45.8893
Sym8 1.7634 45.6672
Bior1.1 2.9720 43.4004
Bior6.8 1.7852 45.6140
Coef1 1.7054 45.8126
Coif5 1.6274 46.0159
Table 8.2 shows that results of heuresure technique at 5 decompostion level.PSNR values are comparatively higher.
Table 8.3 MSE and PSNR (db) for Level dependent technique at 4 decompostion level at alpha=1.5.
Parameters
Wavelets
MSE
PSNR
Haar
3.0096
43.3457
Db2
1.3031
46.9810
Db4
1.0402
47.9597
Db8
1.1008
47.7138
Sym2
1.3031
46.9810
Sym4
1.0752
47.8160
Sym8
1.0345
47.9834
Bior1.1
3.0096
43.3457
Bior6.8
1.0774
47.8070
Coef1
1.2437
47.1837
Coif5
1.0952
47.7357
Results of level dependent denoising technique is shown in table 8.3
Table8.4 MSE and PSNR (db) for level dependent technique at 4 decompostion level at alpha=4
Parameters
Wavelets MSE PSNR
Haar 0.0029 73.5809
Db2 0.0026 74.0365
Db4 0.0016 76.0184
Volume 3, Issue 3, March 2014
Page 277
Db8 0.0011 77.7587
Symlet2 0.0026 74.0365
Symlet4 9.4487e-004 78.3771
Symlet6 8.6265e-004 78.7725
Symlet 8 0.0011 77.9085
From the table 8.4. it can be seen that very high PSNR and low MSE value for level dependent thresholding technique. So the technique can be employed for denosing is sources of noise is unknown
9. Conclusions and Future Aspects
This chapter discusses about conclusion and future aspects of the research work.
We have studied characteristics and behavior of various wavelets. Decomposition of signals at various levels affects the results.
Through the research we have drawn following conclusions:
1. For denoising purpose signals should be decomposed higher levels.
2. Level dependent thresholding gives better as compared to global thresholding techniques. 3. Symlet and Doubechies wavelets gives comparatively better results than haar wavelet. 4. Higher value of alpha smoothes the signals.
Future Aspects
We have selected only three wavelts for our results , more wavlets may be employed. In future one may add noise and then perform denoising
.
REFERENCES
:
[1] Donoho DL, Johnstone IM(1994). “Ideal spatial adaptation by wavelet shrinkage”, Biometrika, Vol.81, No.3, pp. 425-455.
[2] Donoho DL(1995). “De-noising by soft-thresholding”, IEEE Trans Inform Theory, Vol.14, No.3,pp. 612-627.
[3] Kumari, R.S.S; Thilagamanimala, A ; Sadasivam, V (2008). “ECG signal interferences removal using wavelet based CSTD technique”, Proceedings - International Conference on Computational Intelligence and Multimedia Applications, pp. 530-534.
[4] C. Li, C. Zheng (1993) Proc. Annual Int. Conf. IEE Eng. in Med. & Biol. Soc., San Diego, California, 330331.
[5] R.R. Coifman and D.L. Donoho(1994). “Translation-invariant denoising”, in Wavelets and Statistics, Springer Lecture Notes in Statistics 103, Newyork: Springer-Verlag, pp.125-150.
[6] T.D. Bui and G. Chen,(1998) “Translation-invariant de-noising using multi-wavelets”, IEEE Trans. Signal Processing, vol.46, pp. 3414-3420.
[7] S.A. Chouakri, and F. Bereksi-Reguig,(2005) “Wavelet denoising of the electrocardiogram signal based on the corrupted noise estimation”, Computers in Cardiology, Vol.32, pp.1021-1024.
[8] S.A. Chouakri, F. Bereksi-Reguig, S. Ahmaidi, and O.Fokapu,(2007) “ECG signal smoothing based on combining wavelet denoising levels”, Asian Journal of Information Technology, Vol. 5(6), pp. 666-627, 2006.
[9] P.M. Agante and J.P. Marques de sa, “ECG noise filtering using wavelets with soft-thresholding methods”, Computers in Cardiology, vol. 26, pp. 523-538, 1999.
[10]Huang.N.E, et al(1998). The empirical mode composition and the Hilbert spectrum for nonlinear and non-stationary time series analysis, Proceeding of R.Soc.Lond.A
[11]Martinez J., Almeida R., Olmos S, Rocha A, Laguna A(2004 ) “ A wavelet-based ECG de-lineator: Evaluation on standard databases” IEEE Trans Biomed Eng No.51,vol. 4,pp. 570-581, 2004.
[12]Coifman R.R. and. Donoho D.L.(1994) “Translation-invariant denoising”, in Wavelets and Statistics, Springer Lecture Notes in Statistics 103, Newyork: Springer-Verlag, pp.125-150.
[13]A Wavelet-based Approach to Electrocardiogram (ECG)
and Phonocardiogram (PCG) Subject Recognition by Seyedeh Zahra Fatemian
[14]The MIT -BIH Arrhythmia database, http://www.physionet.org/physiobank/database/mitdb/