The University of San Francisco
USF Scholarship: a digital repository @ Gleeson Library |
Geschke Center
Master's Theses Theses, Dissertations, Capstones and Projects
Spring 5-16-2014
Glass Foundation Chemosensor Synthesis and
Functionality Analysis
Justin D. Dancer
University of San Francisco, [email protected]
Follow this and additional works at:https://repository.usfca.edu/thes Part of theAnalytical Chemistry Commons
This Thesis is brought to you for free and open access by the Theses, Dissertations, Capstones and Projects at USF Scholarship: a digital repository @ Gleeson Library | Geschke Center. It has been accepted for inclusion in Master's Theses by an authorized administrator of USF Scholarship: a digital repository @ Gleeson Library | Geschke Center. For more information, please [email protected].
Recommended Citation
Dancer, Justin D., "Glass Foundation Chemosensor Synthesis and Functionality Analysis" (2014).Master's Theses. 191.
Glass Foundation Chemosensor Synthesis
and Functionality Analysis
A Thesis Presented to the Faculty
of the Department of Chemistry
at the University of San Francisco
in partial fulfillment of the requirements for the Degree of
Master of Science in Chemistry
Written by:
Justin Dancer
Bachelor of Science in Chemistry
Saint Mary’s College of California, Moraga, CA
Glass Foundation Chemosensor Synthesis
and Functionality Analysis
Thesis written by Justin D. Dancer
This thesis is written under the guidance of the Faculty Advisory Committee, and approved by all its members, has been accepted in partial fulfillment of the requirements for the degree of
Master of Science in Chemistry
at
the University of San Francisco
Thesis Committee
Lawrence Margerum, Ph.D. Research Advisor
William Melaugh, Ph.D. Professor
Ryan West, Ph.D. Assistant Professor
Acknowledgement
I would like to thank my research advisor Dr. Larry Margerum for his help and guidance
throughout my years at USF. I very much appreciate all the time and effort he put into our research
and thesis editing. He was easily approachable and was always available to answer questions. I
want to thank Dr. Melaugh and Dr. West for taking the time to be my thesis readers. I also want
to thank Deidre Shymanski for all of her hard work behind the scenes in the chemistry
department. I want to thank my five lab mates Jon, Katie, Alicia, Clara, and Simon for making
our lab not only a place for learning but a place for fun as well. I want to thank my fiancé Audrey
for all her love, support, encouragement, and insight throughout the writing of this thesis. Lastly,
I want to thank my family, especially my parents and grandparents, for their love and support
before, during, and after this graduate school journey. They instilled in me the importance of
education from a very young age and set the foundation for me to be able to succeed. I cannot
iv
Table of Contents
Introduction to Chemosensor Synthesis ... 1
1.1 Controlled Pore Glass ... 1
1.1.1 Background ... 1
1.1.2 Pore and Particle Size ... 2
1.1.3 Surface Chemistry... 3
1.2 Dendrimers ... 4
1.2.1 Background ... 5
1.2.2 PAMAM Dendrimers ... 6
1.2.2.1 Initiator Cores, Branching Units, and Surface Groups of PAMAM Dendrimers 8 1.2.2.2 Dendrimer Size ... 9
1.2.3 Dendrimer Macromolecular Reactions ... 10
1.3 Indicator Displacement Assay (IDA) ... 12
1.4 Research Goals ... 13
1.5 References ... 14
Chapter 2 ... 16
Synthesis and Characterization of a Molecular Sensing Ensemble from a Controlled Pore Glass Foundation ... 16
2.1 Introduction ... 16
2.1.1 CPG Acid Cleaning ... 16
2.1.2 CPG Activation ... 17
2.1.2.1 CPG Activation via 1,1’-carbonyldiimidazole (CDI) ... 17
2.1.2.2 CPG Activation via 3-(Triethoxysilyl)propylsuccinic anhydride ... 18
2.1.3 PAMAM Dendrimer Coupling to Activated CPG ... 18
2.1.4 Functional Group Density Assays ... 19
2.1.5 PAMAM activation via CDI ... 20
2.1.6 Ligand Reactions to Immobilized PAMAM Dendrimers ... 20
2.1.6.1 Coupling of Nα, Nα-bis(carboxymethyl)-L-lysine ... 20
v
2.1.7 Metal Chelation to the Ligands Coupled to CPG-Gx ... 22
2.1.8 Indicator Displacement Assays on the CPG-Gx-NTA/Terpy-M2+ Ensemble23 2.2 Experimental Section ... 24
2.2.1 Chemicals and Materials ... 24
2.2.2 Instrumentation ... 26
2.2.3 Procedures ... 26
2.2.3.1 Controlled Pore Glass (CPG) Cleaning ... 26
2.2.3.2 Activation of CPG ... 27
2.2.3.2.1 Activation with CDI ... 27
2.2.3.2.2 Activation with TESPSA ... 27
2.2.3.3 PAMAM Dendrimer Immobilization on Activated CPG ... 27
2.2.3.4 Lysine NTA and A-terpy Couplings ... 28
2.2.4 Characterizations ... 29
2.2.4.1 Amine Density on CPG: 4NB Assay ... 29
2.2.4.2 CDI Density on CPG: Imidazole Assay ... 29
2.2.5 A-terpy Synthesis ... 30
2.3 Results and Discussion ... 31
2.3.1 Surface Primary Amine Density Assay ... 31
2.4 Conclusion ... 33
2.5 References ... 35
Experimental: Synthesis, Methods, and Assays for Molecular Sensing Ensembles ... 36
3.1 Results and Discussion: Ensemble Characterization and IDAs... 36
3.2 CPG-CDI-G3,4-terpy-Cu ... 36
3.2.1 CDI Coupled to CPG ... 37
3.2.2 PAMAM Dendrimer Reactions to CPG-CDI ... 38
3.2.3 CDI Activation of CPG-G3,4 ... 40
3.2.4 A-terpyridine Activation of CPG-G3,4 ... 41
3.2.5 Copper Loading onto CPG-G3,4-terpy Precursors ... 43
3.2.6 Indicator Displacement Assays for CPG-G3,4-terpy-Cu ... 44
3.3.1 TESPSA Coupling to CDI ... 47
vi
3.3.3 CDI activation to CPG-TESPSA-G3 ... 48
3.3.4 Lysine-NTA Ligand Activation and Copper Loading to CPG-TESPSA-G3 .. 49
3.3.5 IDAs on CPG-TESPSA-G3-NTA-Cu Chemosensors ... 49
3.4 Conclusion ... 52
3.5 References ... 54
Chemosensor Optimization and Other Future Research Areas ... 55
4.1 Introduction ... 55
4.2 Synthesis and Assay Optimization ... 55
4.2.1 TESPSA Usage and Proof of Coupling ... 55
4.2.2 Dendrimer Generation Usage on Future Chemosensors ... 56
4.2.4 Ligand Diversity ... 57
4.2.5 Dye Optimization ... 58
4.2.6 Additional Substrates for IDAs ... 60
4.3 Conclusions ... 61
Abstract
Chemosensors are created through a series of reaction steps on controlled pore class (CPG)
and terminate with a Cu2+ metal binding site. Each monolayer of reactant insures that the metal
binding site exposed to solution would serve as an indicator displacement assay (IDA) sensor. The
purpose of this research is to create a molecular sensor with a high density of terminal metal sites
to quantify bidentate substrates. To accomplish this, each synthetic step of the sensor is examined
in order to test the effects of new linkers, ligands, and variously sized dendrimers to see if small
structural changes could promote a higher density of terminal metal sites. For linkers, the results
show that CDI and TESPSA are comparable in functionality, whereas the ligand, lysine-NTA
outperforms an amino-functionalized terpyridine in metal chelation. For dendrimers, higher
generation dendrimers lead to more terminal Cu2+ metal binding sites than lower generation
1
Chapter 1
Introduction to Chemosensor Synthesis
In this research, molecular sensing ensembles are created through a series of reaction steps
on controlled pore class (CPG). Each monolayer of reactant insures that the metal binding site
exposed to solution would serve as an indicator displacement assay (IDA) sensor. The purpose of
this research is to create a molecular sensor with a high density of terminal metal sites using
dendrimers to quantify bidentate substrates. To accomplish this, each part of the sensor is
examined in order to test the effects of new ligands, metals, and dendrimers that could promote a
higher density of terminal metal sites. This chapter introduces the chemistry of the solid
foundation CPG, polyamidoamine (PAMAM) dendrimers, and the IDA as a method to quantify
dye and bidentate substrates in solution via color change.1
1.1Controlled Pore Glass
CPG serves as the foundation and starting point for the synthesis of a molecular sensing
ensemble. CPG has a wide variety of uses from immobilization, affinity, and liquid
chromatography, to other uses such as bioceramics and even catalysis.2,3,4,5 Other uses, chemical
properties, and the physical nature of CPG will be discussed in this chapter.
1.1.1Background
Controlled pore glass is a porous solid made from silicon dioxide. CPG has pores on its
outer shell that can range from 2-300 nm.5,6 These pores dramatically increase the surface area of
the glass beads allowing for more surface hydroxyl groups. The more surface hydroxyl groups on
the CPG, the more potential reaction sites the foundation possesses. The pore size typically used
2
Since the purpose is to create a sensor with a high number of terminal metal sites, using the CPG
with the smallest pore size maximizes the reactive potential of the foundation because a higher
surface area leads to a more reactive CPG foundation.
CPG has numerous advantages over other types of organic foundations. The solid glass
structure can withstand high pressures and collisions that could take place in a reaction vessel
during a synthesis. CPG is also hard to break down chemically; organic solvents, along with
concentrated acids and bases are used alongside CPG without altering its reactivity or destroying
its foundation.6 CPG also has varying pore size, particle size, and functional groups. CPG, with
its surface hydroxyl groups, activates via nucleophilic reactions making the modification of the
foundation a less arduous task.
1.1.2Pore and Particle Size
The synthesis of controlled pore glass allows the resulting beads to have similar pore sizes.
CPG is made from a borosilicate material which, when heated, expels borates uniformly, creating
small pore size distributions where most pores are within 10% of the mean pore diameter.6 Since
the reactivity of the foundation directly affects the surface modification to create the chemosensor,
it is necessary to know how many hydroxyl groups are on the surface and to use the maximum
amount of hydroxyl groups possible to make the best monolayer modification. According to
3
Table 1-1. Relationship of pore diameter on CPG to surface area6 Pore Diameter
(nm)
Internal Surface Area (m2/g)
7.5 340
17 150
24 110
35 75
50 50
70 36
100 25
140 18
200 13
300 9
As the pore diameter increases, the internal surface area decreases. This inverse proportionality
means that a smaller pore diameter increases the foundation’s reactivity. However, since the CPG
is only the foundation, and many more monolayers are added throughout the synthesis, the pore
size must not be too small or steric effects will start hindering the surface modification. In this
research a pore diameter of 50 nm is the best compromise, since dendrimer diameters range up to
4.5 nm in this work.7 Like pore size, particle size also varies with different kinds of CPG. Typical
meshes range from 74 µm to 200 µm.6 Larger CPG particles will have more surface area but will
also weigh drastically more than smaller CPG molecules. Therefore, smaller CPG particles will
have a higher surface area leading to more surface hydroxyl groups.
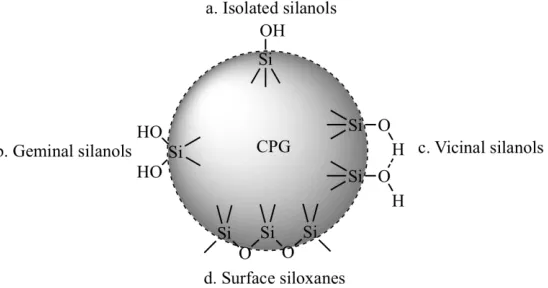
1.1.3Surface Chemistry
Knowledge of the surface chemistry of a CPG molecule is very important since it is the
foundation of the chemosensors created here. At temperatures between 25 and 190 °C there exist
four different types of silanol groups on the CPG surface: isolated silanols, geminal silanols,
4
Figure 1-1. Different types of CPG surface groups. Reproduced from Zhuravlev.8
Three of the four types of groups already have hydroxyl groups on the surface of the CPG beads.
The CPG surface must have these hydroxyl groups before subsequent syntheses take place.
Concentrated nitric acid washing removes any potential organic impurities on the CPG but also
provides protons in solution which transforms surface siloxanes into geminal silanols. This step
insures that the CPG is pure and has the most possible hydroxyl groups on the surface before the
first monolayer reaction.
1.2Dendrimers
The covalent monolayers applied to CPG are macromolecular polyamidoamine (PAMAM)
dendrimers and serve as the second monolayer, after the linker, on the ensemble. PAMAM
dendrimers are useful because of their highly ordered three-dimensional arrangement and their
functionality via terminal amine groups. This section introduces many properties of dendrimers
including their structure, shape, branching, surface area, and reactivity in order to help the reader
5
1.2.1Background
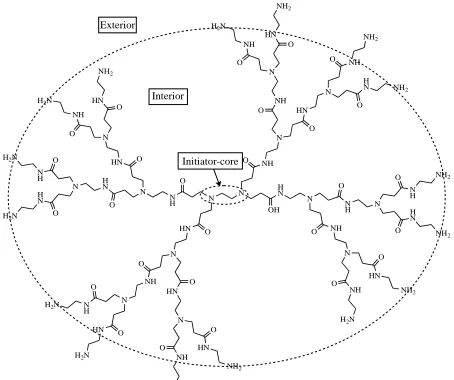
The earliest synthetic dendrimers were not created until the late 1970’s and were not
popularly used until after 1990.8,9 Dendrimers are composed of three regions depicted below in
Figure 1-2.
Figure 1-2. Picture of a generation 2.0 PAMAM dendrimer and its regions.
At the center of a dendrimer lies an initiator-core. Most PAMAM cores are n-alkyl diamines that
terminate in primary amines. PAMAM dendrimer growth is achieved by the repeating of two
alternating reactions. The first reaction is a Michael addition of the amino-terminated initiator
core onto methyl acrylate, which results in an outer layer that is ester terminated. The second
reaction is a coupling with ethylenediamine to generate the new amino-terminated surface, which
results in a generation 0 dendrimer.10 Each time this pair of reactions takes place, a new
“generation” forms. PAMAM dendrimers are classified by their generation number and typically
are abbreviated as “Gx”, where X refers to the generation number. A G1 dendrimer is created from
a G0 dendrimer by performing a Michael addition and then an ethylenediamine coupling.
Half-N N NH N O NH N O NH H2N
O HN NH2 O HN N O NH NH2 O O H N NH2
HN N O HN N O HN NH2 O NH H2N
O NH N
O
HN H2N
O O N H H2N
H N
N
OH NH
O O NH N N H NH2 O H N NH2 O N HN NH2 O O NH H2N
N H N O H N O O HN N H N H2N O
N H H2N O
N NH H2N
6
generation dendrimers are created by terminating a Gx dendrimer with a Michael addition, which
yields a Gx.5 dendrimer. The second region of a dendrimer is its interior. The interior consists of
all the atoms outside of the initiator core as the dendrimer increases in generation. The interior
contains all the symmetric branches of the dendrimer structure that stem from the initiator core.
The final region in a dendrimer is the exterior. The exterior is where the terminal functional groups
lie and where further reactions take place. In PAMAM dendrimers, the exterior shell contains
primary amines. Dendrimers can be as small as the core plus one interior reaction, G0, and as big
as several generations. The company Dendritic Technologies® sells dendrimers as large as
generation 10.11
1.2.2PAMAM Dendrimers
The terminologies for utilizing the PAMAM dendrimers are the interior of the dendrimer,
which has tertiary amines as the branching unit for each generation, and the exterior, which
consists of terminal amines that serve as a future reaction site for nucleophilic substitution.
Starting at the initiator core, the only two possible reaction sites are at each terminal amine.
When a generation increases, two more terminal amines exist at the end of each side of the newly
formed generation zero PAMAM dendrimer. These amines then act as the only place for new
reaction substitutions. This is the case for the synthesis of dendrimers as small as the initiator
7
8
Since the only place for the dendrimer to increase in size is the same on both ends of the
molecule, the resulting product has a uniform and symmetric structure. PAMAM dendrimers
also have a high surface group functionality because of the terminal amines on the exterior. The
number of surface amines doubles as a generation increases because when a new generation is
added through substitution of terminal amines, two new terminal amines are produced at the new
exterior. PAMAM dendrimers are available in many sizes, as in Table 1-2 in the next section,
allowing the researcher a choice in the amount of reactivity and size of a dendrimer for a project.
In this project, reactivity through terminal amine density is the most important aspect of a
dendrimer. Dendrimers, with all their terminal amines, are polar molecules and when added to
CPG make the modified ensemble more reactive, allowing more surface modification later in the
synthesis than would be available to CPG alone. In other projects, researchers may use a
dendrimer for its shape and size, where terminal amine density is not as important.13
The dendrimers in this research are typically G3 and G4 and purchased from either Sigma
Aldrich or Dendritic Nanotechnologies Incorporated™. The dendrimers come as 10 to 20% by
weight in methanol. As a pure substance, the dendrimers are viscous oils and stick to the sides of
test tubes when the methanol is evaporates. The dendrimers are redissolved in DMSO, before
they are added into a reaction vessel.
1.2.2.1Initiator Cores, Branching Units, and Surface Groups of PAMAM Dendrimers
PAMAM dendrimers can have many different types of initiator cores. One can order cores
such as ethylenediamine, diaminobutane, diaminohexane, diaminododecane, and even cystamine
9
units and the number of terminal amines differ only by two no matter how large the generation as
shown in Table 1-2. One can calculate the number of surface groups on a dendrimer by the
equation 2(n+2), where n is the generation number. As generation increases, the number of surface
functional groups doubles compared to the previous generation’s amount of surface groups, giving
the exponential function.
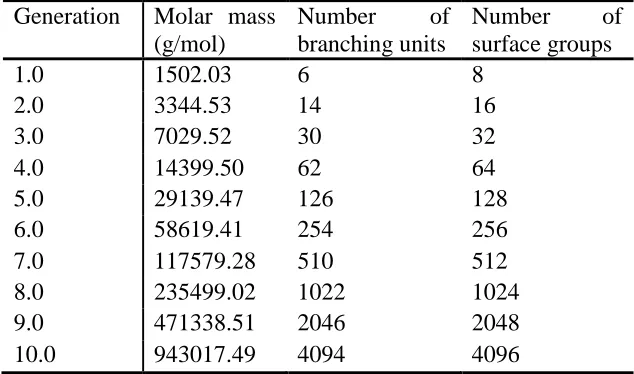
Table 1-2. The molar masses, number of branching units, and number of surface groups on ethylenediamine PAMAM dendrimers as a function of generation.15
Generation Molar mass (g/mol)
Number of branching units
Number of surface groups
1.0 1502.03 6 8
2.0 3344.53 14 16
3.0 7029.52 30 32
4.0 14399.50 62 64
5.0 29139.47 126 128
6.0 58619.41 254 256
7.0 117579.28 510 512
8.0 235499.02 1022 1024
9.0 471338.51 2046 2048
10.0 943017.49 4094 4096
1.2.2.2Dendrimer Size
Each time a dendrimer adds a generation, its molecular weight increases roughly by a factor
of two. The higher generation a dendrimers gets, the more primary amines are exposed on the
outer surface.16 These primary amines are what give dendrimers their reactivity and allow for their
customization in many fields of research. PAMAM dendrimer structures, from G3 and higher, are
more disk-like than their lower generation counterparts, which are more spherical.17
In this research, the generation 3 PAMAM dendrimer, along with some generation 4
10
increases because the synthesis of a higher dendrimer generation takes longer, and requires more
reagents and purification. Table 1.3 shows the prices of PAMAM dendrimers.
Table 1-3. Prices of PAMAM dendrimers with varying generation from Sigma Aldrich in 2014.14
Generation Mass (g) % Weight Price ($) Price ($) / g
3.0 5.00 20 272.50 272.50
4.0 2.50 10 220.00 880.00
4.0 10.0 10 667.00 667.00
5.0 5.00 5 237.00 948.00
6.0 5.00 5 383.00 1,532.00
7.0 2.50 5 593.00 4,744.00
1.2.3Dendrimer Macromolecular Reactions
The two main areas where macromolecular interactions take place on dendrimers are
through the primary amine groups and the interior tertiary amine groups. According to Maiti and
coworkers, almost all of the primary amines on dendrimers are protonated by pH 7.4 and the
majority of tertiary amines are protonated by pH 4 in aqueous solutions.16 Protonation of these
amines will give the nitrogen atoms positive formal charge and cause an electrostatic repulsion
against other positive atoms in the dendrimer structure. This effect can make a dendrimer increase
its size and radius. Maiti also discovered that this increase happens for larger generations such as
generation 4.0 through 8.0 but the lower generations are more rigid in structure.18
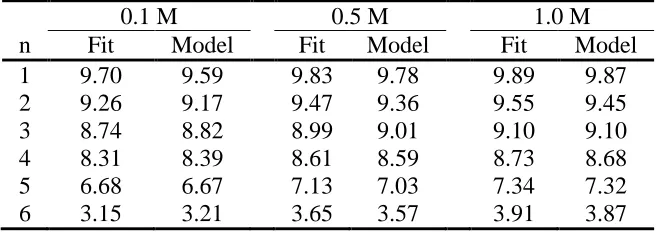
An article by Cakara aligns with Maiti’s conclusion and reports microstate pKa data for
the four primary amines and two tertiary amines of a G0 dendrimer (Figure 1-3) quantified by
11
Table 1-4. Comparison of macroscopic ionization constants pKn of the PAMAM dendrimer G0
from direct fit of the titration curves and calculated from the site binding model at different ionic strengths.19
n
0.1 M 0.5 M 1.0 M
Fit Model Fit Model Fit Model
1 9.70 9.59 9.83 9.78 9.89 9.87
2 9.26 9.17 9.47 9.36 9.55 9.45
3 8.74 8.82 8.99 9.01 9.10 9.10
4 8.31 8.39 8.61 8.59 8.73 8.68
5 6.68 6.67 7.13 7.03 7.34 7.32
6 3.15 3.21 3.65 3.57 3.91 3.87
Maiti and Cakara both suggest that in a solution above pH 7, all four terminal amines are
protonated whereas more acidic conditions are needed to protonate the tertiary amines. Cakara
also performed the same experiment on a G1 dendrimer with eight primary amines and six tertiary
amines. In that experiment, the eighth terminal amine had a pKa of 7.96, suggesting as dendrimer
generation increases, the terminal amines require less acidic conditions to be deprotonated.19 As
dendrimers increase in generation and have more terminal and tertiary amines, the pKa values
become harder to quantify. The pKa of an amine becomes even more important when talking about
nucleophilic substitution reactions of the dendrimer. If terminal amines are fully protonated then
there is no nucleophilic lone pair of electrons available to attack an electrophile and ensure the
reaction forms products. If a nucleophilic reaction cannot occur, dendrimer modification cannot
occur and chemical modifications would produce no meaningful results. Therefore, running a
nucleophilic reaction at a higher pH will render primary amines more nucleophilic thus creating a
12
1.3Indicator Displacement Assay (IDA)
Indicator displacement assays originated with Inoue and are widely popularized by the
Anslyn group.20 One type of IDA is a chemical test where an unsaturated metal complex
chemically coordinates or binds an indicator which is displaced by a substrate into an indicator
solution and the absorbance difference used to calculate a concentration. There are two steps in
an indicator displacement assay; the first step is the addition of a dye molecule onto the molecular
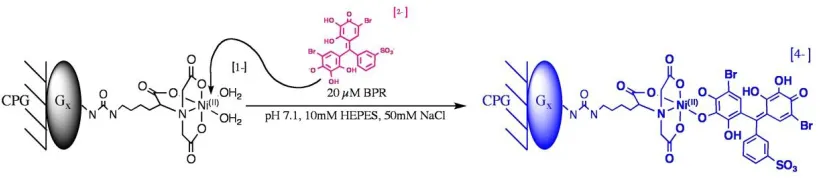
sensor via metal chelation as shown in Figure 1.4.
Figure 1.4. Picture of a CPG-Gx-NTA-Ni molecular sensing ensemble reacting with a
bromopropyl red dye molecule to create the dye-loaded ensemble.21
The second step in an indicator displacement assay is the addition of a substrate that competes
with the bound dye at the tethered metal ion site. If the substrate has better equilibrium binding
properties than the dye, or is in much higher concentration, it displaces the dye as in Figure 1.5.
13
From the change in solution absorbance, the amount of substrate bound to the sensor is quantified
assuming a 1:1 exchange.
1.4Research Goals
There are several goals to address as part of this research. The first is to create a working,
highly sensitive ensemble, with CPG as a foundation, to perform IDAs on bidentate substrates. To
have a highly sensitive ensemble, dendrimer functionality, ligand coupling, and metal loading must
all be high. This means using a high dendrimer generation, creating ensembles with a suitable
chelate, and loading high concentrations of a metal into the IDA site.
The second goal is to take a highly functional ensemble and ask what changes can be made
to further increase its sensitivity. For example, what is the effect of changing dendrimer sizes on
an ensemble? Also, which chelates, metals, and dyes will lead the most effective overall
chemosensor?
The third goal is to detect and quantify biologically important molecules that potentially
coordinate to the metal center via bidentate binding. There are many biological molecules worth
sensing, many more than were tested in this work. Detecting and quantifying biological molecules
14
1.5 References
1. Nguyen, B. T.; Anslyn, E. V., “Indicator displacement assays.” Coord. Chem. Rev. 2006, 250 (23‚24), 3118-3127.
2. Robinson, P. J., Dunnill, P., Lilly, M. D., “Porous Glass as a Solid Support for Immobilization or Affinity Chromatography of Enzymes.” BBA Enzymology1971, 242 (3), 659-661.
3. Miyake, K., “Determination of Partition Coefficients of Very Hydrophobic Compounds by High-Performance Liquid Chromatography on Glycerl-Coated Controlled-Pore Glass.” Journal of Chromatography A1982, 240 (1), 9-20.
4. Hench, L., “Bioceramics: From Concept to Clinic.” Journal of the American Ceramic Society2005, 74 (7), 1487-1510.
5. Kimtys, L., Aksnes, D., “Analysis of Pore Size Distribution by 2H NMR.” Analyst 2006, 132, 148-152.
6. Millipore controlled pore glass (CPG) Media inorganic support for liquid chromatography and related application, EMD Millipore Coporation.
7. Dendritech. June 12, 2014. www.dendritech.com
8. Egon Buhleier, Winfried Wehner, Fritz Vögtle (1978). ""Cascade"- and "Nonskid-Chain-like" Syntheses of Molecular Cavity Topologies.” Synthesis1978, 2, 155–158.
9. Hawker, C. J.; Fréchet, J. M. J. (1990). "Preparation of polymers with controlled molecular architecture. A new convergent approach to dendritic macromolecules.” J. Am. Chem. Soc.
112, 21, 7638.
10.Tomalia, Donald A.; Baker, H.; Dewald, J.; Hall, M.; Kallos, G.; Martin, S.; Roeck, J.; Ryder, J.; Smith, P., (1986). "Dendritic macromolecules: Synthesis of starburst
dendrimers". Macromolecules1986,19 (9): 2466–8 11.Millipore. June 12, 2014. www.millipore.com
12.Nicholson, J. W. (ED.) The Chemistry of Polymers; Royal Society of Chemistry: Cambridge, UK, 2006.
13.Esfand, R., Tomalia, D. A., “Poly(amidoamine) (PAMAM) Dendrimers: From Biomimicry to Drug Delivery and Biomedical Applications,” Drug Discovery Today, vol. 6, no. 8, pp. 427-436, 2001.
14.Sigma Aldrich. June 12, 2014. www.sigmaaldrich.com
15.Liu, S., Synthesis and study of various functional surfaces generated on PAMAM dendrimers immobilized controlled pore glass. M.S. Thesis, University of San Francisco, San Francisco, CA. 2013.
16.Maiti, P., Cagin, T., Lin, S.,and Goddard, W., “Effect of Solvent and pH on the Structure of PAMAM Dendrimers.” Macromolecules.2005,38, 979-991.
17.Pathak, S.; Singh, A. K.; McElhanon, J. R.; Dentinger, P. M., Dendrimer-Activated Surfaces for High Density and High Activity Protein Chip Applications. Langmuir 2004, 20 (15), 6075-6079.
18.Holister, P., Vas, C. R., Harper, T., "Dendrimers: Technology White Papers.” Cientifica.
15
19.Cakara, D., Kleimann, J., Borkovec, M., “Microscopic Protonation Equilibria of
Poly(amidoamine) Dendrimers from Macroscopic Titrations.” Macromolecules2003, 36, 4201-4207.
20.Anslyn, E. V. “Supramolecular Analytical Chemistry.” J. Org. Chem. 2007, 72(3), 687-699.
16
Chapter 2
Synthesis and Characterization of a Molecular Sensing Ensemble from a Controlled Pore Glass Foundation
2.1Introduction
Controlled Pore Glass (CPG) serves as the foundation for the molecular sensing ensemble
terminating in a chelated metal ion with exchangeable coordination sites. The CPG surface
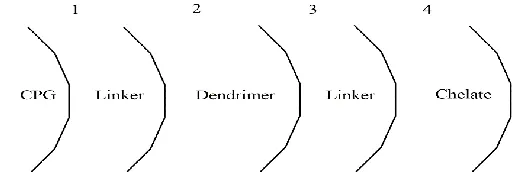
requires four monolayers to reach the desired metal site as in Figure 2-1.
Figure 2-1. The four monolayers on CPG needed before the desired metal site.
Either 1,1’carbonyldiimidazole (CDI) or 3-(triethoxysilyl)propylsuccinic anhydride
(TESPSA), is the first monolayer applied and is a bifunctional linker between the CPG and the
PAMAM dendrimer which is the second monolayer. The third monolayer is a CDI linkage
between the terminal amines of the dendrimer and the metal ion organic chelating ligand, which
is the fourth monolayer. Once the organic chelating ligand couples to the dendrimer, metal ions
bind via the chelate, which is the site for the IDA.
2.1.1CPG Acid Cleaning
Before activating the CPG, it must be cleaned and sanitized of any organic impurities by
17
impurities can alter the synthesis or prevent the maximum amount of hydroxyl groups from
reacting with the linker.
2.1.2CPG Activation
The CPG can be activated by one of two different molecules that perform the same
function. Both CDI and TESPSA serve as a linker between the surface hydroxyl groups on the
CPG surface and the amines branching from the dendrimer. These linkers will grant the two
nucleophilic entities, the surface hydroxyl groups of CPG and the surface amines of the dendrimer,
electrophilic regions that will serve as a tether to each other.
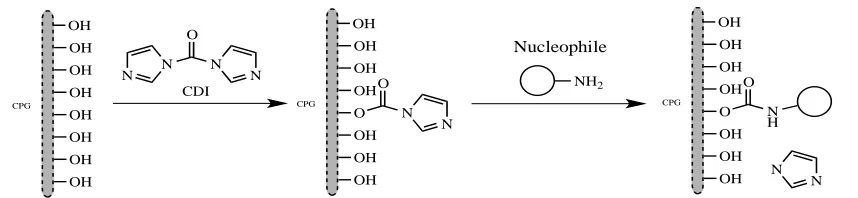
2.1.2.1CPG Activation via 1,1’-carbonyldiimidazole (CDI)
The activation of CPG via CDI follows the work of Pathak.1 CDI has a carbonyl site where
a nucleophile can attack and displace an imidazole group into solution. The first reaction of the
ensemble synthesis is the attack of a surface hydroxyl group of the CPG to the carbonyl carbon of
the CDI, displacing a single imidazole group. In the second reaction, an amine from the dendrimer
attacks the carbonyl and displaces the second imidazole group resulting in the CPG-CDI-Gx
component of the ensemble as shown in Figure 2-2.
Figure 2-2. Reproduced from Stollner and Scheller.2 Shows the binding of CDI to CPG and a terminal amine to CDI.
18
2.1.2.2CPG Activation via 3-(Triethoxysilyl)propylsuccinic anhydride
The second way to link the dendrimer to the CPG foundation is via TESPSA as first
published by Katzur who used TESPSA to connect dendrimers to silica wafers.3 The ethoxysilyl
portion of TESPSA is the first nucleophilic substitution region as it reacts with the hydroxyl group
from the CPG via displacement of an ethoxy group resulting in the first linkage as in Figure 2-3.
Figure 2-3. Nucleophilic substitution reaction between CPG and TESPSA
The second linkage from the dendrimer’s amine happens at the carbonyl group in the
succinic acid region. The amine attacks the carbonyl, which opens the succinic ring and results in
a CPG-dendrimer covalent linkage.
2.1.3PAMAM Dendrimer Coupling to Activated CPG
The terminal amines for PAMAM dendrimers of generation 3.0 and 4.0 are the
nucleophiles that attack the electrophilic CDI monolayer on the CPG. CPG has a reasonably high
number of hydroxyl groups at 4.6 ± 0.5 OH/nm2, which suggests high functionality.4 TESPSA
activation creates larger spacing from the surface than CDI that may reduce steric strain and
19
2.1.4Functional Group Density Assays
Since these monolayers are added to improve the overall functionality of CPG, it is
important to quantify all terminal reaction sites. The CDI assay quantifies imidazole groups after
step one via hydrolysis, which releases imidazole into solution.2 The free imidazole is compared
to a calibration curve of imidazole absorbance at 208 nm verses known concentrations.
Concentration quantification of any available terminal amine groups on the surface was
adapted from Moon.5 A sample reacts with 4-nitrobenzaldehyde (4NB) such that the terminal
amine attacks the carbonyl carbon of 4NB forming an imine as shown in Figure 2-4.5
Figure 2-4. Reproduced from Moon.5 Nucleophilic amine attack on an aldehyde to form an imine.
After washing, the imines are hydrolyzed back into the terminal amine CPG and free 4NB. An
external calibration curve of 4NB absorbance at 208 nm and the concentration of 4NB are used for
calculations. Since the relationship of 4NB to terminal amines is one to one, the concentration of
available terminal amines is equal to the concentration of 4NB with the assumption of completely
20
2.1.5PAMAM activation via CDI
After showing that PAMAM dendrimers anchor to the CPG surface, another CDI
monolayer is added before a ligand can be coupled to the dendrimer.
2.1.6Ligand Reactions to Immobilized PAMAM Dendrimers
Two chelating ligands are used for this research, which strongly chelate metal ions. The
first is Nα, Nα-bis(carboxymethyl)-L-lysine (Lysine-NTA), which is an analog of nitrilotriacetic
acid, and the second is aminofunctionalized terpyridine (A-terpy).
2.1.6.1Coupling of Nα, Nα-bis(carboxymethyl)-L-lysine
Lysine-NTA synthesis and dendrimer coupling was adapted from Cheng-Chi Chang.6 The
lysine-NTA molecule is similar to a nitrilotriacetic acid chelation while a reactive amine on the
other side serves as the nucleophilic site for CPG reactions shown in Figure 2-5.
Figure 2.5. Lysine NTA amine attacking the carbonyl carbon of the linker to couple the chelate to modified CPG.
Lysine NTA is useful because it has both the chelation properties necessary to bind a metal ion
and a nucleophilic site for coupling to the modified surface. Lysine NTA is also commercially
available from Sigma Aldrich for $193.50 / gram.8 Table 2.1 shows the binding constants for NTA
21
Table 2-1. Binding constants of various transition metals with NTA.9
Metal Ions
LogK/M-1
M2+ + NTA3- [M(NTA)]
-Mn(II) 7.44
Fe(II) 8.84
Co(II) 10.6
Ni(II) 11.26
Zn(II) 10.45
2.1.6.2Coupling of Amino-functionalized Terpyridine (A-terpy)
Like lysine-NTA, amino-functionalized terpyridine has one end for chelation via the three
pyridine nitrogens of the aromatic rings, but also has a nucleophilic tail terminating with an amine.
Figure 2.6 shows this ligand after coupling to the dendrimer on CPG.
Figure 2.6. Picture of a CPG-Gx.0-terpy molecule linked via CDI activation of CPG. Picture
drawn by Sandy Liu.7
This amino-functionalized terpyridine is not commercially available and the synthesis is adapted
from Schubert et al. and beginning with commercially available
4’-chloro-2,2’:6’,2’’-terpyridine.10 Binding constants for terpyridine with several metal ions are shown in Table 2.2.
CPG OH OH OH O OH OH OH O
CPG-Gx.0-terpy
O
N H
NH3
NH3
H3N
N H H3N
H3N NH3
NH3
Gx.0
H3N
N
N
N N
22
Table 2-2. Binding constants of various transition metals and terpyridine11
Metal Ions
LogK/M-1
M2+ terpy [M(terpy)]2+
Mn(II) 4.4
Fe(II) 7.1
Co(II) 8.4
Ni(II) 10.7
Zn(II) 6.0
2.1.7Metal Chelation to the Ligands Coupled to CPG-Gx
The modified CPG is transferred to a plastic Poly Prep® chromatography column (PPCC)
while a 5 ppm solution of a desired metal, usually Ni2+ or Cu2+, flows through the ensemble and
out the bottom of the column. The process is controlled by a pump and fraction collector. Early
in the flowing process, the solution passes through the modified CPG where the ligand starts to
chelate the metal in solution. Subsequently, the 5 ppm metal solution saturates the ensemble and
no longer loses any of its metal ions to chelation, therefore eluting a 5 ppm solution of metal ion.
Fractions collected produce a “breakthrough curve” of ppm vs. metal ion eluted volume of 5 ppm
solution passed. This curve is similar to a pH curve; initially the ppm of the eluent is small, but as
the chelating sites saturate there is a drastic increase in metal ion concentration, which levels out
23
Figure 2-7. Graph of two breakthrough curves of different generation dendrimers with terpy as the chelate.
At this time, the resulting ensemble is buffer washed to remove any soluble metal ions that are
flowing around the chemosensor. The result is that the chemosensor is loaded and ready for
indicator displacement assays.
2.1.8Indicator Displacement Assays on the CPG-Gx-NTA/Terpy-M2+ Ensemble
An indicator displacement assay (IDA) is an assay where a metal ion bound indicator is
exposed to a newly introduced substrate that competes for the open metal site via an exchange
mechanism. Initially, the chemosensor is placed into a screw-cap vial. An aliquot of dye solution,
typically pyrocatechol violet, is added to the vial containing the chemosensor. The chelation of
the dye to the metal ion is the first step of the IDA as in Figure 2-8. 0 1 2 3 4 5 6 59 .31 17 7.9 29 6.5 41 5.2 53 3.8 65 2.4 77 1.0 88 9.6 10 08 11 27 12 45 13 64 14 83 16 01 17 20 18 39 19 57 20 76 21 94 23 13 24 32 25 50 26 69 27 87 ppm mL/g CPGx-Terpy
24
Figure 2.8. A molecule of BPR chelating a nickel metal center of a modified CPG molecule.
The absorbance of the dye at 440 nm starts initially around 1.15. After 24 hours of
exposure to the chemosensor, the dye absorbance decreases because some of the dye has chelated
to the metal ion chemosensor decreasing the free dye concentration. An aliquot of a 100 mM
substrate solution is added to the reaction vial for 24 hours. Usually the final absorbance increases
because some substrate chelates to the metal site, kicking off the dye into solution, which is a
function of substrate concentration as in Figure 2.9.
Figure 2.9. Asubstrate chelating a nickel metal center and kicking off the dye molecule.
2.2Experimental Section
2.2.1Chemicals and Materials
All the chemicals used in this research were purchased and used as received. The glassware
25
metal ions. In this case, the glassware was soaked in a 1.0 M nitric acid bath for more than 24
hours and washed thoroughly with soap, followed by deionized water.
Chemicals: Nitric acid (68–70 % ACS reagent grade), acetic acid (glacial, ACS reagent
grade), and methanol were purchased from Pharmco-Aaper. Hydrochloric acid (36.5-38.0 %,
Baker analyzed ACS reagent), sodium phosphate dibasic anhydrous (USP/FCC, FW: 141.96), and
triethylamine (TEA, FW: 101.19) were purchased from J.T.Baker. Sodium hydroxide (50 % by
weight) was purchased from VWR. Nα, Nα-bis(carboxymethyl)-L-lysine hydrate (Lys-NTA, ≥
97.0 % (TLC), FW: 262.26), 1-1’-carbonyldiimidazole (CDI, reagent grade, FW 162.15), ethyl
acetate (ACS reagent), dichloromethane (99.6%, ACS spectrophotometric grade, FW 84.93),
N-hydroxysuccinimide (NHS, ≥ 98 % FW 115.09), imidazole (anhydrous Grade I, crystalline, FW:
68.08), dopamine hydrochloride (FW: 189.64), L-alanine (Sigma grade, FW: 89.1), L-histidine
(SigmaUltra, > 99 % (TLC) FW: 155.2), L-leucine (Sigma grade, FW:131.2), and pyrocatechol
violet (Indicator grade, FW: 386.38) were purchased from Sigma Aldrich. Starburst Dendrimer in
methanol generation 3 – diaminohexane core – amine surface (G5.0, DNT 115, 20 % w/w, FW:
6,909), Starburst Dendrimers in methanol generation 4 - diaminobutane core – amine surface (G4.0,
DNT 106 10% w/w, FW: 14,215), and Starburst Dendrimers in methanol generation 4 –
diaminobutane core – amine surface (G5.0, DNT 106, 10 % w/w, FW: 28,826) were purchaced
from Dendritic Nanotechnologies Incorporated. TESPSA was purchased from J&K Scientific
LTD. 4’-chloro2,2’:6’2’’-terpyridine (chloro-terpy, 98 %, FW: 267.72), 5-amino-1-pentanol
(amino-pentanol, 97 %, FW: 103.17), 4-nitrobenzaldehyde (4NB, 99 %, FW: 151.12), and
26
Drisolv® p-dioxane anhydrous (1,4-dioxane, FW: 88.11) and Drisolv® methylsulfoxide anhydrous
(DMSO, FW: 78.14) were purchased from EMD.
Materials: Controlled pore glass (CPG) CPG500B (CPG, mesh size 500 Å, pore size
74-125 µm, surface area 45.2 x 10¹⁸ nm2) was purchased from Millipore and Poly Prep®
chromatography columns (PPCC) were purchased from Biorad Laboratories.
2.2.2Instrumentation
The deionized water was purified by a SpectraPure® Reverse Osmosis & Deionization
System equipped with a SpectraPure® BA-ICE-S Electronic ICE Controller. Mass measurements
were conducted using a LabServe™ Sartorius R160P analytical balance. UV-Vis measurements
were performed on an Agilent 8453 UV-Visible Spectrophotometer equipped with an Agilent
89090 Peltier Temperature Controller. Spinning samples and solvent evaporations were made
possible by the use of a Buchi Rotovapor® R-114 and mixing was done on a New Brunswick
Scientific Reciprocal Water Bath Shaker model R76.
2.2.3Procedures
2.2.3.1Controlled Pore Glass (CPG) Cleaning
About 2.0 – 2.5 g of CPG beads were weighed into a round bottom flask with 50 mL of
concentrated nitric acid. The flask was attached to a rotary evaporator slowly spinning in the 70
°C water bath for 3 hours under nitrogen atmosphere. The CPG beads were then filtered using a
Kimax filter funnel and rinsed thoroughly with 3.0 L of deionized water. The pH of the washes
were monitored using pH paper until they were neutral. The beads were then dried in an oven at
27
and either stored in a PPCC inside a vacuum desiccator for future use, or reacted immediately with
a tether to start the ensemble synthesis.
2.2.3.2Activation of CPG
There were two ways to activate CPG. The first was established in the Margerum group
for linking two nucleophilic entities using 1,1’-carbonyldiimidazole. The second was one using a
newly utilized linker, 3-triethoxysilylpropylsuccinic anhydride.
2.2.3.2.1Activation with CDI
CDI was first dissolved in 50.0 mL of 1,4-dioxane, such that the resulting solution was 0.2
M, before it was added to a 100 mL round bottom flask with 2.0 – 2.5 g of clean and dry CPG
beads. The reaction spun slowly on a rotary evaporator at room temperature for 24 hours under a
constant flow of nitrogen gas. The CPG-CDI were filtered through a Kimax medium glass filter
funnel and rinsed with 100 mL of 1,4-dioxane for each gram of CPG reactant. The filtered product
was vacuum dried and stored in a PPCC in a vacuum desiccator.
2.2.3.2.2Activation with TESPSA
The procedure for reacting TESPSA with CPG was adopted from Katzur.3 A mixture of
1.6 mmol/L TESPSA and 4.8 mmol/L acetic anhydride in toluene was added to a round bottom
flask with 2.0 g CPG inside. The reaction was heated at 100 °C for 30 minutes in an oil bath and
then to 130 °C for an additional 10 minutes. The product was washed with toluene to remove
excess acetic anhydride and TESPSA, and then dried in a vacuum desiccator.
2.2.3.3PAMAM Dendrimer Immobilization on Activated CPG
The activated CPG-CDI and CPG-TESPSA were weighed into 20 mL disposable
28
received from Dendritic Nanotechnologies Inc., was put in a test tube and a stream of nitrogen gas
was used to evaporate the solvent. The resulting oil was dissolved in 20.0 mL of anhydrous DMSO
and added to the scintillation vial. The scintillation vial was then filled with nitrogen gas, capped,
sealed with electrical tape, and then spun on the rotary evaporator for 72 hours. This sample of
CPG-CDI/TESPSA-Gx was added to a PPCC and rinsed with 75.0 mL of anhydrous 1,4-dioxane.
The modified particles were vacuum dried and stored in a desiccator.
2.2.3.4Lysine NTA and A-terpy Couplings
Another monolayer of CDI was added to CPG-Linker-Gx before the ligand was coupled.
This allowed the two nucleophilic entities to couple to each other via the carbonyl.
CPG-Linker-Gx reaction with CDI: Enough CDI was dissolved in 20.0 mL of 1,4-dioxane in
order to form a 0.20 M CDI solution. This solution was poured into a 20 mL scintillation vial
along with 750 mg of CPG-Linker-Gx and the reaction rotated on a rotary evaporator for 24 hours
at room temperature. The beads were filtered through a PPCC, rinsed with 75.0 mL of anhydrous
1,4-dioxane, vacuum dried, and stored in a desiccator.
CPG-Linker-Gx reactions with lysine-NTA or A-terpy: Appropriate amounts of lysine-NTA
or A-terpy along with NHS and TEA were added to 20.0 mL of DMSO. The mixture was added
to a scintillation vial with the weighed ensemble. The reaction spun on the rotary vaporizer for 72
hours at room temperature. The sample was poured into a PPCC and rinsed with 100.0 mL of
29
2.2.4Characterizations
2.2.4.1Amine Density on CPG: 4NB Assay
The purpose of this assay was to calculate the available surface amine groups on a
dendrimer surface. There were three solutions made: 0.10 M 4NB solution dissolved in methanol,
0.2 % (v/v) acetic acid solution dissolved in deionized water, and a 1.00 mM 4NB solution
dissolved in the 0.2 % (v/v) acetic acid solution. A small sample of CPG-Linker-Gx was weighed
into a 20 mL scintillation vial (typically 10 mg) with 20 mL of 0.10 M 4NB solution in methanol.
This reaction was rotated for 24 hours at room temperature. The product was washed with
anhydrous methanol in a PPCC and vacuum dried in a desiccator. The dried and filtered product
was separated into three 20 mL scintillation vials and 15.00 mL of the 0.2 % (v:v) acetic acid
solution was pipetted into the vials and shaken for 4 hours at room temperature.
The 1.0 mM NB in 0.2 (v:v) acetic acid solution was used to make a calibration curve.
Volumes of 10 µL were digitally pipetted into a quartz cuvette already filled with 2.500 mL of
0.2% (v:v) acetic acid solution. The cuvette was shaken after each aliquot added to ensure the
solution matrix was homogeneous before taking the absorbance of the sample at 268 nm. A
calibration curve of absorbance vs. 4NB concentration was created and the total volume was
corrected to ensure the molarity was correct. Once the calibration curve was produced, the sample
solutions’ absorbance values were taken and their concentrations were calculated.
2.2.4.2CDI Density on CPG: Imidazole Assay
The CDI assay was used to quantify how many CDI molecules reacted with the CPG or
the dendrimer after a second CDI layer was added (CPG-CDI and CPG-CDI-Gx-CDI). A 5.0 mM
30
solution dissolved in 5.0 mM sodium phosphate dibasic solution. A sample of the imidazole
terminated CPG was weighed in a 20 mL scintillation vial and 15.00 mL of 5.0 mM sodium
phosphate dibasic solution was pipetted into the vial. The samples were shaken at 50 °C for 4
hours in a water bath. The samples were cooled to room temperature and their absorbance values
taken at 208 nm. About 10 µL per aliquot of the 10 mM imidazole solution was pipetted into
2.000 mL of 5.0 mM sodium phosphate dibasic solution. A calibration curve was plotted from
these data and used to calculate the concentration of the CPG modified samples.
2.2.5A-terpy Synthesis
Solid potassium hydroxide (KOH) was ground, using a mortar and pestle, and dried
overnight in an oven at 100 °C. Then, 0.60 g KOH powder and 0.200 g (1.94 mmol)
5-amino-1-pentanol were transferred to a 50 mL round bottom flask along with 25 mL DMSO. This solution
was mixed on a rotary evaporator for 30 minutes in an 80 °C water bath while the solution was
being purged by nitrogen gas. Then, 0.500 g (1.87 mmol) of 4’-chloro-2,2’:6’2’’-terpyridine
(chloro-terpy) was added to the round bottom flask. The reaction was spun on the rotary
evaporator for 4 hours, under nitrogen gas, in a water bath at 70 °C. The reaction solution was
quantitatively transferred to a separatory funnel using 200 mL of deionized water. Three volumes
of 20.0 mL of dichloromethane were added to separate the organic layer from the aqueous layer.
The organic layer was isolated and dried using sodium sulfate and gravity filtered into a
preweighed pear-shaped flask. The flask was connected to a rotary evaporator to remove the
solvent. The product’s color was a light orange-yellow solid. The product was recrystallized with
ethyl acetate and stored in the refrigerator. The crystals were collected by vacuum filtration on a
31
was 0.93315 g, a 74.7% yield based on the limiting reagent. NMR data of the results show two
aromatic regions from the starting material 4’-chloro-2,2’:6’2’’-terpyridine and the A-terpy
product. The chloroterpy aromatic protons were more deshielded due to the chlorine and ranged
from δ 8.5 to 9.0, whereas the A-terpy ranged from δ 7.5 to 8.2. A peak at δ 4.3 represented the
CH2 group bonded to the oxygen on 5-amino-pentanol portion of the A-terpy. The integration of
the δ 4.3 matched that of an aromatic hydrogen in a 1:1 ratio, which supported the idea that they
were connected on the same molecule A-terpy. However, the integration of the starting material
peak aromatic region was three times larger than the A-terpy aromatic region. Therefore, the final
A-terpy product was only about 30% pure.
2.3Results and Discussion
As the size or generation of dendrimer immobilized onto CPG increased, the functional
group assays showed increasing surface imidazole groups in the CDI assays and more primary
amines in the amine density assays. This result is strong evidence of successful dendrimer
immobilization and is not surprising since the terminal primary amines increases as the generation
of dendrimer increases.
2.3.1Surface Primary Amine Density Assay
After the dendrimers were added to the CPG foundation, the amount of terminal amines
were quantified using an amine density assay adapted from Moon et al.5 The method relies on the
reversible addition of 4NB to a sample of dendrimer coated CPG, which forms an imine between
the two entities. Once enough time passed for reaction with 4NB, the sample was washed and
reacted with 0.2 % (v:v) acetic acid solution to cleave the 4NB back into solution and absorbance
32
made about this assay. It was assumed that all the 4NB that reacted with the terminal amines were
also cleaved back into solution with the dilute acetic acid. It was also assumed that the 4NB and
a terminal amine reacted in a 1:1 ratio.
The amine densities are reported in units of µmol NH2/g CPG. The calculation for µmol
NH2/g is shown in Equation 2-1.
µmol NH2/g CPG =
[4NB]∗V∗106
g CPG Equation 2-1
V is volume of the sample and then multiplied by 106 is the change from moles to µmol. An
example spreadsheet calculation of the µmol NH2/g is shown in Table 2-3 below. For the new
TESPSA linker method, the main sample is split into three smaller samples labeled A, B, and C
respectively. The mass values vary but the deviation in µmol NH2/g CPG is small.
Table 2-3. Amine density assay results of a generation 3 dendrimer modified CPG beads linked with TESPSA and washed with HEPES buffer.
Sample Mass (g)
Volume
(mL) Abs.
4NB (moles)
NH2/g CPG
(µmol)
CPG-TESPSA-G3 A 0.02686 15.00 1.2430 1.628E-06 60.62
CPG-TESPSA-G3 B 0.01060 15.00 0.45047 6.116E-07 57.70
CPG-TESPSA-G3 C 0.01107 15.00 0.47743 6.455E-07 58.32
59 ± 2
Sandy Liu, along with other researchers before her, showed that amine density increases on CDI
activated CPG as the generation of dendrimer increases.7 This is consistent with the increasing
33
performed with dried and purified CPG-TESPSA-G3along with HEPES buffer washed
CPG-TESPSA-G3. Table 2-4 shows the results of an amine density assay with same three samples of
CPG-TESPSA-G3, but without buffer wash.
Table 2-4. Amine density assay of CPG-TESPSA-G3 without HEPES buffer washing
Sample Mass
(g)
Volume
(mL) Absorbance
4NB (moles)
NH2/g CPG
(µmol)
CPG-TESPSA-G3 A 0.00725 15.00 0.078105 1.831E-07 25.25
CPG-TESPSA-G3 B 0.00500 15.00 0.046771 1.400E-07 28.00
CPG-TESPSA-G3 C 0.00567 15.00 0.047055 1.404E-07 24.76
26 ± 2
These data imply that a HEPES buffer wash on dendrimer modified CPG increases the availability
of reactive dendrimer terminal amines on the CPG. For the imine formation to occur in the assay,
the lone pair on the amine must be available for nucleophilic attack. If the amine is protonated
and has a positive charge, the amine will not have a lone pair to perform the attack. The HEPES
buffer wash must change the surface charge of some of the terminal amines from positive to neutral
by pulling off an extra hydrogen from a positively charged terminal amine. This result needs to
be tested over a broader range of dendrimer generations and trials to confirm the results.
2.4Conclusion
The amine density assay is a good method to quantify surface amines on samples and thus
predict their future reactivity and surface charge. The deviations between trials are low meaning
the assay’s precision is high (± 2 µmol NH2 / g CPG). The assay gives quantitative information
about synthetic efficiency and gives insight on potential future reactivity of the ensemble. Low
34
performance because high amine density assays give higher metal loadings and larger
spectroscopic changes in IDAs. Also, the new result of washing the samples with HEPES buffer
further activates the terminal amines and increases sensitivity; however, this idea needs further
35
2.5 References
1. Pathak, S.; Singh, A. K.; McElhanon, J. R.; Dentinger, P. M., Dendrimer-Activated Surfaces for High Density and High Activity Protein Chip Applications. Langmuir 2004,20 (15), 6075-6079.
2. Stollner, D., Scheller, Frieder W., Warsinke, Axel, Activation of cellulose membranes with 1,1'-carbonyldiimidazole or 1-cyano-4-dimethylaminopyridinium tetrafluoroborate as a basis for the development of immunosensors. Anal. Biochem. 2002,304 (2), 157-165.
3. Katzur, V., Eichler, M., Deigele, E., et. all., Surface-immobilized PAMAM-dendrimers modified with cationic or anionic terminal functions: Physiochemical surface properties and conformational changes after application of liquid interface stress. J. Colloid Interface Sci.
2012, 366, 179-190.
4. Zhuravlev, L. T., The surface chemistry of amorphous silica. Zhuravlev model. Colloids and Surfaces A. 2000,173 (1‚ 3), 1-38.
5. Moon, J. H.; Kim, J. H.; Kim, K.-j.; Kang, T.-H.; Kim, B.; Kim, C.-H.; Hahn, J. H.; Park, J. W., Absolute Surface Density of the Amine Group of the Aminosilylated Thin Layers:‚ A Ultraviolet‚ àíVisible Spectroscopy, Second Harmonic Generation, and Synchrotron-Radiation Photoelectron Spectroscopy Study. Langmuir 1997,13 (16), 4305-4310.
6. Chang, C.-C., End-group Modifications to PAMAM Dendrimers Tethered on Glass Supports: Development of Indicator Displacement Assays (IDA) Based on Tethered Copper Chelates. M.S. Thesis, University of San Francisco, San Francisco, CA, 2009.
7. Liu, S., Synthesis and study of various functional surfaces generated on PAMAM dendrimers immobilized controlled pore glass. M.S. Thesis, University of San Francisco, San Francisco, CA. 2013.
8. Sigma Aldrich. August 18, 2014. www.sigmaaldrich.com
9. Furia, Thomas E. Crc Handbook of Food Additives. 2nd ed. Vol. 1. Boca Raton, Florida: CRC,
1975.
10.Schubert, U. S.; Eschbaumer, C.; Hien, O.; Andres, P. R., 4-Functionalized 2,2':6',2''-terpyridines as building blocks for supramolecular chemistry and nanoscience. Tetrahedron Lett. 2001,42 (28), 4705-4707.
36
Experimental: Synthesis, Methods, and Assays for Molecular Sensing Ensembles
3.1 Results and Discussion: Ensemble Characterization and IDAs
In this chapter, the quantifiable results using CPG-CDI-G3,4-terpy-Cu and
CPG-TESPSA-G3-NTA-Cu as sensors are discussed. CDI, shown Figure 2-2 in Chapter 2, was reacted with CPG
before a dendrimer coupled to the foundation. These dendrimers then coupled a ligand, which
chelated copper ions. Each synthetic step gave an intermediate product that was analyzed by a
CDI assay, amine assay, or breakthrough curve. CDI assays allowed the quantification of CDI
coupled to the CPG foundation and to the dendrimer whereas the amine assay allowed the
quantification of amine density once the dendrimer coupled to CPG. A breakthrough curve was
produced to measure copper ions.
The indicator displacement assay, described in Chapter 1, was the paramount assay for
these potential sensors. Since the maximum amount of dye displacement depends on the amount
of metal chelation, which depends on the ligand, dendrimer, linker, and foundation, the indicator
displacement assay shows how well the ensemble was synthesized as a complete entity.
3.2 CPG-CDI-G3,4-terpy-Cu
This synthesis used CDI as a bi-functional linker between the CPG and PAMAM
dendrimers of generations 3 and 4. The ligand, A-terpy, served as the chelate for copper ions,
which created an exchangeable binding site for the indicator displacement assays. Holyer et al.
observed the kinetic formation rate of Cu (II) bound to terpyridine to be 2 x 10⁷ mol-1s-1 for a mono
37
3.2.1 CDI Coupled to CPG
The CDI assay, described in Chapter 2, was performed to quantify CDI activation at the
CPG surface. The assay released imidazole and a calibration curve of Absorbance at 208 nm vs.
[Imidazole] (Figure 3-1), produced by adding a 0.1 M imidazole solution into a 2.0 mL solution
of pH 7.0 HEPES buffer, allowed the quantification of CDI.
Figure 3-1. Typical calibration curve of Absorbance at 208 nm vs. free [Imidazole] in 5mM sodium phosphate dibasic buffer at pH 10.0 for imidazole release assay on the CPG surface.
Table 3-1 summarizes the results of four trials of the imidazole release assay showing the mass,
absorbance at 208 nm, and conversion of released [imidazole]. y = 4.7196x - 0.0043
R² = 0.998
0 0.2 0.4 0.6 0.8 1 1.2 1.4 1.6
0.000 0.050 0.100 0.150 0.200 0.250 0.300 0.350
Ab
so
rb
an
ce
@ 208
n
m
38
Table 3-1. CPG-CDI assay results for the CPG-CDI-G3,4-terpy-Cu ensembles
Sample Mass
(g) Absorbance
Mol Imidazole / g
CPG
µmol Imidazole / g
CPG
CPG-CDI A 0.03321 0.626410 6.036E-05 60.36
CPG-CDI B 0.03209 0.574065 5.728E-05 57.29
CPG-CDI C 0.03139 0.557965 5.693E-05 56.93
CPG-CDI D 0.03090 0.555700 5.760E-05 57.60
58 ± 2
Assuming a complete reaction, an average of 58 ± 2 µmol of imidazole per gram CPG means that
there is good precision among the four trails (3.4 % RSD), where 58 µmol imidazole/g CPG is
enough CDI to perform dendrimer reactions. Sandy Liu reported a comparable result during a
CDI assay where she obtained a value of 60 µmol / g CPG.2
3.2.2 PAMAM Dendrimer Reactions to CPG-CDI
The CPG-CDI samples reacted with dendrimers of generation 3 and 4 to yield the
dendrimer coated precursors CPG-G3 and CPG-G4. The dendrimers were redissolved into DMSO
and all the reagents were mixed in a vial with N2. Once the reaction completed, the products were
washed, dried, and stored in a desiccator. A calibration curve of Absorbance at 268 nm vs. 4-NB
Concentration (Figure 3-2), produced from the data obtained from adding a 0.1 mM 4-NB solution
39
Figure 3-2. Typical calibration curve of Absorbance at 268 nm vs. 4-NB Concentration in a 0.2% acetic acid solution for amine density assay on the CPG-G3,4 precursors.
The amine assay, described in Chapter 2, leads to the results below in Table 3-2.
Table 3-2. Amine assay results for the CPG-CDI-G3,4 precursors
Sample Mass
(g) Absorbance
Mol NH2/g
CPG
µMol NH2/g
CPG
CPG-G3 A 0.01047 0.028015 6.803E-07 0.6803
CPG-G3 B 0.01052 0.035498 1.091E-06 1.091
0.9 ± 0.3
CPG-G4 A 0.01090 0.10304 4.667E-06 4.667
CPG-G4 B 0.01028 0.10716 5.182E-06 5.182
CPG-G4 C 0.01051 0.097161 4.514E-06 4.514
4.8 ± 0.4
The prediction of a doubling of amines going from G3 to G4 (which also doubles the terminal
amines) is not confirmed by the obtained data. The CPG-G3 samples give 0.9 ± 0.3 µmol NH2 per
gram of CPG, whereas the higher generation CPG-G4 samples give 4.8 ± 0.4 µmol NH2 per gram
of CPG. This ratio is about 5:1, not 2:1 as predicted. Although the amine density assay shows an
increasing amount of amine groups as dendrimer generation increases, the absorbances for 10 mg
samples are relatively low. Typical amine density assays, in past experiments in this research 0.0 0.1 0.2 0.3 0.4 0.5 0.6 0.7 0.8 0.9 1.0
0.0000 0.0100 0.0200 0.0300 0.0400 0.0500 0.0600
Ab so rb an ce @ 268 n m
40
group, give absorbance values in a range from 0.5 to 1.0.2 Three possible conclusions can be
drawn about this amine assay. First, there is a possibility that very few dendrimers reacted at the
CPG-CDI surface, perhaps due to steric crowding, causing the low amine density assay results.
The second possibility is a mistake in the assay that would result in low amine density. The third
possibility is that the reactants could have degraded. Since the synthesis of each ensemble builds
upon the previous steps, it will become clear if a mistake in the assay is the cause.
3.2.3 CDI Activation of CPG-G3,4
Another CDI activation step added an electrophilic carbon monolayer to the dendrimer,
which allowed for ligand reaction. Like the first CDI addition, a 20-fold excess of CDI added to
each vial ensures maximum reaction to the dendrimer monolayer. Since many terminal amines
coupled to the CPG-CDI particles during the dendrimer reactions, the dendritic primary amines
were available for reaction with CDI. Therefore, the CDI assay on dendrimer modified CPG-CDI
particles should give a higher number of CDI / g CPG than CPG-CDI particles. The CDI assay
after dendrimer addition lead to the results in Table 3-3.
Table 3-3. CDI assay results for the activation of CPG-CDI-G3,4 precursors
Sample Mass
(g) Absorbance
Mol CDI/g CPG
µMol CDI/g CPG
CPG-G3-CDI A 0.01389 0.50140 1.175E-04 117.5
CPG-G3-CDI B 0.01255 0.45432 1.180E-04 118.0
CPG-G3-CDI C 0.01155 0.39069 1.104E-04 110.4
CPG-G3-CDI D 0.01098 0.37833 1.125E-04 112.5
115 ± 4
CPG-G4-CDI A 0.01400 0.80697 1.871E-04 187.1
CPG-G4-CDI B 0.01292 0.74418 1.870E-04 187.0
CPG-G4-CDI C 0.01163 0.66657 1.862E-04 186.2
CPG-G4-CDI D 0.01073 0.57490 1.743E-04 174.3
41
Compared to the CPG-CDI particle data in Table 3-1, the CPG-G3,4-CDI particles (Table
3-3) have more bound CDI than the CDI saturated CPG. The ratio of the average values of CDI /
g CPG between the G4 and G3 precursors is about 1.6 whereas the ratio of primary amines between
G4 and G3 dendrimers is 2.0. The reason the average CDI / g values are lower than the maximum
potential addition is because, upon binding, the dendrimers flatten which leave some of the primary
amines inaccessible to the assay.3 Because of the higher CDI numbers and the G4/ G3 ratios for
the second CDI assay, it is most likely that the amine assay was executed incorrectly, causing low
absorbances. It was concluded that the dendrimer reaction did not fail, so the CPG-Gx-CDI
activated precursors was reacted with the ligand, A-terpy.
3.2.4 A-terpyridine Activation of CPG-G3,4
A-terpy was synthesized as described in Chapter 2 and is drawn in Figure 3-3.
Figure 3-3. Aminofunctionalized-terpyridine ligand
To couple A-terpy to the surface, a large excess was added to the CPG-G3,4-CDI precursors with
42
while NHS forms an intermediate that replaces the carboxylic acid (Figure 3-4) before the A-terpy
couples to the precursor.
Figure 3-4. A carboxylic acid reacting with NHS to form an intermediate capable of nucleophilic substitution.
The reaction with A-terpy proceeded for 72 hours in an inert atmosphere before it was washed
with dry methanol and filtered. Figure 3-5 shows a generic picture of this product.
Figure 3-5. CPG-Gx.0-terpy linked via CDI activation of CPG.2 The unreacted amines are in the
acidic NH3+ form.
The resulting CPG-G3-4-terpy molecules were stored in a desiccator before the copper ions were