R E S E A R C H
Open Access
Can diffusion tensor imaging lesion
patterns predict the outcome of ischemic
stroke?
Mervat Mostafa
1, Maged Abdel Naseer
1, Ramy Edward
2, Mohammad Edrees
1and Dalia M. Labib
1*Abstract
Background:Stroke can affect any portion of the central nervous system leading to a wide variety of symptoms depending on the part that is involved. Diffusion tensor imaging (DTI) is an emerging neuroimaging technique that allows measuring the integrity of white matter tracts.
Objectives:The objective of this study is to find out if the diffusion tensor tractography technique can provide prognostic information regarding clinical outcome following ischemic stroke.
Subjects and methods:Forty patients with acute ischemic stroke were studied with DTI. Size of infraction, degree of reduction of fractional anisotropy (FA), and pattern of corticospinal tract (CST) affection were identified. We assessed our patients according to the National Institute of Health Stroke Scale (NIHSS) and Medical Research Council (MRC) scale at onset of stroke and 3 months later.
Results:FA reduction was correlated with MRC and NIHSS on admission (P< 0.001, 0.004 respectively) and after 3 months (P< 0.001, 0.013 respectively). The pattern of CST affection was associated with NIHSS and MRC after 3 months (P= 0.035, 0.001 respectively).
Conclusion:DTI may be an indirect indicator of the ischemic stroke outcome.
Keywords:Diffusion tensor imaging, Tractography, Stroke, Prognosis, MRC, NIHSS
Introduction
Stroke is the third common cause of disability and one of the leading causes of death worldwide. It can be further divided into ischemic or hemorrhagic [1]. The dysfunction can be physically, mentally, emotionally, and/or a combin-ation of the three and it depends on the involved parts of the central nervous system (CNS) [2,3].
A wide variety of factors can play a major role in the outcome of ischemic stroke including age, stroke severity, stroke mechanism, infarct location, comorbid conditions, interventions such as thrombolysis, stroke unit care, and rehabilitation [4–6]. Many authors were relying on the
size of the infarction on magnetic resonance imaging (MRI) but with the emergence of MRI tractography, many authors suggested the location of infarction rather than its size to predict the prognosis following stroke [7]. Combin-ing clinical scores with imagCombin-ing the corticospinal tract (CST) integrity can improve predictions about the prog-nosis of motor outcome [8].
Diffusion tensor imaging (DTI) is an MRI technique for evaluating brain structure by measuring tissue water diffu-sion in 3-dimendiffu-sional (3-D) space. Diffudiffu-sion tensor tracto-graphy (DTT) visualizes the course of major white matter tracts which normally shows anisotropic diffusion in con-trast to the grey matter thus DTI technique can be used to detect long patterns of orientation as well as the integ-rity of white matter tracts [9]. Also, it provides informa-tion about the course, the compression, displacement, or
© The Author(s). 2020Open AccessThis article is licensed under a Creative Commons Attribution 4.0 International License, which permits use, sharing, adaptation, distribution and reproduction in any medium or format, as long as you give appropriate credit to the original author(s) and the source, provide a link to the Creative Commons licence, and indicate if changes were made. The images or other third party material in this article are included in the article's Creative Commons licence, unless indicated otherwise in a credit line to the material. If material is not included in the article's Creative Commons licence and your intended use is not permitted by statutory regulation or exceeds the permitted use, you will need to obtain permission directly from the copyright holder. To view a copy of this licence, visithttp://creativecommons.org/licenses/by/4.0/. * Correspondence:[email protected]
interruption of white matter tracts in three dimensions thus it can be used to detect the prognosis following a stroke [10].
This work aimed to find out if brain imaging using dif-fusion tensor tractography technique can provide prog-nostic information regarding clinical outcome following ischemic stroke.
Patients and methods
Forty patients with first-ever acute or subacute ischemic stroke confirmed by conventional MRI and diffusion-weighted imaging (DWI) were recruited and selected consecutively from the Neurology Department in Kasr Al-Ainy Hospital, Cairo University from May 2015 to November 2016. Patients were excluded if they had re-current stroke, intracerebral hemorrhage, and contra-indication to MRI assessment such as claustrophobia and/or cardiac pacemakers. All patients were treated with conservative medical therapies (no one received intravenous recombinant tissue plasminogen activator) and had started physiotherapy within 2 weeks after the stroke. Signed informed consent documents were pro-vided by all patients or appropriate family members.
The patients were assessed twice (on admission and after 3 months) for stroke severity using the National In-stitutes of Health Stroke Scale (NIHSS) [11] and for motor performances of the upper and lower extremities using Medical Research Council (MRC) scale [12,13]. Stroke se-verity was categorized as mild (NIHSS score 1–4), moder-ate (NIHSS score 5–10), and severe stroke (NIHSS score
≥10). MRC scale of the hemiparetic side was categorized as mild (4), moderate (2–3), and severe (0–1). The clinical recovery was defined as a decrease of points in the NIHSS score and increase points of the MRC scale. The patients were considered improved if the scores of the both scales had been better categorized.
Radiological examinations were conducted using a standard 1.5 Tesla whole-body MR system (Gyroscan Intera T15, Philips Medical Systems, Best, Netherlands). All patients were submitted to the MR imaging without prior preparation or anesthesia. The technique was per-formed using a birdcage head coil suited for MRI. The se-quences obtained were axial T1W, T2W, FLAIR, DW, and diffusion tensor. T1WI: TR 450 ms, TE 15 ms, flip 69°, matrix 180 × 169, FOV 210 × 236, number of excita-tion: 2, slice thickness: 6.0/1.5. T2WI: TR 3619 ms, TE 100 ms, flip 90°, matrix 192 × 165, FOV 210 × 236, num-ber of excitation: 2, slice thickness: 6.0/1.5. FLAIR: TR/TI 6000/2000 ms, TE 120 ms, matrix 208 × 192, FOV 210 × 236, number of excitation: 2, slice thickness: 6.0/1.5 diffusion-weighted imaging (DWI): a diffusion weighting factor of zero and 1000 s/mm2, TR 4100 ms, TE 115 ms, flip 90°, matrix 132 × 105, FOV 210 × 236, number of ex-citation: 1, slice thickness: 6.0/1.5 diffusion tensor: a single
shot, a spin-echo planar sequence in 12 encoding direc-tions. A diffusion weighting factor of 800 s/mm2, TR 8000 ms, TE 67 ms, flip 90°, matrix 112 × 110, FOV 210 × 236 mm, number of excitations: 2, slice thickness: 2.0/00. The images were transferred to the Philips extended MR work-station for postprocessing and the maps obtained were Greyscale FA maps, directionally encoded color FA maps, and 3D fiber tractography: were performed using multi-ROI technique based on known anatomy. Regions of interest (ROIs) were drawn in the unaffected portion of the white matter tracts, and the software detects the white matter tracts that passed through the ROIs. Measure-ments were performed at the site of infarction and the corresponding area at the contralateral hemisphere. A specific color was assigned to tracts running in the three orthogonal planes: red was for the right to left tracts, green for the anteroposterior tracts, and blue for cranio-caudal tracts. We categorized the patients according to the size of infarction: small or lacunar (< 3 cm), medium-sized (3–8 cm), and large (> 8 cm). The FA reduction value: mild (0.4), moderate (0.2–0.3), and severe (0.1). The CSTs [14]: disrupted tract (if it showed a marked reduc-tion of the anisotropy so that it could not be identified on the FA maps and could not be traced by fiber tracking al-gorithm), displaced tract (if it showed abnormal location or abnormal orientation, but it maintains its normal an-isotropy when compared to the corresponding contralat-eral tract), and preserved tract (if it maintains its normal location, orientation, and anisotropy compared to the cor-responding contralateral normal tract). The CSTs were considered disrupted if at least one tract was disrupted.
Statistical analysis
Data were coded and entered using the statistical pack-age SPSS (Statistical Packpack-age for the Social Science; SPSS Inc., Chicago, IL, USA) version 21. Data were summa-rized using mean, standard deviation, median minimum, and maximum in quantitative data and using frequency (count) and relative frequency (percentage) for categor-ical data. Comparisons between quantitative variables were done using the non-parametric Mann-Whitney test. Comparisons between values measured at admis-sion and values measured after 3 months were done using the non-parametric Wilcoxon signed-rank test. For comparing categorical data, chi-square (χ2
Results
This study included 27 males (57.5%) and 13 females (42.5%) with a mean age (± SD) of 62.75 years (±8.33).
As regards the risk factors, hypertension was more com-mon in patients (95%) followed by diabetes mellitus (DM) (70%), hyperuricemia (55%), dyslipidemia (52.5%), smoking (52.5%), ischemic heart disease (30%), and atrial fibrillation (AF) (15%).
The patients underwent MRI within the first 7 days of the stroke onset and we found that 22 (55%) of our pa-tients had small-sized infarction, 37.5% had medium-sized infarction, whereas only 7.5% presented with large infarction. Thirty-three patients (82.5%) had infarcts in the distribution of anterior circulation while 7 patients (17.5%) had infarcts in the distribution of posterior cir-culation. As regards the site of the lesion, 22 patients (55%) had right-sided lesion and 18 patients (45%) had left-sided lesions. Only 5 patients (12.5%) had cortical infactions while 35 patients had subcortical infarctions.
On admission, clinical assessment of the patients was done using NIHSS scoring. Three patients had mild NIHSS with preserved CSTs pattern on MRI tractography. Thirty-one patients had moderate NIHSS with 35.5% of them showed disrupted tractography, 19.3% showed displaced pattern, and 45.2% showed preserved pattern. The last 6 pa-tients were categorized as severe NIHSS with 66.7% of them showed disrupted form while the rest 33.3% showed preserved pattern. Some patients showed a decrease in the size of the CST, but it was intact throughout its extent. This was attributed to Wallerian degeneration.
The mean FA values inside the area of infarction (ROI) were statistically decreased (P˂0.001) in compari-son to the contralateral unaffected area as their mean value was 0.26 ± 0.12 while the contralateral unaffected area, mean value was 0.5 ± 0.08.
A statistically significant difference was detected be-tween the scores of NIHSS and MRC scale on admission and after 3 months. The patients gradually regressed with treatment and physiotherapy (Table1).
The degree of reduction of FA at ROI was strongly corre-lated with NIHSS scale on admission (r = −0.446, P = 0.004) and after 3 months (r=−0.391,P= 0.013) (Table2). The degree of reduction of FA at ROI was strongly corre-lated with MRC scale on admission (r= 0.629, P ˂0.001) and after 3 months(r= 0.754,P˂0.001) (Table3).
CST involvement was significantly correlated with the scores of the NIHSS after 3 months (P = 0.035). The NIHSS after 3 months of patients with preserved CST were lower than those with displaced CST, and those with displaced CST were significantly lower than those with disrupted CST. Therefore, the NIHSS scores of patients with disrupted CST after 3 months were significantly higher than patients with preserved and displaced CST (Table4).
Damage to the CST was significantly correlated with the degree of motor weakness measured by MRC on ad-mission and after 3 months (P 0.002, 0.001 respectively) (Table5).
There was a statistically significant association be-tween the pattern of CST tracts involvement and axonal damage expressed as decreased FA values (P ˂0.001) as patients with intact tract had normal FA values while those with interruption of the normal course of the tract showed variable degree of reduction of the FA values (Table6).
So, the greater the reduction of rFA values, the more affection of the motor tract, and on follow-up, those pa-tients showed less significant clinical improvement with treatment and physiotherapy.
ROC revealed that the rFA value of 0.3 can be used as a cutoff value to predict the prognosis of stroke patients. The sensitivity of this cutoff value was 64% with 73% specificity. The positive and negative predictive values were estimated to be 56.2% and 79.1% respectively. The AUC for the cutoff value was 0.774.
Table 1Comparison between scores of clinical scales on admission and 3 months after stroke onset
Clinical scales On admission After 3 months Pvalue NIHSS score Mean ± SD 8.2 ± 3.16 5.72 ± 2.94 < 0.001
Median(IQR) 8.5 5
Range 2–16 1-15
Mild Moderate Severe 3(7.5%) 31(77.5%) 6(15%) 14(35%) 23(57.5%) 3(7.5%)
MRC scale Mean ± SD 2 ± 1.4 3 ± 1.38 < 0.001
Median (IQR) 2 4
Mild Moderate Severe 5(12.5%) 20(50%) 15(37.5%) 22(55%) 11(27.5%) 7(17.5%)
IORinterquartile range,MRCMedical Research Council,NIHSSNational Institute of Health Stroke Scale
*SignificantPvalue
Table 2Correlation between the degree of FA reduction and NIHSS on admission and 3 months after ischemic stroke
FA reduction at ROI
NIHSS (on admission) NIHSS( after 3 months) Mild
(n= 3)
Moderate (n= 31)
Severe (n= 6)
Mild (n= 14)
Moderate (n= 23)
Severe (n= 3)
Mild (n= 11) 3 6 2 5 5 1
Moderate (n= 18)
0 17 1 8 10 0
Severe (n= 11)
0 8 3 1 8 2
Pvalue 0.004 0.013
FAfractional anisotropy,NIHSSNational Institute of Health Stroke Scale,ROI
There was no significant association between infarct size and the CST involvement (P = 0.105), NIHSS or MRC scales neither on admission (P = 0.717,P = 0.133 respectively) nor after 3 months (P= 0.244,P= 0.596 re-spectively) (Fig.1).
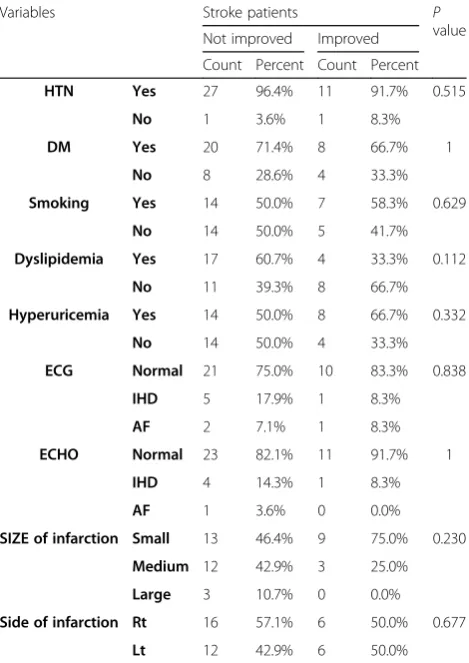
We used multivariate logistic regression to find the confounding factors affecting recovery. We found no in-dependent predictors affecting recovery as all variables were not significant (P˃0.05) (Table7).
Discussion
The early recovery from the stroke has been attributed to the resolution of tissue edema and mass effect associ-ated with infarction. While relative preservation of the integrity of the white matter tracts particularly, the CST plays an important role in long-term recovery and indi-cates a better clinical outcome [15,16].
In our study, we use both tools of the DTI which are the quantitative one represented by measuring the FA value in both the affected and unaffected sides of ische-mic stroke and the other qualitative one by evaluating the corticospinal tract involvement within the infarcts.
This study revealed a statistically significant reduction in the FA values on the affected sides compared with the contralateral sides with a significant correlation between the FA value and the motor outcome of the ischemic stroke patients. Our results were in agreement with other studies [17–20]; and this reduction in the FA value in the infarction area signifies the loss of cellular integ-rity with irreversible cellular injury [21].
As diffusion anisotropy mirrors the fiber integrity and the degree of the fiber organization in the white matter
tract [22], Pierpaoli and his colleagues [23] added that axonal loss, gliosis, and an accompanying increase in the extracellular matrix have been considered to be the de-terminants of the decrease in diffusion anisotropy in Wallerian degeneration [24]. So, FA is more sensitive to detect Wallerian degeneration than these conventional MR imaging parameters which requires at least 4–5 weeks after the stroke to detect it using T2-weighted im-ages or conventional MRI parameters.
These explanations could find an answer about why there was a strong significant association between the pattern of CST affection and the FA reduction value in-dicating that the more severe affection of CST, the lower the FA reduction value (P< 0.001).
In agreement with previous studies [20, 25–27], we found a strong correlation between the FA values as measured by DTI and the NIHSS on admission (P < 0.004) and after 3 months of admission (P < 0.013). Moreover, a significant association (P= 0.001) and cor-relation (P < 0.001) between the FA values and the de-gree of weakness as measured by MRC scale on admission. The previous findings indicate that the FA value is strongly linked to the clinical presentation of the stroke patients either in the acute stage or during their follow-up period.
Despite in this current study, there was no significant association between the pattern of CST involvement in DTI and the NIHSS on admission (P= 0.178), there was still an association between the pattern of CST and the NIHSS after 3 months (P = 0.035). In agreement with previous studies [28, 29], there was a strong association between the pattern of CST involvement and the degree Table 3Correlation between the degree of FA reduction at ROI and MRC on admission and 3 months after ischemic stroke
FA reduction at ROI
MRC (on admission) MRC (after 3 months)
Mild (n= 5) Moderate (n= 20) Severe (n= 15) Mild (n= 22) Moderate (n= 11) Severe (n= 7)
Mild (n= 11) 5 4 2 9 2 0
Moderate (n= 18) 0 13 5 13 4 1
Severe (n= 11) 0 3 8 0 5 6
Pvalue ˂0.001 ˂0.001
FAfractional anisotropy,MRCMedical Research Council,ROIregion of interest *SignificantPvalue
Table 4Correlation between CST involvement and NIHSS on admission and 3 months after ischemic stroke
NIHSS (on admission) NIHSS (after3 months)
Mild (n= 3) Moderate (n= 31) Severe (n= 6) Mild (n= 14) Moderate (n= 23) Severe (n= 3)
CST Disrupted 0 11 4 1 12 2
Displaced 0 6 0 2 4 0
Preserved 3 14 2 11 7 1
Pvalue 0.178 0.035
of weakness measured by MRC on admission and after 3 months (P= 0.002) (P= 0.001) respectively. This could be explained by the fact that CST is the main tract re-sponsible for voluntary motor power which is the main domain measured by MRC scale. In contrast, NIHSS which measures many other domains in addition to motor function as the level of consciousness, eye move-ment, gaze, sensation, ataxia, and dysarthria. So, we found that the pattern of CST involvement on admission can give us a good idea about the stroke prognosis after 3 months.
In our study, we found all the patients with disruption of corticospinal tracts had residual deficits on clinical follow-up, whereas the patients with displaced and pre-served tracts had a near-complete neurological recovery. Our findings are in agreement with the previously re-ported studies [25, 30]. This indicates that fiber tracto-graphy is well-correlated with the clinical outcome of the patients which means the patients with severe white matter (WM) affection will have an unfavorable clinical outcome.
Although it seems logical that larger lesions would correlate with greater deficits [31], the results in the current study join a longstanding debate regarding the relationship between infarct size and clinical outcome measures of stroke. In agreement with previous studies [4, 32,33], we found that the size of the lesion was not significantly associated with neither the pattern of CST involvement (P = 0.105), NIHSS on admission (P= 0.7), NIHSS after 3 months (P = 0.244), MRC on admission (P= 0.133) nor the MRC after 3 months (P= 0.596).
In agreement with the previous study of [34] where the size of the infarction is not stated, the main
influential factor of the clinical picture and infarction site and the degree of disruption of nerve fibers tracts may have roles. Whereas subcortical strokes are nor-mally smaller than cortical strokes, the patients with subcortical infarcts have worse motor outcomes than those with cortical strokes. These findings may be ex-plained by the extent of damage specifically within the CST which is a major determinant of motor deficit and not the size of the lesion.
Table 5Correlation between CST involvement and MRC on admission and 3 months after ischemic stroke
MRC (on admission) MRC (after 3 months)
Mild (n= 5) Moderate (n= 20) Severe (n= 3) Mild (n= 22) Moderate (n= 11) Severe (n= 7)
CST Disrupted 0 4 11 0 8 7
Displaced 0 5 1 5 1 0
Preserved 5 11 3 17 2 0
Pvalue 0.002 0.001
CSTcorticospinal tract,MRCMedical Research Council *SignificantPvalue
Table 6Association between the pattern of CST affection and the FA at ROI
CST Pvalue
Displaced Disrupted Preserved
FA (ROI) Mild 0 0 11 < 0.001
Moderate 6 4 8
Severe 0 11 0
CSTcorticospinal tract,FAfractional anisotropy,ROIregion of interest *SignificantPvalue
Table 7Multivariate linear regression model against clinical improvement
Variables Stroke patients P
value Not improved Improved
Count Percent Count Percent HTN Yes 27 96.4% 11 91.7% 0.515
No 1 3.6% 1 8.3%
DM Yes 20 71.4% 8 66.7% 1
No 8 28.6% 4 33.3%
Smoking Yes 14 50.0% 7 58.3% 0.629
No 14 50.0% 5 41.7%
Dyslipidemia Yes 17 60.7% 4 33.3% 0.112
No 11 39.3% 8 66.7%
Hyperuricemia Yes 14 50.0% 8 66.7% 0.332
No 14 50.0% 4 33.3%
ECG Normal 21 75.0% 10 83.3% 0.838
IHD 5 17.9% 1 8.3%
AF 2 7.1% 1 8.3%
ECHO Normal 23 82.1% 11 91.7% 1
IHD 4 14.3% 1 8.3%
AF 1 3.6% 0 0.0%
SIZE of infarction Small 13 46.4% 9 75.0% 0.230
Medium 12 42.9% 3 25.0%
Large 3 10.7% 0 0.0%
Side of infarction Rt 16 57.1% 6 50.0% 0.677
Lt 12 42.9% 6 50.0%
AFatrial fibrillation,DMdiabetes mellitus,ECGelectrocardiogram,ECHO
echocardiography,HTNhypertension,IHDischemic heart disease,Ltleft,
Fig. 1Shows a female patient 70 years old, diabetic and hypertensive presented with left hemiplegia:a. axial T2 WIs shows the cortical and
subcortical area of the high signal at the right frontoparietal region measuring about 13 × 4 cm in diameters.b. axial diffusion WIs (b1000) shows
restricted diffusion of the lesion.c. coronal FA color-coded map overlaid over the coronal FLAIR image with fiber tractography of the CSTs.d.
axial FA color-coded map overlaid over axial FLAIR image with 3D tractography of the CSTs showing disruption of the right CST (red) at the level
of the infarction with reduced caliber of the rest of the tract.e. axial FA color-coded map overlaid over axial FLAIR image with fiber tractography
The advantage of DTI lies in the fact that it gives dir-ect and superior visualization of the involved white mat-ter tracts in vivo, which is currently not possible by conventional imaging and DWI and it is technically feas-ible to incorporate such a DTI sequence into the routine imaging protocol for stroke patients.
Conclusion
As relative preservation of CST results in subsequent good clinical recovery, so we concluded that DTI can be used as an indirect indicator for the ischemic stroke outcome.
Abbreviations
AUC:Area under the curve; CNS: Central nervous system; ROC: Receiver
operating characteristic; CST: Corticospinal tract; DTI: Diffusion tensor imaging; DTT: Diffusion tensor tractography; DWI: Diffusion-weighted imaging; FA: Fractional anisotropy; IFOF: Inferior fronto-occipital fasciculus; MRC: Medical Research Council; MRI: Magnetic resonance imaging; NIHSS: National Institute of Health Stroke Scale; ROI: Regions of interest; SPSS: Statistical Package for the Social Science; WM: White matter
Acknowledgements
The authors acknowledge the subjects for their participation and cooperation in this study.
Informed consent
An informed written consent was taken from each patient involved in this study prior to the conduct of any study-related activities. All data obtained from every patient were confidential and were not used outside the study. The patients have the right to withdraw from the study at any time without giving any reason.
Authors’contributions
MM and MAN contributed to the research idea, data acquisition, data analysis, interpretation, and manuscript review. DML contributed to research idea, data acquisition, data analysis, interpretation, and manuscript writing and review. RE contributed to the interpretation of radiological data. ME contributed to data acquisition, data analysis, and interpretation. All authors read and approved the final manuscript.
Funding
This research received no specific grant from any funding agency in the public, commercial, or not-for-profit sectors.
Availability of data and materials
The datasets generated and/or analyzed during the current study are not publicly available due to the current Cairo University regulations and Egyptian legislation but are available from the corresponding author on reasonable request and after institutional approval.
Ethics approval and consent to participate
All procedures performed in the study were in accordance with the ethical standards of the institutional research committee and with the 1964 Helsinki declaration and its later amendments. Our study was approved by the ethical committee of the Department of Neurology, Faculty of Medicine, Cairo University, on the 4th of May 2015, but Cairo University does not provide approval reference number.
Consent for publication
Not applicable
Competing interests
None of the authors has any conflict of interest.
Author details
1Department of Neurology, Cairo University, Cairo, Egypt.2Department of Radio-diagnosis, Cairo University, Cairo, Egypt.
Received: 22 October 2019 Accepted: 15 April 2020
References
1. Sims NR, Muyderman H. Mitochondria, oxidative metabolism and cell death
in stroke. Biochim Biophys Acta. 2010;1802(1):80.
2. Howard VJ, McClure LA, Meschia JF, Pulley L, Orr SC, Friday GH. High prevalence of stroke symptoms among persons without a diagnosis of stroke or transient ischemic attack in a general population. : The reasons for geographic and racial differences in stroke (REGARDS) study. Arch Intern Med. 2006;166:1952.
3. Haacke C, Althaus A, Spottke A, Siebert U, Back T, Dodel R. Long-term outcome after stroke: evaluating health-related quality of life using utility measurements. Stroke. 2006;37:193.
4. Vogt G, Laage R, Shuaib A, Schneider A, VISTA Collaboration. Initial lesion volume is an independent predictor of clinical stroke outcome at day 90: An analysis of the virtual international stroke trials archive (VISTA) database. Stroke. 2012;43:1266.
5. Saver JL, Altman H. Relationship between neurologic deficit severity and final functional outcome shifts and strengthens during first hours after onset. Stroke. 2012;43:1537.
6. Coutts SB, Modi J, Patel SK, Aram H, Demchuk AM, Goyal M, et al. What causes disability after transient ischemic attack and minor stroke?: Results from the CT and MRI in the triage of TIA and minor cerebrovascular events to identify high risk patients (CATCH) Study. Stroke. 2012;43:3018. 7. Rossi ME, Jason E, Marchesotti S, Dastidar P, Ollikainen J, Soimakallio S.
Diffusion tensor imaging correlates with lesion volume in cerebral hemisphere infarctions. BMC Med Imaging. 2010;10:21.
8. Puig J, Blasco G, Schlaug G, Stinear CM, Daunis-I-Estadella P, Biarnes C, et al. Diffusion tensor imaging as a prognostic biomarker for motor recovery and rehabilitation after stroke. Neuroradiology. 2017;59(4):343.
9. Dellani PR, Glaser M, Wille PR, Vucurevic G, Stadie A, Bauermann T, et al. White matter fiber tracking computation based on diffusion tensor imaging for clinical applications. J Digit Imaging. 2007;20(1):88.
10. Zeng J, Zheng P, Xu J, Tong W, Guo Y, Yang W, et al. Prediction of motor function by diffusion tensor tractography in patients with basal ganglion haemorrhage. Arch Med Sci. 2011;7(2):310.
11. Brott T, Adams HP, Olnger CP, Marler JR, Barsan W, Biller J, et al.
Measurments of acute cerebral infarction:a clinical examination scale. Stroke. 1989;20:864.
12. Aids to the examination of the peripheral nervous system. London: Her Majesty's Stationery Office; 1976.
13. O’Brien M. Aids to the Examination of the Peripheral Nervous System. 5th ed. London: Saunders, Elsevier; 2010.
14. Witwer BP, Moftakhar R, Hasan KM, Deshmukh P, Haughton V, Field A, et al. Diffusion-tensor imaging of white matter tracts in patients with cerebral neoplasm. J Neurosurg. 2002;97(3):568.
15. Gillard JH, Papadakis NG, Martin K. MR diffusion tensor imaging of white matter tract disruption in stroke at 3 T. Br J Radiol. 2001;74:642. 16. Danielian LE, Iwata NK, Thomasson DM, Floeter MK. Reliability of fiber
tracking measurements in diffusion tensor imaging for longitudinal study. Neuroimage. 2010;49(2):1572.
17. Ali GG, Abd Elhameed AM. Prediction of motor outcome in ischemic stroke involving the pyramidal tract using diffusion tensor imaging. Egypt j radiol nucl med. 2012;43(1):25.
18. Maeda T, Ishizaki K, Yura S. Can diffusion tensor imaging predict the functional outcome of supra-tentorial stroke. No To Shinkei. 2005;57(1):27. 19. Chen Z, Ni P, Zhang J, Ye Y, Xiao H, Qian G, et al. Evaluating ischemic stroke
with diffusion tensor imaging. Neurol Res. 2008;30(7):720.
20. Lai C, Zhang Z, Liu HM, Zhou YB, Zhang YY, Zhang Q, et al. White matter tractography by diffusion tensor imaging plays an important role in prognosis estimation of acute lacunar infarctions. Br J Radiol. 2007;80:782. 21. Bhagat YA, Hussain MS, Stobbe RW, Butcher KS, Emery DJ, Shuaib A, et al. Elevations of diffusion anisotropy are associated with hyper-acute stroke: a serial imaging study. Magn Reson Imaging. 2008;26:683.
22. Thomalla G, Glauche V, Koch MA, Beaulieu C, Weiller C, Röther J. Diffusion tensor imaging detects early wallerian degeneration of the pyramidal tract after ischemic stroke. Neuroimage. 2004;22:1767.
24. Chen YJ, Nabavizadeh SA, Vossough A, Kumar S, Loevner LA, Mohan S. Wallerian degeneration beyond the corticospinal tracts: conventional and advanced MRI findings. J Neuroimaging. 2017;27:272.
25. Elkholy SF, Khalil ME, Elbasmi AAE, Mahmoud BEMH, Edrees M. Diffusion tensor magnetic resonance imaging in assessment of prognostic outcome of stroke patients. Egypt J Radiol Nucl Med. 2015;46(3):707.
26. Yamada K, Mori S, Nakamura H, Ito H, Kizu O, Shiga K, et al. Fiber-tracking method reveals sensorimotor pathway involvement in stroke patients. Stroke. 2003;34:e159.
27. Puig J, Pedraza S, Blasco G, Daunis-I-Estadella J, Prats A, Prados F, et al. Wallerian degeneration in the corticospinal tract evaluated by diffusion tensor imaging correlates with motor deficit 30 days after middle cerebral artery ischemic stroke. AJNR Am J Neuroradiol. 2010;31(7):1324. 28. Dawes H, Enzinger C, Johansen-Berg H, Bogdanovic M, Guy C, Collett J,
et al. Walking performance and its recovery in chronic stroke in relation to extent of lesion overlap with the descending motor tract. Exp Brain Res. 2008;186:325.
29. Newton JM, Ward NS, Parker GJ, Deichmann R, Alexander DC, Friston KJ, et al. Non-invasive mapping of corticofugal fibres from multiple motor areas—relevance to stroke recovery. Brain. 2006;129:1844.
30. Groisser BN, Copen WA, Singhal AB, Hirai KK, Schaechter JD. Corticospinal tract diffusion abnormalities early after stroke predict motor outcome. Neurorehabil Neural Repair .2014; 28:751.
31. Lövblad KO, Baird AE, Schlaug G, Benfield A, Siewert B, Voetsch B, et al. Ischemic lesion volumes in acute stroke by diffusion-weighted magnetic resonance imaging correlate with clinical outcome. Ann Neurol. 1997;42: 164.
32. Mark VW, Taub E, Perkins C, Gauthier L, Uswatte G. MRI infarction load and CI therapy outcomes for chronic post-stroke hemiparesis. Restor Neurol Neurosci. 2008;26(1):13.
33. Zhu LL, Lindenberg R, Alexander MP, Schlaug G. Lesion load of the corticospinal tract predicts motor impairment in chronic Stroke. Stroke. 2010;41(5):910.
34. Shelton FN, Reding MJ. Effect of lesion location on upper limb motor recovery after stroke. Stroke. 2001;32(1):107.
Publisher’s Note