Defect Detection in Alphonso using Statistical Method
and Principal Component Analysis: A Non-Destructive
Approach
Sandeep S. Musale, Pradeep M. Patil
Abstract – Natural image analysis uses textural property of
the surface. Texture is defined as a spatial arrangement of local intensity attributes that are correlated within areas of visual scene corresponding to surface regions. Texture exhibits some sort of periodicity of the basic pattern of Spongy Tissue in alphonso mango. This leads to use textural property to identify different patterns of Spongy Tissue in alphonso for detection of defects in alphonso mango. Visual assessment of texture made by human is time consuming and inspection made by human does not achieve a high degree of accuracy and preciseness. Automated visual inspection of the textural pattern improves the accuracy and preciseness during detection of defects in alphonso mango. To develop an optimized algorithm using a non contact mechanism which will detect the defective alphonso mangoes happen to be a challenging task. In this paper we have proposed use of subspace analysis technique for extraction of textural features that identifies Spongy Tissue in alphonso mango successfully. This paper presents a methodology that combines the principal component analysis (PCA) to locate the defect in alphonso mango effectively with moment of image segment as statistical feature and Fuzzy C-Means as a data clustering technique used for classification. The proposed algorithm performance is checked on the generated database [1] that is easily available for the researchers working on the said area. Experimental results computed using the proposed algorithm has been validated manually with the cut sections of the alphonso mangoes.
Keywords – Alphonso Mangoes, Digital X-Ray Imaging,
Non-Destructive Testing, Principal Component Analysis, Spongy Tissue, Textural Features.
I.
I
NTRODUCTIONHorticultural crops play an important role in the economy of the nation, as there are crops suitable for almost all the agro-climatic zones of the country. India has accelerated in total annual production of horticultural crops touching over 149 million tone during 1999-2000. Today, India has emerged as the second largest producer of the fruits (46 million tone) and vegetables (91 million tone), contributing nearly 10% and 14% respectively, of the world production. The horticulture crops cover about 8% of the total area contributing about 20% of the gross agricultural output in the country. India also enjoys the crown of being number one producer of mango and banana in the world. The overall productivity of the fruit and vegetable is 12 and 15.2 tones / hec, respectively. Though the country is the second largest producer of the fruits and vegetables in the world, per capita consumption of vegetables and fruits of our country for over one billion populations is very low. Fresh fruits and vegetables have the lion’s share of exports followed by processed one.
Thus, we have proposed to investigate the defects in the alphonso mangoes by using statistical method to locate the defect effectively along with the Principal Component Analysis [5, 6] to lower the computational complexity. Moment [7] of image segment is used as statistical feature and Fuzzy C-Means [8-10] is a data clustering technique used for classification. Fuzzy clustering is the partitioning of a collection of data into fuzzy subsets or clusters based on similarities between the data. The validity test of the developed algorithm has been performed manually with the cut sections of the alphonso mangoes available in the database [1].
II.
S
TATISTICALF
EATUREE
XTRACTION USINGM
OMENTSIn order to extract statistical features of the alphonso mango image, the X-ray image is initially divided into four equal parts for computing textural features based on proposed statistical method. Region moment representation interprets a normalized gray-level texture function as probability density function of a 2D variable. Properties of this random variable can be described using statistical characteristic moments [7]. Moments can be used for binary or gray-level region description. A moment of an order (𝑝 + 𝑞) is dependent on scaling, translation and rotation. Translational invariance can be achieved by using the central moments given by,
𝜇𝑝𝑞 = 𝜔𝑖=−𝜔 𝜔𝑗 =−𝜔 𝑖 − 𝑥𝑐 𝑝 𝑗 − 𝑦𝑐 𝑞 𝑓 𝑖, 𝑗 (1)
where,
𝑥𝑐, 𝑦𝑐 are the coordinates of region’s centre of gravity
(centroid), defined as, 𝑥𝑐= m10 m00 𝑦𝑐= m01 m00
Second order moments focus on the inertia matrix can be defined as,
𝐶 = 1
𝜇00 𝜇20 𝜇11
𝜇11
𝜇02 𝜇𝑝𝑞 (2)
Shape attributes like elongation (€) and compactness (𝑘) have been calculated for each region. Both attributes are translation, scaling and rotation invariant.
€=𝜆2
𝜆1 (3)
𝑘 = 𝜇00
4𝜋 𝜆1𝜆2 (4) where,
λ1 and λ2 are eigen values.
The image is divided till two shape attributes elongation and compactness is same, at least for 75% of the regions.
III.
P
RINCIPALC
OMPONENTA
NALYSISPrincipal Component Analysis is a way of identifying patterns in data, and it expresses the data to highlight their similarities and differences. PCA is a variable reduction procedure. In reality, the number of components extracted
in a principal component analysis is equal to the number of observed variables to be analyzed. In most analyses, however, only the first few components account for meaningful amounts of variance, so in subsequent analysis only these components are retained, interpreted, and used. In our work only first two components would account for a meaningful amount of variance. Therefore only first two components have been retained for interpretation.
IV.
F
EATUREE
XTRACTIONThe feature vectors computed for defect detection in alphonso mango are the features derived from the Eigen values of the covariance matrix of each region. The first component extracted in PCA accounts for a maximal amount of total variance in the observed variables. The second component accounts for a maximal amount of variance in the data set and it will be uncorrelated with the first component. In the proposed method 𝑃𝐶1 is first
principal component and 𝑃𝐶2 is the second principal
component. Finally to receive feature vector, similarity indexes 𝑠𝑥
𝑝
and 𝑠𝑦 𝑝
are calculated for each 𝑝th region of a textural pattern, which are defined as,
𝑆𝑝
𝑥 = 𝑗 =1𝐿 𝑊𝑖=1((𝑃𝐶1𝑝𝑖− 𝑃𝐶1𝑗𝑖)2+ (𝑃𝐶2𝑝𝑖− 𝑃𝐶1𝑗𝑖)2)1 2 (5) 𝑆𝑝
𝑦 = 𝐿𝑗 =1 𝐶𝑘=1 ((𝑃𝐶1𝑝𝑘− 𝑃𝐶1𝑗𝑘)2+ (𝑃𝐶2𝑝𝑘− 𝑃𝐶1𝑗𝑘)2)1 2 (6) where,
𝑝 = 1, … 𝐿, 𝑝 ≠ 𝑗,
𝑊 is the number of rows in the analyzed rectangular regions,
𝐿 is the number of regions of the X-ray image of alphonso mango,
𝑃𝐶𝑟 𝑗𝑖
is the 𝑟𝑡ℎ PC calculated for 𝑖𝑡ℎ row and 𝑗𝑡ℎ rectangular region,
𝐶 is the number of columns in the analyzed rectangular regions,
𝑃𝐶𝑟 𝑗𝑘
is the 𝑟𝑡ℎ PC calculated for 𝑘𝑡ℎ column and 𝑗𝑡ℎ
rectangular region. Similarity indexes 𝑠𝑥
𝑝
and 𝑠𝑦 𝑝
have been used as data for clustering process. 𝑠𝑥𝑝 and 𝑠𝑦 𝑝are smaller for similar
rectangular region and higher when difference between them is larger. The similarity factor is calculated by adding the similarity indexes 𝑠𝑥
𝑝
and 𝑠𝑦 𝑝
as, Similarity factor = 𝑠𝑥
𝑝
+𝑠𝑦 𝑝
(7) Intensity information of each region is extracted from
plotting histogram of each region. Histogram of region 1 and region 2 are shown in Figure 1. Histogram Comparison of each region is done by finding the difference of each histogram with all the regions as,
Difference histogram = ki=1Hi− Hj (8)
where,
𝑘 is number of regions,
(a) (b)
Fig.1 (a) Histogram of region 1 and (b) Histogram of region 2.
The sum of histogram differences for each region is calculated. The region having maximum histogram difference is considered as defective region.
V.
F
UZZYC-
MEANSC
LUSTERINGIn the proposed algorithm of defect detection in alphonso mangoes, fuzzy C-means data clustering technique has been used for classification. Fuzzy clustering is the partitioning of a collection of data into fuzzy subsets or clusters based on similarities between the data. Fuzzy C-means [8-10] is a data clustering technique wherein each data point belongs to a cluster to some degree which is specified by a membership grade. A method is provided here that shows how to group data points that populate some multidimensional space into a specific number of different clusters. The fuzzy C-means (FCM) algorithm is one of the most widely used methods in fuzzy clustering. The input data for the Fuzzy C-means clustering are Difference histogram and Similarity factor. The proposed algorithm of clustering for defect detection in alphonso mangoes comprises of the following steps:
Step 1:
Initialize the fuzzy partition matrix 𝑈 = [𝑢𝑖𝑗]matrix, 𝑈(0)
Step 2:
At 𝑘-step: calculate the centers vectors 𝐶(𝑘) = 𝑐𝑗 with 𝑈𝑘
Step 3:
𝐶𝑗 =𝑢 𝑖𝑗 𝑚. 𝑥𝑖 𝑁 𝑖=1
𝑢 𝑖𝑗 𝑚 𝑁 𝑖=1
Step 4:
Update 𝑈(𝑘), 𝑈(𝑘+1) using,𝑢𝑖𝑗 =
1
𝑥 𝑖−𝑐𝑗 𝑥 𝑖−𝑐𝑘
2 𝑚 −1 𝑐
𝑘=1
Step 5:
If 𝑈(𝑘+1− 𝑈(𝑘) < 𝜀 then STOP; otherwisereturn to step 2.
(a) (b)
Fig.2. Execution procedure of the algorithm (a) Input image (b) segmented input image.
Fig.3. Fuzzy C mean Clusters.
In order to explain the execution procedure of the proposed algorithm on the input image as shown in Figure 2 (a). The input image is initially segmented in to various parts as shown in Figure 2 (b). After segmenting the X-ray image of alphonso mango under consideration, fuzzy C-means clustering algorithm has been used. The resultant data contains two clusters, defective and healthy portions, as shown in Figure 3. First cluster represents healthy tissue and second represents Spongy Tissue defects in the sample alphonso mango under consideration. Cluster containing lesser number of elements is recognized as a cluster that represents the defect in the alphonso mango.
VI.
R
ESULTS ANDD
ISCUSSIONS
Fig.4. X-ray images of defective alphonso from database and detected defects
The proposed algorithm for detection of defects in the alphonso mango is a non-destructive technique that combines PCA to locate the defect effectively with moment as statistical feature and Fuzzy C-Means as a data clustering technique. Performance of the algorithm is carried out on the generated database of healthy and defective alphonso mangoes [1] that is easily available for the researchers working on the said area. Experimental results computed using the algorithm has been validated manually with the cut sections (available in the database) of few samples of defective and healthy alphonso mango images.
Experimental results for defect detection in alphonso mangoes using the proposed algorithm are shown in Figure 4 and Figure 5. Experimental results show that the proposed method can detect defects correctly. To find out the efficiency of the proposed method, classification rate 𝐶𝑟have been calculated as,
𝐶𝑟 = (𝑁𝑐+𝑁𝑑)
𝑁𝑡 ∗ 100 % (9)
where,
𝑁𝑐 is the number of segmented regions containing healthy
tissue,
𝑁𝑑 is the number of segmented regions having defects,
𝑁𝑡 is the total number of segmented regions.
Fig.5. Manually created defects in alphonso mangoes, their X-ray images and detected defects.
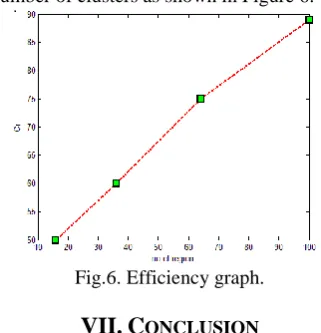
The efficiency graph is plotted against classification rate versus number of clusters as shown in Figure 6.
Fig.6. Efficiency graph.
VII.
C
ONCLUSIONThe proposed method for defect detection in alphonso mango combines a concept of PCA and histogram. The number of regions depends on size of the defect. Classification rate increases as the number of segmented region increases and after 89% of classification rate the efficiency of the proposed method remains constant. This method does not require training collection. The principal components preserved the most energy of the original data, and provided good performance in recognizing obviously separated classes. The first principal component of PCA presents the highest discriminant power among other principal components.
The step and mask sizes affects performance of the algorithm. The step size should be less than or equal to the size of mask in order to cover all the pixels from the original image. Step size and window size of the mask can be tuned in such a way that size of mask should be large enough to cover the defect at least more than two times in horizontal as well as vertical scanning for selected step size and mask size should be small enough to reduce the width of patch at abrupt changes in orientations in order to detect exact region boundaries. The number of clusters used for the classification plays a vital role in final segmentation results.
A
CKNOWLEDGMENTThe authors are thankful to the “Board of College and University Development (BCUD), Pune University, Pune”
“Research Proposals under University Research Grant Scheme for the year 2013 – 2015.” The authors are also thankful to the anonymous reviewers for their valuable suggestions and comments in improving the quality of the paper.
R
EFERENCES[1] Sandeep M. Musale and Pradeep M. Patil, “Database
development of defective and healthy alphonso mangoes,” in proceedings of International Conference on Food, Agriculture and Biology (FAB-2014), to be held at Kuala Lumpur (Malaysia), June 11-12, 2014.
[2] Padda S.M., do Amarante C. V. T., Garcia R. M., Slaughter D.
C., and Mitcham E. M, “Methods to analyze physico-chemical changes during mango ripening: A multivariate approach,” Postharvest Biology and Technology, vol 62, pp 267-274, 2011.
[3] Subedi P.P., Walsh K.B. and Owens G, “Prediction of mango
eating quality at harvest using short-wave near infrared spectrometry,” Postharvest Biology and Technology, vol 43, pp 326-334, 2007.
[4] Sivakumar D, Jiang Y and Yahia E.M, “Maintaining mango fruit
quality during the export chain,” Food Research International, vol 44, pp 1254-1263, 2011.
[5] M. Turk and A. Pentland, “Eigenfaces for Recognition,” Journal
of Cognitive Neuroscience, Vol. 3, No. 1, pp 71-86, 1991.
[6] B. Josso, D. Burton and M. Lalor, “Texture orientation and
anisotropy calculation by Fourier transform and Principal Component Analysis,” International Journal of Mechanical Systems and Signal Processing, Vol. 19, pp 1152–1161, 2005.
[7] J. Flusser, “Moment Invariants in Image Analysis,” Proceedings
of World Academy of Science, Engineering and Technology, Vol. 11, pp 196-201, 2006.
[8] D. Kim, K. Lee, and D. Lee, “A novel initialization scheme for
the fuzzy c-means algorithm for colour clustering,” Pattern Recognition Letters, Vol. 25, No. 2, pp 227-237, 2004.
[9] W. Cai, S. Chen, D. Zhang, “Fast and robust fuzzy c-means
clustering algorithms incorporating local information for image segmentation,” Pattern Recognition, Vol. 40, No.3, pp 825-838, 2007.
[10] J. Fan, M. Han, J. Wang, “Single point iterative weighted fuzzy
C-means clustering algorithm for remote sensing image segmentation,” Pattern Recognition, Vol. 42, No. 11, pp 2527-2540, 2009.
A
UTHOR’
SP
ROFILESandeep S. Musale
(M’12) received his B. E. (Electronics&
Telecommunication) degree in 2004 from University of Pune, Pune, (India) and M. E. (Electronics) degree in 2008 from University of Pune, Pune, (India). From 2004 to 2014 he worked as Lecturer and Assistant Professor in department of Electronics Engineering at PVG’s College of Engineering & Technology, Pune, (India). He is member of various professional bodies like ISTE and IEEE. His research area is Defects detection in Agro Products using non-contact techniques.
Dr. Pradeep Mitharam Patil
(M’04) received his B. E. (Electronics) degree in 1988 from Amravati University, Amravati, (India) and M. E. (Electronics) degree in 1992 from Marathwada University, Aurangabad, (India). He received his Ph.D. degree in Electronics and Computer Engineering in 2004 at Swami Ramanand Teerth Marathwada University, (India). From 1988 to 2011 he worked as Lecturer and Assistant Professor and Professor in department of Electronics Engineering at various engineering colleges in Pune University, (India). Presently he is working as Dean, RMD Sinhgad School of Engineering and Director of RMD Sinhgad Technical Institutes Campus, Warje, Pune, (India). He is member of various professional