Munich Personal RePEc Archive
Why Funds of Funds?
Lai, Richard
Harvard Business School
15 February 2006
Online at
https://mpra.ub.uni-muenchen.de/4762/
Why
Funds
of
Funds?
Richard Lai1
First draft: December 20, 2004
This version: February 15, 2006
Private equity funds of funds (FOFs) have become big business. Today, FOFs form 14% of new money
raised. I test six explanations for why limited partners (LPs) might use FOFs. First, I find that FOFs do not
generally deliver superior returns. They do, however, perform well enough for the limited partners (LPs)
that hire them. Second, FOFs allow small LPs to scale upward, to invest in more funds. However, I find that
they do not contribute to diversification. What they really do is to provide smaller LPs a way to lower the
cost of fund management. Third, FOFs allow large LPs to scale downward, to invest vast amounts over a
short duration. However, the mechanism is imperfect because LPs can either use many FOFs and risk
coordination problems among these FOFs, or use few FOFs and risk getting held up. Fourth, FOFs are used
by LPs with weaker governance structures. Fifth, there is some evidence that LPs use FOFs to learn to invest
in new areas, but the support is weak. Last, the use of FOFs is partly due to cyclical booms. These empirics
also shed light on theories of financial intermediation, organizational boundaries, and agency mechanisms.
1 Harvard Business School, Morgan Hall T47, Boston, tel: 617 495 7228, fax: 617 496 4397, email: [email protected]. I thank
Private Equity Intelligence for kind permission to use its data, and the Government of Singapore Investment Corporation
for the arrangement with PEI. I thank Josh Lerner and Wan Wong for feedback, and participants at the Midwest Finance
Why
Funds
of
Funds?
Private equity funds of funds (FOFs) have become big business. Their number tripled over the last three
years. The amount raised doubled from $3.3 billion in 2000 to $6.3 billion in 2001, when other types of
private equity slumped 60%. Today, FOFs form 14% of new money raised (Hyde (2002)).
This growth is puzzling. FOFs charge fees of 1% to 3% of assets, on top of and with the same magnitude as
those by underlying private equity funds. A small number of FOFs, like Hamilton Lane, even have interest
carry of up to 15%, on top of the 20 to 30% that venture capitalists (VCs) charge. One limited partner (LP)2
exclaims: “Too many people are stepping on the money!”
While intermediation is much studied in the context of retail investments and mutual funds (see for example,
the work by Chan (1983) and Holmstrom and Tirole (1997)), it is much less well understood in an
institutional setting. Indeed, why LPs use FOFs is even more bewildering than why individuals buy mutual
funds: unlike retail investors, who might be resource‐ or skill‐challenged, institutions might be expected to
need no help from intermediaries. Is it because:
1. FOFs deliver better returns than some LPs can manage on their own?
2. FOFs help small LPs in upward scaling, to achieve diversification over a wider set of funds and to
avoid subscale operations?
3. FOFs help big LPs in downward scaling, so that these LPs can ramp up their private equity
investments quickly? Downward scaling can also mean that large LPs can collapse many tedious
fund‐level approvals into an umbrella approval for a FOF, by giving the latter discretionary
authority. Finally, the LPs do not have to build enormous capacity during the sparse investment
points and capital calls, only to have the capacity underutilized at other times3.
4. LPs with weaker governance structures use FOFs to shoulder the blame in case of bad performance?
Or maybe LPs with strong governance but little resources to monitor VC funds want FOFs as
additional pairs of eyes on the VC funds?
2 Personal communication with European‐based LP. I use “institutional investor” and LP interchangeably in this paper.
A survey by Asset Alternatives, Inc. shows that the mean management fee is 0.76% to 1%, and the carry is bi‐modal, with
most firms charging 0% or 5% (with a 8% hurdle rate) (2002).
3 Upward and downward scaling are suggested by Asset Alternatives (2002), as described in the HBS case study by
5. FOFs are learning vehicles, used by new LPs or LPs venturing into new areas?
6. FOFs are a result of too much money chasing too few deals in recent years, a temporary or cyclical
phenomenon of the boom?
These explanations need not be exclusive, or even exhaustive. The first contribution of this paper is to
document rigorous tests of these explanations for this burgeoning but largely unexplored part of finance,
adding to the work of Gompers and Metrick (2001) for institutional funds and others for various types of
private equity (e.g., Gompers and Lerner (1996), Mayer, Schoors and Yafeh (2002)). To do this, I take the
union of the major datasets used in previous studies of private equity and add to that proprietary data from
a major LP that manages over $100 billion, on the same order of magnitude as Calpers’ $183 billion, but has a
considerably bigger private equity arm that has co‐investments with GPs such as Sequoia Capital, Matrix
Partners, Summit Ventures, and TA Associates. I also obtain public information and hand‐check the data,
resolving a number of errors. Also, unlike previous studies (with the prominent exception of Cochrane
(2001)), I correct for selection bias in my estimations. This is a problem pointed out by Kaplan and Schoar
(forthcoming). The second contribution of the paper is to articulate how the empirics shed light on theories
of financial intermediation, organizational boundaries, and agency mechanisms. These contributions are
really more modest than they sound, because with such a broad sweep, this paper cannot be deep. The plan
is to use the data assembled for this paper as a platform for deeper inquiry in the future.
But first, a word on how I define an FOF in this paper. I define it broadly, to include any fund that its
manager calls an FOF and whose manager is not also the LP4. Therefore, I exclude activities of advisors or
gatekeepers, but include FOFs who do not have discretionary authority. By including non‐discretionary
FOFs, I get more heterogeneity in my dataset. I also exclude those funds that might occasionally invest in
funds but for the most part, their investment charter is to invest directly.
Some FOFs are captive or customized, industry jargon for those set up dedicated to single LPs. A prominent
example is Grove Street Advisors’ California Emerging Ventures, set up for CalPERS. However, most FOFs
are set up like regular VC funds, except that they invest in funds rather than operating companies. An
example is Lexington Capital Partners’ eponymous fund II, whose LPs include Franz and Frieder Burda,
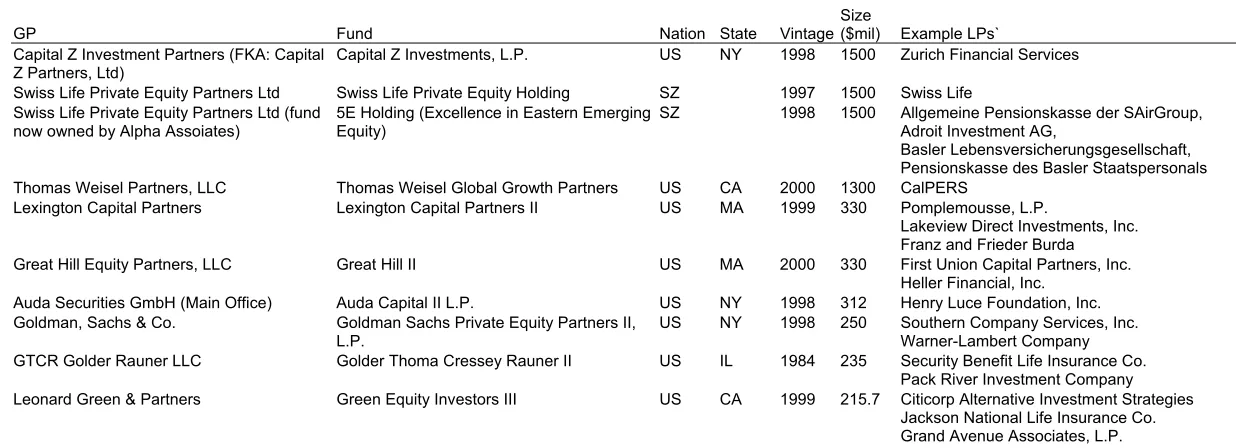
Lakeview Direct Investments, and Pomplemousse, among others. Table 1 shows some examples of FOFs.
The rest of this paper has three parts: (1) theory and key findings, (2) data, and (3) results.
4 For example, the Government of Singapore Investment Corporation calls itself a “fund of funds” in the sense that it
THEORY AND KEY FINDINGS
Each of the explanations outlined earlier – returns, downward and upward scaling, governance, learning,
and booms – can draw upon a rich set of theories. My focus is on highlighting where theories offer
conflicting predictions, so that this paper can shed light on them using the FOF setting.
Returns
Lerner, Schoar and Wong (2004) show that advisors do better than most other types of LPs, except
endowments (see their Table 3). Their unit of analysis is the LP who invests in funds, of which one type is
“advisors.” If this includes FOFs, then their study suggests that FOFs offer potentially high returns.
However, my focus is not on LPs who might be FOFs, but LPs who use FOFs. Indeed, there are three
perspectives of how to compare FOF performance, each answering a distinctive research question. The first
is to compare FOFs with other types of funds. For example, this might answer a question from the
perspective of an LP: should I invest in an FOF versus directly into a private equity fund? The second is to
compare FOFs with other types of LPs. This answers the question, perhaps for the general partner of the LP:
are FOFs able to pick funds with better returns than my LP can? Yet, neither of these answers the question of
why FOFs exists, since FOFs can exist as long as there are some LPs who find it worthwhile using them, even
if other LPs do not. This suggests yet another method: compare FOF‐using LPss with LPs who do not use
FOFs.
I find that the answers to these questions are: (1) compared with other funds (i.e., as a recipient of money),
FOFs do less well on average, (2) compared with other LP types (i.e., as a selector of funds), on average, FOF
performance is statistically no different from zero, and (3) most important, FOF‐using LPs get better returns
from their FOF portfolios than their non‐FOF portfolios. The exceptions are those FOF‐users who are
already good fund selectors – i.e., their non‐FOF portfolios compare well with the portfolios of non‐users.
This suggests that, to a select clientele of LPs, FOFs do deliver value.
Where might superior returns come from? One possibility is a size effect. Or perhaps FOFs, as boutique
shops, could better attract and retain talent. In particular, they have people who have more experience and
the relationships to gain superior access to better funds? As suggested by Hardymon, Lerner, Leamon and
Angella (2003), better access could also arise because GPs prefer FOFs because the latter need less hand‐
holding, unlike inexperienced LPs, and they do not require GPs to fill bulky questionnaires, unlike the
gatekeepers so often engaged by pension fund investors. Finally, could FOFs garner superior returns
What do theories predict, and what do I find? Starting with size, a good place to start is to consider the
theories on mutual fund performance. In that literature, the size effect has many views. One is that size
offers economies of scale. But size can limit the ability of a money manager to make large trades, with its
attendant impact on price and liquidity, as pointed out by Chen, Hong, Huang and Kubik (forthcoming).
Grinblatt and Titman (1989) find that size has an overall negative impact. Like Kaplan and Schoar
(forthcoming), I find that FOF size has a concave relationship with returns, but unlike them, I find this
statistically insignificant. The finding adds weight to their theme that size does not have a straightforward
linear relationship with performance.
I find that once size is controlled for, the explanatory power of FOF‐usage is reduced but does not vanish, so
something more is going on. The second possible driver of returns is the ability of FOFs to attract and retain
talent, who have the requisite experience and access to better funds. While I do not have data on talent, I
have data to test for experience and access. Contrary to popular opinion, I find that FOFs tend to have less
experienced staff. This might account for their generally negative performance. In terms of access, FOF‐
using LPs are less skilled than non‐users. Looking at the former’s FOF and non‐FOF portfolios, I find that
their FOF portfolios do show better access than their non‐FOF portfolios. In short, FOFs deliver superior
access to those with poor access.
A final consideration is risk. Since all the above findings have controlled for observable characteristics such
as stage and scope of investment, it appears that risk alone does not explain for the mixed performance of
FOFs.
Upward Scaling
In upward scaling, FOFs might help small LPs to: (1) achieve diversification over a wider set of funds and (2)
avoid subscale operations. The picture I have in mind is in Figure 3. Suppose the minimum efficient scale,
however measured (say relative to market practice), has an upward‐sloping relationship with the degree of
diversification (a measurement which I will describe below). That is, if an LP wants to put money in many
funds (diversify), it has to be a big one (large minimum efficient scale). The first question is whether FOFs
help LPs move right. The second question is in moving up – i.e., conditional on a desired level of
diversification, LPs can be smaller to achieve minimum scale.
The diversification issue has been heavily studied in the context of mutual funds. The received wisdom is
that retail investors can diversify by themselves without overly high transaction costs, so diversification
cannot be a motive for investment or fund premium. Cumby and Glen (1990) show this for international
informational advantage in narrow sectors. Kacperczyk, Sialm and Zheng (2004) look at mutual funds from
1984 to 1999 and find that controlling for other effects, concentration helps performance in a risk‐adjusted
sense.
I find that diversification is unlikely to be a motivation for using FOF too, since the non‐FOF portfolios of
FOF‐using LPs are more diversified than the portfolios of non‐users. Furthermore, conditional on FOF usage,
the FOF portfolio is less diversified than the non‐FOF portfolio.
Although diversification may not be an explanation, what about the other dimension of upward scaling, that
sub‐scale LPs might use FOFs to get to minimum efficient scale? I find this to be more plausible. This cost‐
reduction explanation can also be cast in terms of outsourcing, analogous to the case for mutual funds,
studied by Chevalier and Ellison (1997) and Chen, Hong and Kubik (2004). They suggest three more
predictions. First, FOF‐using LPs, as principals, must have the tool to ensure that FOFs as agents indeed
exert the appropriate amount of effort. That tool is high‐powered incentives. In my case, the specific
prediction is that the use of FOFs would increase the chance of an LP not investing in a follow‐on FOF in the
same series for poor performance, a test suggested by Lerner, Schoar and Wong (2004). This sensitivity
should be skewed more toward poor performance. Second, if FOFs operate under higher‐powered
incentives, they should take less risk, since effort is unobservable but poor performance is. Third, if FOFs
take less risk, they ought to get lower return, assuming a reasonably efficient market. This last prediction
does not contradict the earlier one which says that I expect higher returns for FOF‐usage, because that is after
controlling for risks.
I find that LPs do use higher‐powered incentives for FOFs. Specifically, LPs’ reinvestment decisions in
follow‐on FOFs are more performance‐sensitive than those for other funds. I also find that FOFs do take
lower risks, controlling for other effects. As a consequence, they also have lower returns, adjusted for risks.
Downward Scaling
There is another explanation for the use of FOFs, this time by large LPs. The oft‐told story is that of Calpers’
need to ramp up its private equity investments. The peculiarity of the situation is that working with
multiple FOFs might increase the chance of these FOFs battling with each other, using Calper’s money
among themselves, to invest in the same portfolio company. Theories on vertical restraints inform this
problem, which is often identified with the lack of coordination and free riding among distributors. There
are standard industrial organization prescriptions, the most common of which is to reduce the number of
distributors or establish exclusive territories, first explored by Telser (1960). This is the exactly analogy of
makes Calpers subject to holdup problems, especially when it is difficult to monitor the FOF’s real effort. I
should expect to see some remedial devices, such as the kind of staging solution documented by Gompers
(1995). Ironically, this leaves unsolved the original problem of how to rush out large quanta of money into
the market. The FOF setting offers an interesting one to see how the empirics turn out, since this issue of
rushing out large quantities through exclusive agents might be increasingly important in a world where
product lifecycles are shortening. I find empirical support for this tradeoff mechanism.
Downward scaling can also mean that LPs use FOFs so that they can collapse many tedious fund‐level
approvals into an umbrella approval for FOFs given discretionary authority. This is reminiscent of the
Grossman and Hart (1986) argument that ownership of assets and residual rights should optimally be in the
hands of the party that has a comparative advantage in capabilities (in this case, in moving fast). By
outsourcing to FOFs, LPs also do not have to build enormous capacity during the sparse investment points
and capital calls, only to have the capacity underutilized at other times. Both of these are efficiency
arguments, and are covered in the previous discussion on outsourcing. Therefore, I do not repeat any testing.
Governance
Lerner, Schoar and Wong (2004) posit that one of the reasons some LPs such as endowments might
outperform others is that they have better governance structures in place. Their managers are less likely to
be political appointees, and are more likely to have high‐powered incentives. I find confirming evidence of
this for the use of FOFs too. Specifically, I find that public‐sector LPs tend to use FOFs more than any other
LP types.
Learning
LPs might also use FOFs as stepping stones into less familiar investment areas. A common learning
mechanism is to insist on co‐investment rights when signing up the FOF. For example, Grove Street
Advisors agree to let Calpers invest alongside GSA’s investments, and in stages, reduce the proportion of
investment by GSA‐managed funds and increase that of Calpers’ direct investment into identified portfolio
companies. I do not have detailed information about co‐investment arrangements. However, if learning
were an explanation, I should see that FOF‐using LPs tend to be those who are younger or are newer to the
area of investing. I use an SUR (seemingly unrelated regression) estimation to control for the many
dependant variables (FOF usage by different investment areas like venture capital or buyouts) and
independent variables (age, newness to investing, etc.). I find support for the learning proposition, but only
only for specialized areas and not general ones.
So far, I have not incorporated FOF performance into the learning model. A different prediction of the
learning explanation is that FOF‐using LPs in say, venture capital, tend to increase their commitment to the
same investment scope after a short positive experience with FOFs. Figure 5 shows how the learning versus
performance stories might look like, in terms of LPs’ increased commitment, FOF performance, and the
length of experience with FOFs. In the left graph is the performance story. It shows that LPs would manage
more funds in‐house if their FOFs are not delivering, and out‐source more if FOFs deliver. In the right graph
is the learning story, which gives the opposite predictions, but only in the short‐term. In the short‐term, if their
FOFs do well, LPs would have obtained a positive learning experience and try to do more themselves,
reducing out‐sourcing. If their FOFs do poorly, LPs might try other FOFs or quit trying to learn to invest in
the area. In the longer term, conditional on learning having been saturated, the effect of FOF performance is
the same as that of the performance story. Therefore, in testing the learning story, I have to be careful not to
confound the short‐ and long‐term.
I find stronger support for the performance story, although again, there is weak support for the learning
story for specialized areas.
Temporary or Cyclical Phenomenon
There is a final explanation I can think of to explain the rise of FOFs. They could be popular in the last
decade because of the economic boom. I find support for this too.
To summarize, there is unsurprisingly more than one explanation for the use of FOFs. But surprisingly, I
find little support for some commonly thought explanations, such as the use of FOFs to take advantage of
their experience or for diversification. Even learning is only weakly supported. The general theme appears
to be the use of FOFs for more straightforward efficiency reasons.
DATA
I build the sample from several sources.
First, from SDC Platinum, I obtain profiles of 1,900 LPs who invest in 8,559 funds, managed by 3,997 GPs
(general partners). This is the official database of the National Venture Capital Association, but operated by
Thomson Financials.
Second, there is another Thomson Financials database, VentureXpert, that turns out to be sufficiently different
Third, Thomson Financials also has a print version of the Directory of Limited Partners that is yet again slightly
different than the first two! I have to hand‐code information from this source.
Fourth, from Private Equity Intelligence, I obtain a dataset with profiles of funds, GPs, LPs, and the
relationships among theses. Importantly, PEI has internal rates of return (IRRs) for 1,782 funds, which are
said to be cross‐checked between reporting by LPs and GPs. Although I have only IRR as the single measure
of performance, Kaplan and Schoar (forthcoming) show that this measure is highly correlated with others
they use. These were IRRs calculated with cash in‐ and out‐flows, public market equivalents that benchmark
returns against the S&P 500 return, the IRRs reported to Venture Economics at the end of five years after first
closing of funds, and the total value of funds to paid‐in capital. For FOFs, the IRRs are after fees and carry of
the FOF manager.
Fifth, Asset Alternatives’ Galante Directory provides yet another source.
Sixth, I manage to get IRR and fund profiles direct from a number of LPs, and hand‐coded these. The
following have IRR information: (1) the University of Michigan endowment, (2) CalPERS, (3) California State
Teachersʹ Retirement System, (4) Colorado PERA, (5) Orange County Employees Retirement System, (6)
Regents of the University of California, (7) UTIMCO, (8) Washington State Investment Board, (9) Oregon
Public Employeesʹ Retirement Fund, (10) Ohio Public Employees Retirement System, (11) Pennsylvania
Public School Employees’ Retirement System, (12) Idaho Public Employees Retirement System5, and (13)
Illinois Municipal Retirement Fund. The others have only fund information, including their commitments
and amount drawn down. Among them, about two dozen have fairly complete and detailed lists of their
investments.6 The primary ones are the National Association of College and University Business Officers
(with endowment information) and the Employee Retirement Systems of State and Local Governments
Census from the U.S. Census Bureau (with state pension information).
Seventh, I also check in detail the websites of over 375 funds, FOFs, and LPs for original material. I use these
5 This shows the “time‐weighted rate of return in accordance with AIMRʹs Performance Presentation Standards.”
6 These are: (1) Abbott Capital Management LLC, (2) Alaska State Pension Investment Board, (3) AP2 Sweden, (4) AP3
Sweden, (5) Census, (6) Colorado Fire and Police Pension Association, (7) Delaware State Board of Pension Trustee, (8)
Finnish Local Government Pensions Institute, (9) Fondinvest, (10) Indiana State Teachersʹ Retirement System, (11) Kansas
Public Employees Retirement System, (12) Los Angeles City Employeesʹ Retirement, (13) Massachusetts Pension
Reserves Investments, (14) Minnesota State Board of Investment, (15) NACUBO, (16) New York State Teachersʹ
Retirement System, (17) Norsk Vekst Forvaltning., (18) Oregon State Treasury, (19) Oregon University System, (20)
Pennsylvania State Employeesʹ Retirement, (21) San Diego County Employees Retirement, (22) Virginia Retirement
System. I also obtain information from about 40 other LPs, but they have spotty information. Examples are the Hewlett
Foundation, the Connecticut Treasury, the European Investment Fund, and the Kern County Employees’ Retirement
to confirm what I got from the other sources or to obtain updates or new information. From another 400
plus websites of these similar entities and those of third‐parties such as magazines, books, reports, and 44
HBS cases and teaching notes, I find information such as whether two funds belong to the same GP under
different names.
Finally, I use Nelson Information’s Investment Managers. From this, I extract by hand the age, experience,
and years‐with‐firm information for executives in LPs and FOFs. There are over 1,700 money managers in
the database, and I randomly select 706 into the dataset.
From these sources (except the last), I construct a union of the datasets, manually matching fund with fund,
LP with LP, assigning each a unique identifier. One tricky bit about assembling these datasets is that there is
some recursion in the logic, since an FOF can be in a fund dataset as well as an LP dataset. I have to ensure
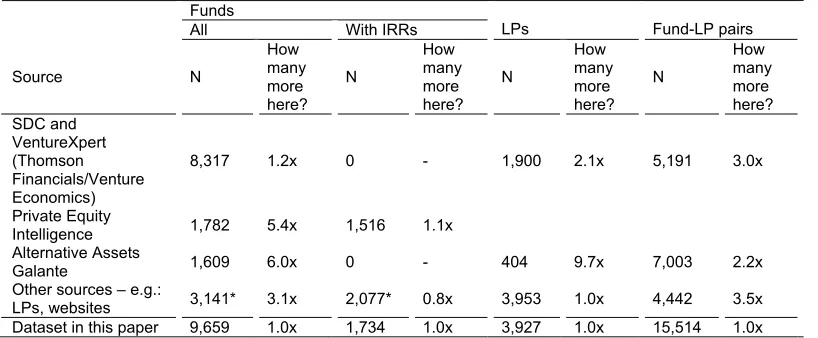
that the entity is correctly identified as the same one in both. With these multiple sources, Table 2 shows that
I am able to significantly enlarge the samples of any individual source taken alone. This is important given
the sampling biases in individual datasets, as reported by Kaplan, Sensoy and Stromberg (2002).
Table 2 does not, however, show the qualitative improvements in the dataset. Scrubbing using multiple
sources and the visual inspection of each observation turns out to be important because each non‐original
source has its share of errors or issues to resolve. For example, some of these are due to different reporting
times (I take the latest) and others to coding errors (e.g., fund’s closing date does not match with vintage
year). Conversely, some funds have the same label but are really different. For example, there are several
entries for an “Allstate Insurance Co.” fund, but one was started in 1958 and another 1987. Using
discriminating information such as vintage and size, I identify these distinctive entities.
The trickiest is the IRR information, since the differences are mostly genuine – LPs could enter the same
funds at different times, often producing dramatically different IRRs. This is highlighted by a stinging letter
from HTMF (Hicks Muse Tate & Furst, a GP) to its LPs and the Financial Times for reporting CalPERS’ return
from Fund III as 5%, rather than 14.4%7. The complaint is that the Financial Times “mis‐characterized” the
fund’s IRR, since CalPERS entered Fund III only in 1997, after the formation of the fund in 1996. The main
estimations are done using IRRs for the full investment duration of the funds, but I also conduct robustness
checks using LP‐specific IRRs from the dozen LPs listed above.
7 Letter from Mr. Dan H. Blacks, HTMF partner, to the Financial Times, July 23, 2001. This appears to be unpublished, as a
RESULTS
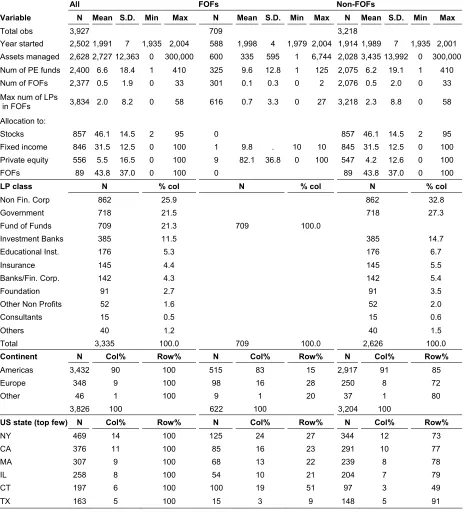
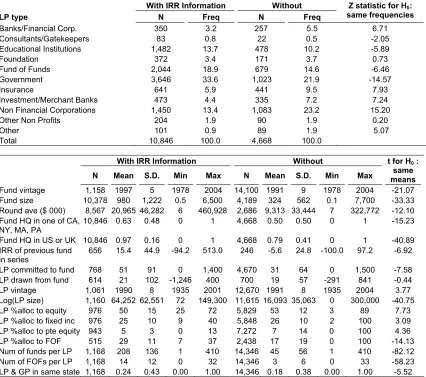
My empirical strategy follows the example set out by Lerner, Schoar and Wong (2004). Table 3 summarizes
the dataset of LPs. A few observations stand out. First, there is sufficient heterogeneity among key variables,
such as vintage and size (assets under management), overall and even within types of LPs that use or do not
use FOFs. Although I do not have many observations where the percent allocation to FOFs is observed, for
those observed among FOF users, there is also heterogeneity in allocation, from 0.1% to 100%. There is also
heterogeneity in the type of FOF used, captured by the rather awkward “maximum number of LPs in the
FOF.” Say an LP invests in several FOFs. Each FOF may draw money from any number of LPs. The
“maximum number of LPs in the FOF” is the maximum of this last, for an LP’s FOF. LPs who use only
captive FOFs would have this equal to 1. Among FOF‐using LPs, the mean is 2 LPs in their FOFs.
The second observation about Table 3 is that FOF‐users in general tend to be older. In panel (b), the mean
vintage for those FOF‐using LPs is 1989, while that for non‐users is 1991. Third, the average size of the FOF‐
using LP is larger than that of the non‐users, suggesting that FOF‐usage is not confined to ill‐endowed small
LPs trying to scale up. Fourth, FOF‐using LPs in general allocate less of their portfolios to private equity.
Fifth, FOF‐usage by LP class is consistent with the earlier observation that large LPs are not averse to using
FOFs. Banks and non‐financial corporations tend to use FOFs less. This is plausible if we believe that banks
have asset management skills and contacts as good as most FOFs’. It is less obvious why non‐financial
corporations (which include corporate pension funds) use FOFs less – perhaps they are too small to be of
interest to FOFs, or perhaps the non‐pensions among them are corporate venturing LPs who prefer direct
investments of strategic interests. Educational institutions tend to use more. This is somewhat surprising
because education institutions tend to be performance‐oriented, hinting that FOFs deliver value to some
types of LPs. Interesting, some FOFs are LPs themselves, who in turn invest in FOFs. However, this is rare.
Sixth, in terms of usage by geography, FOFs are used slightly more in the Americas than elsewhere. This is
to be expected if we believe that the fund management business is more developed in the former. For
American LPs, usage has only slight variation by state location, at least among the states with the most LPs.
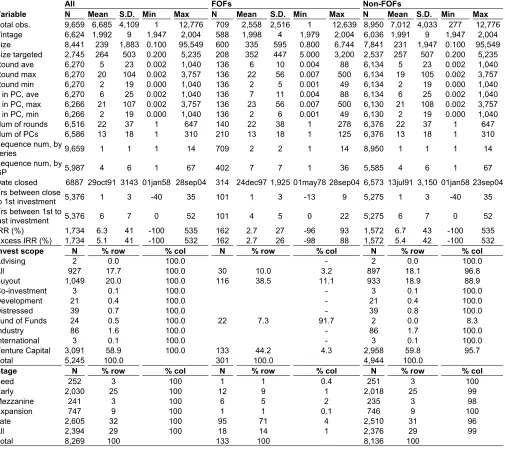
Table 4 also shows summary statistics, this time for funds, including FOFs as a distinct group. I tabulate
FOFs both as LPs and as funds. As LPs, the perspective is interesting as a comparison to previous work on
LP performance. As funds, the perspective is more pertinent to this paper, with the LP as a decision‐maker
looking at FOFs versus regular funds.
Again, several interesting observations stand out in the table. First, FOFs appear to be larger than non‐FOFs
tend to be younger. This is expected, since the FOF phenomenon is relatively new. Third, FOFs take longer
from closure of financing to the first investment. This is somewhat surprising since I expect that it is easier
to find and evaluate funds than portfolio companies. The small number of observations for this statistic may
be driving this. The mean time from the first investment to the last is 3 years for FOFs and double that for
non‐FOFs. This is more consistent with my expectation that it is easier to find and evaluate VCs than to do
so for portfolio companies. Fourth, FOFs appear to have bigger sequence numbers in the dataset. Venture
Economics provides sequence numbers at the GP level. However, LPs might make follow‐on investments in
the same fund series, not across series. Therefore, I manually construct another sequence number, based on
fund series. I am able to unambiguously identify the number for 2,885 funds. The larger average sequence
numbers for FOFs suggest, but do not conclusively imply, that FOFs run “out of fashion” less frequently
than the regular private equity fund. Fifth, the investment characteristics of FOFs and non‐FOFs appear
similar. FOFs tend to invest amounts as large as those for non‐FOFs, both per round as well as per portfolio
company8. The rather large amount by non‐FOFs masks the fact that there are buyout funds in that category.
For example, the round average for non‐FOF buyout funds is $24.6 million. Sixth, and glaringly, the mean
IRR for FOFs is lower than that for non‐FOFs. I also calculate “excess IRRs,” which are IRRs from the
benchmark IRR of funds grouped by: (1) vintage, (2) stage (e.g., early versus mezzanine), (3), investment
scope (e.g., venture capital versus distressed debt), and (4) continent (e.g., Americas versus Europe). The
means of excess IRRs exhibit the same pattern.
The rest of Table 4 does not have sufficient data for FOFs, so I just document them. Because commercial
datasets classify FOFs along the same dimension as others in “investment scope,” the data does not show the
scope of FOFs themselves. The distribution of FOFs by stage is also spotty. There is more information on
location, and it is interesting that many FOFs are in Connecticut, relatively speaking.
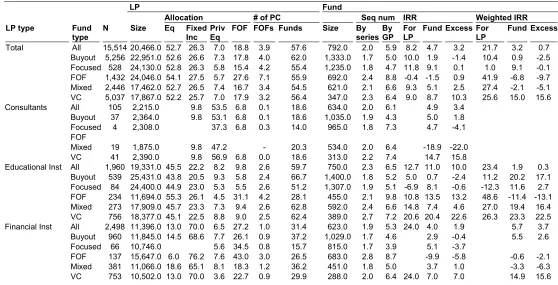
I next link LPs with funds. Table 5 shows the characteristics of LP‐fund observations, following the
approach in Lerner, Schoar and Wong (2004).
Once again, I list some observations. First, comparing the overall LP profile of these LP‐fund pairs with the
profile of just the LPs, I see that the average LP here is much larger, at $20.5 billion rather than $2.7 billion.
Therefore, the results in this paper need to account for this bias. The larger size, however, is not significantly
larger than the $18.0 billion average in the LP‐fund dataset in Lerner, Schoar and Wong (2004). The other
characteristics, such as vintage, allocations, and number of investees, are not significantly different from
theirs.
Second, continuing on the overall profile into funds, the comparison between fund size here and in the pure
fund dataset earlier shows a size bias, with a larger mean here ($792 million) versus there ($239 million).
This is comparable with the same in Lerner, Schoar and Wong (2004), who have $777 million versus $406
million. Consistent with those authors’ report, the mean sequence numbers are higher for educational and
non‐profit institutions and consultants, and lower for financial institutions. The IRR is also generally higher
for educational institutions. My dataset also has IRRs specific to LPs. Funds of funds seem bludgeoned to
death on IRRs. However, I need to check LP‐specific returns. This is important as some GPs complain that
any IRR disclosed for a LP‐fund is specific to the LP due to the LP’s timing of entry into the fund. Since
Private Equity Intelligence’s fund IRRs are at the level of the fund, I check if LP‐specific returns are any
different. To the extent data is available, the LP‐specific returns do look somewhat different. I present
results later on the statistical significance of this.
Third, moving onto investments into funds of funds, the table shows that the investing LPs are not strikingly
different than those of the general profile. Returns from funds of funds also appear relatively low, compared
to the general returns profile earlier.
I also create a smaller dataset for fund vintages 1998 or earlier. This excludes right‐truncated observations
that might not have performance data, avoiding some of the look‐ahead bias described by Carhart and et al.
(2002). All the estimations below are repeated with this smaller dataset. Because the results are qualitatively
unchanged, I do not report them, except for a few important regressions.
I now test the specific explanations discussed earlier.
Returns
Recall that I propose three perspectives for looking at FOF returns, each answering a distinctive research
question. The first is to compare FOFs with other types of funds. The second is to compare with other types
of LPs. The third is to compare between FOF‐users and non‐users, rather than between funds or LP types.
1 – Comparing FOFs with Other Funds. To answer the first question, I compare fund returns under a
number of controls. To control for scale differences, I use fund size and sequence numbers. Kaplan and
Schoar (forthcoming) show that these can have quadratic relationships. They also control for risk using an
indicator for venture capital (VC) funds. In Table 6, Model (1) is my replication of their main result in their
Table VIII. My signs are all identical to theirs. However, their estimation has significant coefficients for
This is despite my having 1,256 observations, compared with their 746. However, the F statistic on my two
size variables together is 14.1, which is a highly significant p‐value of 0.000. And like them, I obtain little
significance on the sequence variables. Therefore, I believe we have directionally the same results.
As a robustness check, I undertake a second estimation in Model (2) with a different definition of “sequence”
‐ by GP, rather than fund series – and with an additional NASDAQ level control. I also use GP fixed effects.
The definition of GP itself poses a problem. It is not obvious whether say, “3i PLC” (from the UK) and “3i
(US),” should be considered the same GP. The answer depends on how 3i organizes itself, which is
information that is difficult to obtain for all GPs. By inspecting the 4,849 corporate names, location,
investment, scope, and vintage, I am able to hand‐code two distinct variables: one that classify GPs broadly
at the holding group level (GPglobalID) and another at the local organizational level (GPlocalID). This
distinction also happens when a GP morphs, say after acquisitions, from “Adler & Co.” to “Adler &
Shaykin.” Model (2) uses GPglobalID. After all this, the results are qualitatively unchanged from those of
Model (1). They are also unchanged using GPlocalID (unreported).
I now come to the FOF question. Model (3) has the same specification as (2), with a new FOF indicator. The
FOF indicator has a positive coefficient, but not significant.
However, I am concerned about two kinds of sample selection bias. The first, pointed out by Kaplan and
Schoar (forthcoming), is that GPs might selectively stop or start reporting IRRs. I repeat their test, by
regressing the presence of the IRR for a fund on the IRRs for previous funds in the sequence by the same GP.
Like them, I find a positive coefficient on the IRR of the previous fund, so bias is a concern. The second
source of bias is that Private Equity Intelligence might be more likely to get IRRs from bigger funds, more
recent funds, funds that invest bigger amounts (so these are likelier to show up in the media), or funds in the
major centers (California or Massachusetts) or where PEI has offices (Pennsylvania and London). Table 7,
panel (A), shows t‐tests that reveal statistically different means between the subsets with and without IRR
information, all at the 0.000 significance level. These reasons motivate my sample bias correction below.
Going back to Table 6, in Model (4), I use a two‐stage Heckman correction procedure for my estimation. The
selection equation is a probit with the following fund‐level covariates:
ProbabilitySelected = βo + β1.log(FundSize) + β2.FundVintage + β3.RoundAverage + Σβ4.MajorStateIndicator +
β5.USorUKindicator + β6.PreviousIRR+ ε.
Hopes are dimmed in Model (4). The coefficient on the FOF indicator is negative, albeit still insignificant.
selection bias.
I have thus far relied on the controls in Kaplan and Schoar (forthcoming). But I can use more specific
controls – such as various stages of funds rather than just an indicator for VCs – and indicators for
geographic regions and investment scope. Also, besides sequence number, I can use another instrument for
risk, which is the average amount per round for each fund. Finally, I add a variable for fund vintage.
The estimation with all these additional controls is in Model (5). Now, the FOF indicator has a negative
coefficient that is very significant, at the 1% level.
All the regressions here and in the rest of the paper are repeated with excess IRR as dependant variable, and
other measures of the total fund flows, such as the S&P index and sum of private equity flows in place of the
NASDAQ. They are also repeated with the smaller pre‐1999 dataset. The results are qualitatively
unchanged and not reported here.
2 – Comparing FOFs with Other LPs. While these negative performances of FOFs look discouraging, it is
only from the perspective of an average LP. But LPs are different, and I next address the second way of
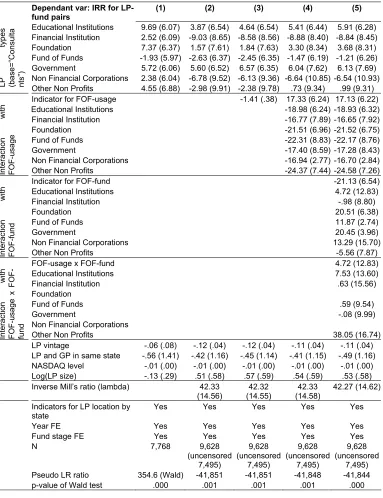
looking at FOF returns: compare if FOFs are able to pick funds better than some LPs. Table 8 starts with the
specification in Lerner, Schoar and Wong (2004), in Model (1)9. The results are qualitatively the same as
theirs. The more significant coefficients are for educational institutions and foundations, and these are
positive.
For the previous reasons, I once again employ a Heckman correction. I first build the selection model. A
suggestion of how selection works in the dataset is in Table 7, panel (b). It shows that the distribution of LP
type varies significantly between the sub‐dataset with IRRs and the one without. The LP‐fund pairs that
have IRR information tends to associated with younger funds and bigger LPs, so I use the following selection
model:
ProbabilitySelected = βo + β1.log(FundSize) + β2.FundVintage + β3.RoundAverage + Σβ4.MajorStateIndicator +
β5.USorUKindicator + Σβ6.LPtypeIndicators + β7.Log(LPsize) + ε
Table 8, Model (2), shows the Heckman corrected estimation. The inverse Mill’s ratio is large and significant,
confirming that there is sample selection bias. More coefficients for LP types are now significant, although
that for “Fund of Funds” is still not. While the top performers in Model (1) are, in order, Educational
9 These authors also do a robustness check using just funds rather than LP‐fund pairs, which might contain too much
Institutions, Foundation, and Government, those for the corrected Model (2) are, also in order,
Consultants/Gatekeepers, Government, and Educational Institutions.
3 – Comparing FOF Usage with Non‐usage. The previous result is more encouraging in terms of FOF
returns, but is still a general answer, such as “FOFs as a class performs better than many other types of LPs.”
I now take on the third perspective, which asks directly: do FOF‐users do better than non‐users, controlling
for all relevant variables?
In Table 8, Model (3), I show the estimation with an indicator for FOF‐usage. That is, unlike the previous
indicator for whether an LP is an FOF, this is indicator for whether an LP uses FOFs. Its coefficient is
negative and statistically significant. It is also economically significant: one standard deviation of FOF‐usage
(0.50) decreases IRR by 0.98 basis points; the mean IRR is 5.00 basis points and the standard deviation 40.33.
It is also useful to see how this LP comparison looks like if I add FOF‐usage as an orthogonal dimension to
LP type. Model (4) shows the interactions between the indicators for FOF‐usage and LP type. To see the
performance of FOF‐usage, I need to conduct joint tests of the indicators for both FOF‐usage and LP type.
Table 9 shows that all joint tests are significant, both statistically and for most LP types, economically too,
and in a negative way.
This is still not the end of the story because thus far, poor performance of FOF‐using LPs (versus LPs not
using FOFs) could be interpreted in two ways: is the poor performance a cause or effect of FOF‐usage? One
way to disentangle these competing explanations is to look at compare the non‐FOF portfolio of FOF‐users
and those of non‐users. This is what I do next.
In Model (5), I add an indicator for whether the invested fund is an FOF. I interact this indicator with the
earlier indicator for FOF usage. Finally, I interact these three – the indicators for FOF fund, FOF usage, and
their interaction – with LP type. A picture can help clarify what this is all about. In Figure 1, I lay out the
two comparisons we want to address. The first, which I label unimaginatively as “intra‐user comparison” is:
conditional on FOF usage, how well do LPs’ FOF investments do versus their non‐FOF investments? The
second is called “user‐non‐user comparison”: how well do FOF users do versus non‐users in selecting non‐
FOF (regular) funds? The (b) panel in Figure 1 provides a simplifying picture of these comparisons. I
tabulate the answers, by LP type, in Table 10. In general, I observe that those FOF users who are good (can
pick non‐FOFs as well as the non‐users) find that their FOF portfolios do not do as well as their non‐FOF
portfolios. This is easy to see when I plot same data on a graph, in Figure 2. This answers the question of
why some LPs use FOFs: because they are not as strong as other LPs in picking funds. Within any LP type
that some of them run FOFs themselves, so their odd position is understandable.
The analysis and finding are not surprising. However, they are useful because they clarify the appropriate
ways to evaluate FOF performance (intra‐user) and usage (user‐non‐user), and they also pose some puzzles,
such as why are there some dots positioned to the left of the vertical axis in Figure 2 – i.e., when FOFs do not
seem to contribute to performance. The rest of this paper serves to answer puzzles like these, on why FOFs
are used.
But first, let us dive deeper, to understand the drivers of returns. Recall that existing theories provide some
propositions for why FOFs could do better (or worse) than other funds in the FOF‐users’ portfolios: size,
ability to better attract and retain talent (especially those with experience and relationships to gain access to
better funds), and risks taken.
1 – Returns Driven by Size? Continuing with the dataset of LP‐fund pairs, a simple OLS regression with
log(fund size) as the dependant variable and indicators for FOF‐usage, FOF‐fund, and the interaction of
these two shows that on average, users invest in bigger funds than non‐users do. But within users, the FOFs
invested are smaller than the regular investments (unreported). I now check if IRRs are affected by this size
difference. In Table 11, I first undertake the user‐non‐user comparison; this means that I confine the sample
to investments in regular, non‐FOF funds. As a way of showing robustness of earlier results, I now use the
pre‐1999 dataset. Model (1) is without fund size as a control, and it simply confirms the qualitative results of
the earlier user‐non‐user results. Model (2) is with size as a control. The significance of all the FOF‐usage
interactions vanishes. However, a joint test on whether all these interactions are simultaneously zero is
roundly rejected, with a chi‐square of 3,300,000 and a p‐value of zero. Furthermore, the regression as a
whole and the size coefficients themselves are insignificant. I interpret this as size explaining part of the
user‐non‐user heterogeneity in performance, but there remain significant portions unexplained. Models (3)
and (4) repeat this for the intra‐user comparison – that is, I now limit the sample to only FOF‐users, and for
pre‐1999 IRRs. The result is analogous, with the joint test being rejected with a chi‐square of 6,500,000 and p‐
value of zero.
I also use an alternative way of checking the size effect, similar to that used by Lerner, Schoar and Wong
(2004) when they test for the effect of investment style. Using a specification that includes fund type, LP
type, and vintage, they look at how the adjusted R‐square goes up with additional variables. In my case,
adding size and size squared increases the adjusted R‐square slightly, from 13.8% to 15.5%. The coefficient
for FOF‐usage maintains its importance, from ‐3.90 at the 0.003 significance level to ‐2.81 at the 0.037
2 – Returns Driven by Talent? The second possibility, after size, is that FOF firms pay better than FOF‐using
LPs in attracting, developing, and retaining talent. I do not have pay information, and even if I do, many
FOFs have been established only recently, so to the extent their managers’ pay have variable components
such as interest carry, the pay information might not be useful. Therefore, I focus on two observable
elements of talent that are important: experience and access.
My data on experience is also somewhat sketchy, because I do not have executives’ experience in the LPs,
but only in FOF LPs. However, I do have data for private equity funds and other public‐markets money
managers. I compare executives in FOFs against those in these outfits. While this provides some insights,
the analysis does not correlate experience with returns, holding other variables constant. Table 12 shows a
summary of the data. Ten percent of the firms are private equity firms, and 3% are private equity FOFs that
are in our earlier dataset. There are 18 in this last group, out of the 709 we have earlier. I check for
representativeness, and their sizes and vintages are not particularly skewed (unreported). The striking
observation about Table 12 is that the average private equity executive has slightly less experience and is
younger than the average money manager, and the one in private equity FOFs has even less. More formal
regressions in Table 13 confirm this. While this cannot be said to be confirming evidence that FOF executives
are less experienced or younger than those in other LPs, and even less indicative of any relationship with
returns, the fact that they are so viz‐a‐viz other private equity funds mildly suggests that the lack of
experience might be the reason for FOFs’ relatively poor performance.
The measure of talent is access. I use two ways to analyze this. First, I have some data on LP‐specific timing
of investments into funds. Presumably, only LPs, including FOFs, that have superior access can get into a
fund earlier than the generic fund vintage date given by commercial sources like Thomson. This is true ex
ante, for funds of high or low quality. Therefore, my first method is to check if FOFs enter funds earlier. The
second method follows Lerner, Schoar and Wong (2004) by investigating whether any relationship between
IRR and FOF usage disappears if the dataset is limited to young funds. For young funds, it is argued, no LP
would have superior access through earlier, established relationships. The results of these two methods are
qualitatively the same, so I report only that from the first method.
Table 14 shows the summary of the differences in access, measured by (the negative of) lateness, which is in
turn defined as the year the LP enters a fund subtracted by the fund vintage year. Some of the lateness
figures in the table are very large, and this is due to a number of funds that are open‐ended. Since I want to
entry. I use various cut‐offs, from 10, 5, and 3 years10. As the table shows, FOF‐using LPs tend to be later
than non‐using LPs when entering regular funds. The difference is significant. This means that FOF‐users
have poorer access, which might be the reason they employ FOFs. In the intra‐user comparison, the FOF‐
users’ FOF portfolios have statistically significant better access than their non‐FOF portfolios. The next step
is to see if these superior access by non‐users and FOFs really contribute to better returns. Table 15 shows
that the answer is: likely. Models (1) and (2) show the user‐non‐user comparison. In Model (1), as a baseline,
does not control for lateness. In Model (2), I add lateness and the interaction of lateness with fund size.
Without the interaction, the lateness variable has a positive coefficient (unreported). I interpret this finding
as masking early entry into low and high quality funds. Rushing into smaller funds, which I suggest is of
generally poorer or unknown quality compared with larger funds, does not tend to provide good results.
Therefore, I add the interaction variable. The access coefficients are now of the predicted signs, and are
statistically significant. Superior access is positively correlated with performance, for bigger (better) funds.
In Models (3) and (4), I analyze the intra‐user comparison. The results are qualitatively the same.
3 – Returns Driven by Risk? The final consideration is risk. I only have observable characteristics, such as
fund stage, investment scope, and round average amount. These have been either explicitly controlled for or
are worked into fixed effects in previous estimations (e.g., see Table 6). Since there are significant
coefficients on the other explanatory variables despite these, I conclude that these remaining differences are
unlikely to be due to risk.
This completes the discussion of returns by FOF, and the potential reasons behind return heterogeneity. In
the next few sections, I consider other reasons why LPs might use FOFs.
UPWARD SCALING
Upscaling is about smaller LPs using FOFs to move right (diversify) and up (improve efficiency) in the Figure
3. In Table 3, Panel (b), I observe that, on the average, it is larger LPs that use FOFs. So the upward scaling
explanation is not starting on a hopeful note. I now dive into the details to see if this pessimism is justified.
1 – Upward Scaling to Diversify? I start with the diversification dimension. In an intra‐user comparison, if I
see that the non‐FOF portfolio of an LP is more diversified – measured in some suitable way – than the FOF
portfolio, I can conclude that diversification is not a motive. If the non‐FOF portfolio is less diversified, then
it is inconclusive as to what is happening, since the lower diversification could be the cause or the result of
the more diversification achieved through the FOF portfolio. Similarly, in a user‐non‐user comparison of
non‐FOF portfolios, if a user’s non‐FOF portfolio is more diversified than that of the non‐user, controlling for
other variables that matter, then I can conclude that diversification is unlikely to be a motive, even if the FOF
portfolio of the user is indeed more diversified. Likewise, if it is less diversified, the result is ambiguous. In
short, these two tests can only falsify the proposition that diversification is a motive, but not support it.
There is a third test that can do the latter. I can check the diversification of the FOF‐user right before it
invests in FOFs. If the diversification is lower than that afforded by the FOF, this rough event‐study can
attest to diversification as a possible motive.
I use several measures of diversification. These are the number of non‐FOF funds and the number of
portfolio companies that an LP gets into, either directly or via FOFs. I also use others like the average,
minimum, and maximum round amounts, and the average, minimum, and maximum amounts per portfolio
company. Using these last six do not change the qualitative results, so I do not report their tests here. There
is yet another measure of diversification, not of funds or portfolio companies, but of investment scope and
style. I defer the discussion of this to the section below on “learning,” since learning is about going into the
uncharted waters of a new scope or style.
In Table 16, Models (1) and (2) show the user‐non‐user comparisons using the two dependant variables: the
logs of number of funds per LP and of the number of portfolio companies per fund in the LP‐fund pairs. I
control for a number of other effects that might confound my variables of interest. These include the sizes of
the LP and fund, whether the LP and GP are in the same state (since non‐economic forces might drive the
degree of diversification), the NASDAQ level, fund sequence number, and fixed effects for three LP
characteristics: the location of their headquarters by state, investment scope, and vintage. In both models,
the estimation suggests that the non‐FOF portfolios of FOF‐users are more diversified than non‐users. This is
evidence that diversification might not be a motive for using FOFs.
I conduct another estimation as a robustness check. The diversification motive, if it exists, should be stronger
for smaller LPs and might not even exist for larger ones. I add the interaction of the indicator for FOF‐users
with LP and fund sizes, as shown in Models (1a) and (2a). For Model (1a), the previous result is unchanged:
diversification is larger for the non‐FOF portfolios of users than non‐users, suggesting that it is not a motive
for LPs to use FOFs. Indeed, diversification is greater for larger LPs. The negative sign on the coefficient for
the interaction of FOF‐usage and log fund size suggests that the level of diversification obtained by FOF‐
users might be outshone by that of non‐users. The means of log LP size and log fund size are 7.89 and 5.80,
so FOF‐users’ level of diversification over non‐users is .98 + .11x7.89 ‐ .15x5.80 = .98 for Model (1a) and ‐.41