An Energy Efficient Cooperative MISO Transmission
Scheme for Cluster-based Wireless Sensor Network
Nidhi Parikh
Department of Electronics andcommunication engineering UKA TARSADIA University
C.G.P.I.T, Bardoli
Jayesh Munjani
Department of Electronics andcommunication engineering Assistant Professor UKA TARSADIA University
C.G.P.I.T, Bardoli
ABSTRACT
Wireless sensor network becomes an attractive choice for different applications because of their multitasking nature such as sensing the data, computing the data, and transmitting that data to the main location. But wireless sensor network have a number of tiny sensor nodes which are operate on small batteries. So it is very necessary to minimize energy consumption of wireless sensor network and also in new technology world we want a transmission scheme which has high throughput, good spectral efficiency and high diversity. So for these important reasons we have to analyze the efficient modulation schemes and new transmission strategies to reduce the energy consumption which is needed to transmit the number of bits per second. This paper Presents an energy model of MIMO technique and based on that LEACH-C MISO new algorithm is developed and also the results are compared for different MISO technologies.
General Terms
Routing protocol, energy management
Keywords
Energy efficiency, LEACH-C, MIMO, STBC, wireless sensor network
1.
INTRODUCTION
Wireless sensor network becomes a very hot research topic since last ten years. The element of such an infrastructure is comprised of numbers. By combining these nodes form a network called wireless sensor network. The evolution of wireless communication and circuit technology has given rise in the development of an communications consists of sensing, computational and communicating units that makes administrator capable to observe, measure and react to a phenomena. Advancement in recent hardware will allow more signal processing functionalities to be integrated in to a single chip. Also the cost of sensors will allow having a network of hundreds or thousands of them, thereby enhancing the reliability and accuracy of data and the area coverage. The MIMO technique has been recently introduced in wireless sensor network. A tiny sensor node can be seen as multiple input multiple output system where a tiny sensor node may be offered the role of a transmitting or receiving antenna of the MIMO infrastructure. This structure will increase the energy gains for a wireless sensor network, which depends on the distance between the transmitter and receiver side of the system. It is proved that above the some specific threshold distance MIMO system will be more energy efficient than SISO approach.
Typically, nodes in a wireless sensor network will be equipped with a single antenna. It is difficult to directly apply MIMO techniques in the low-cost small-sized sensors. The complex transceiver circuitry, the large amount of signal processing power consumptions at the circuit level and the limited physical size of sensor node prevented the direct application of MIMO technique to wireless sensor network. We cannot place the antenna-array in a single sensor.
Α method that has been freshly introduced in WSNs focusing on energy efficiency of sensor network is cooperative networking. A sensor network can be seen as a multi-input-multi-output (MIMO) system, where a sensor node is presented the role of a transmitting or receiving antenna of the MIMO structure. This structure may offer enhanced energy gains for a WSN. Recently there has been a great amount of research on various MIMO techniques for wireless communication systems. There are numbers of algorithms were developed for cooperative transmission in wireless sensor network. But always the problem that how to choose cooperative nodes from the number of nodes are available in wireless sensor network, so there were many techniques developed for choosing the cooperative nodes.
2. ENERGY MODEL OF MIMO
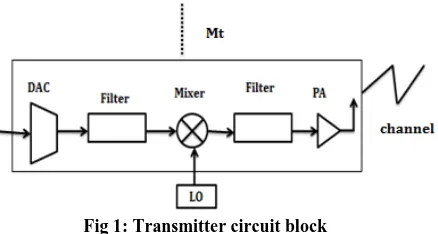
We consider a general communication link connecting two wireless nodes, which can be MIMO, multiple-input–single-output (MISO), single-input–multiple-multiple-input–single-output (SIMO), or SISO. In order to consider the total energy consumption, all signal processing blocks at the transmitter and the receiver need to be included in the model. However, in order to keep the model from being over-complicated at this stage, baseband signal processing blocks (e.g., source coding, pulse-shaping, and digital modulation) are intentionally omitted.
Fig 1: Transmitter circuit block
The total average power consumption along the signal path can be divided into two main parts:
A. the power consumption of all the power amplifiers and
B. the power consumption of all other circuit blocks
Fig 2: Receiver circuit block
The first term is dependent on the transmit power , which can be calculated according to the link budget relationship [7]. Specifically, when the channel only experiences a square-law path loss, we have
……… (1)
Where is the required energy per bit at the receiver for a given BER requirement, is the bit rate, d is the transmission distance, is the transmitter antenna gain, is the receiver antenna gain, λ is the carrier wavelength, is the link margin compensating the hardware process variations and other additive background noise or interference, and is the receiver noise figure defined as with
dBm/Hz the single-sided thermal noise power spectral density (PSD) at room temperature and is the PSD of the total effective noise at the receiver input. The power consumption of the power amplifiers can be approximated as [4]
………. (2)
Where with the drain efficiency [9] of the RF
power amplifier and the peak-to-average ratio (PAR), which is dependent on the modulation scheme and the associated constellation size [6].
Where b=constellation size for bpsk modulation b=1 and for M-QAM modulation b=2.
The second term in the total power consumption is given by
Where, , , and are the power consumption values for the DAC, the mixer, thelow-noise amplifier, the intermediate frequency amplifier, the active filters at the transmitter side, the active filters at the receiver side, the ADC, and the frequency synthesizer, respectively. To estimate the values of and we use the model introduced in [6].Finally, the total energy consumption per bit for a fixed-rate system can be obtained as;
For simplicity, we assume that Alamouti schemes are used to achieve diversity in the MIMO system. The Alamouti code with two transmit antennas, proposed in [8], uses two different symbols and that are transmitted simultaneously during the first symbol period from antennas 1 and 2, respectively, followed by signals and from antennas 1 and 2, respectively, during thenext symbol period (where denotes complex conjugate).
2.1Fixed Rate BPSK Modulation
For intra-cluster communication here SISO communication is used and for finding the energy required per bit at the receiver STBC Alamouti scheme is implemented. We assume a flat Rayleigh-fading channel can be representing as a scalar matrix.
In addition, the path loss is modeled as a power falloff proportional to the square of the distance. In other words, on top of the square-law path loss, the signal is further attenuated by a scalar fading matrix; each entry is a zero-mean circulant symmetric complex Gaussian random variable with unit variance [1]. The fading is assumed constant during the transmission of each Alamouti code word. Energy required at the receiver is directly correlated with the probability of error. Average probability of error is given by
For STBC SNR can be given by;
According to the Chernoff bound [1] (in the high SNR regime)
We can derive an upper bound for the required energy per bit
By approximating the upper bound as equality, we can calculate the per bit total energy consumption for the single input single output system according to (1) and (4). Thus, we can obtain
2.2Variable Rate M-QAM Modulation
For long-haul communication here MISO communication is used and for finding the energy required per bit at the receiver STBC Alamouti scheme is implemented. For MISO transmission Mr=1 and Mt=1, 2. By putting values of Mt and Mr SNR will be found and put the value of SNR into the equation of probability of error and here 4-QAM is used for transmitting data to the base station.
By putting the value of ;
For probability of error
Now putting equation (11) into above equation and find the final equation of Pb;
For MISO transmission Mr=1 and Mt=1, 2. By putting values of Mt and Mr SNR will be found and put the value of SNR into the equation of probability of error;
Finally from probability of error Eb will be simplified and that is given by;
We can further simplifying the bound by applying;
By approximating this bound as an equality, we can obtain the following analytical expression for the total energy consumption per bit according to;
3. LEACH-C COOPERATIVE MISO
ALGORITHM
Here it is assumed that wireless sensor networks considering with N number of sensor nodes are distributed randomly in a
given region. All nodes in the network are well located. The base-station, which is may be inside or outside of the deployment area of sensor network is assumed that it has no energy constraint compared with the common sensing nodes. Thus compare with other nodes base-station is more capable to communicate with common sensing nodes.
Similar to LEACH protocol, sensing nodes form cluster periodically and can transmit with enough power to reach the base-station node if needed. These assumptions are realistic due to technical advances in radio hardware and low-power computing [15].An additive white Gaussian noise channel with squared power path loss is considered for short intra-cluster communication range and the binary phase shift keying is used as the modulation scheme. For the long-haul (cluster to BS) transmission, frequency-nonselective slow Rayleigh fading channel with kth power path loss is assumed and use variable-rate M-ary quadrature amplitude modulation scheme to further improve the energy efficiency of the network. In order to keep the model simple, the energy consumption of baseband signal processing blocks (source-coding, digital modulation, pulse-shaping) are intentionally omitted. It is also assumed that system is uncoded. Hence, no error correcting code blocks are included .The system architecture is shown in Fig 3. Similar to LEACH, the operation of this scheme is broken down into number of rounds. Algorithm also divided into two phases as LEACH protocol.
3.1Set-Up Phase
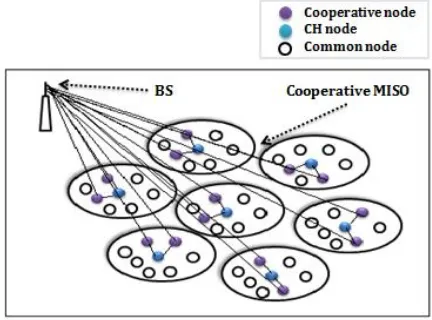
[image:3.595.322.538.462.622.2]In the cluster formation phase, the idea of LEACH-C [15] is borrowed in which each sensor node will send status information about its current location and energy level to the BS, and BS can use this feedback information to determine the optimal formation of the clusters. The cluster head (CH) in the last round will collect the feedback status information in the local cluster, and then send it back to the BS.
Fig 3: System model of cooperative MISO transmission
splitting algorithm proposed in [7] and Balanced Clustering algorithm in [8] to form the clusters, which distribute the upload evenly among the cluster heads where each CH has an approximately equal number of member nodes to avoid CH over-load. The idea of this algorithm is to first split the network into two sub-clusters, and then iterates this process by splitting the sub-clusters into smaller clusters, until the desired number of clusters kc is attained.
3.2. Steady-State Phase
3.2.1Cooperative Node Selection
The key to realize the energy efficiency of cooperative MIMO is to select the cooperative nodes that are close to the cluster-head.in the meantime, as being a cooperative node is much more energy rigorous than a sensing node, it is also needed to consistently distribute the energy load among all nodes in a cluster. Thus to attain both of the two goals, the cooperative nodes should be chosen by a threshold δ.
Where the remaining energy of each node and d is is the distance between the cluster head node and Cooperative node. Suppose Mt cooperative nodes should be selected in one cluster and all the nodes except the CH are possible candidates for cooperative nodes, we choose the Mt nodes with the maximum value of δ as the cooperative nodes. In real sensor network, the cooperative nodes selection can be done by the cluster head node with the requirement for periodical remaining energy report by all nodes in a cluster.
3.2.2Intra-Cluster Data Collection Phase
:Each common sensor node sends its data to the cluster head during its owed time slot specified by the TDMA schedule in cluster formation phase. After that, data is together and aggregated by the cluster head.
3.2.3Long-Haul Data Forwarding Phase
[image:4.595.325.544.82.262.2]After aggregating received data packets, cluster heads will forward their collected data to the Mt cooperative transmission nodes, Then the Mt cooperative nodes will encode and transmit the transmission sequence to Base-station according to the Alamouti codes [1]
Table 1. Simulation Parameters [1]
B=10KHZ
=30.3 Mw
4. RESULT ANALYSIS
4.1Simulation Environment
Here for simulation 200×200 m area is selected and 100 numbers of nodes are deployed in the network. Results have been calculated for different topologies with different base-station location and initial energy of each and every node will be set to 10J and 20J.
4.1.1. Energy-10
[image:4.595.311.550.283.604.2] [image:4.595.65.274.541.666.2]Fig 4 Round Vs total no of alive node at BS (50, 50)
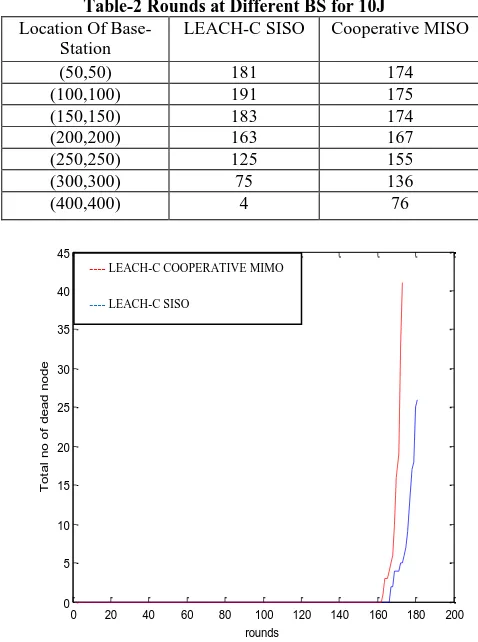
Table-2 Rounds at Different BS for 10J
Location Of Base-Station
LEACH-C SISO Cooperative MISO
(50,50) 181 174
(100,100) 191 175
(150,150) 183 174
(200,200) 163 167
(250,250) 125 155
(300,300) 75 136
(400,400) 4 76
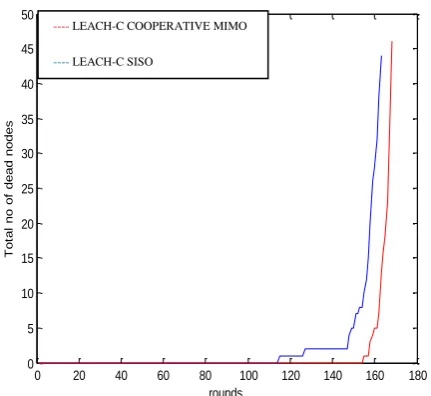
Fig 5: Round Vs total no of dead node at BS (50, 50)
0 20 40 60 80 100 120 140 160 180 200 55
60 65 70 75 80 85 90 95 100
rounds
T
o
ta
l
n
o
o
f
a
li
v
e
n
o
d
e
0 20 40 60 80 100 120 140 160 180 200
0 5 10 15 20 25 30 35 40 45
rounds
T
o
ta
l
n
o
o
f
d
e
a
d
n
o
d
e
---- LEACH-C COOPERATIVE MIMO
---- LEACH-C SISO
---- LEACH-C COOPERATIVE MIMO
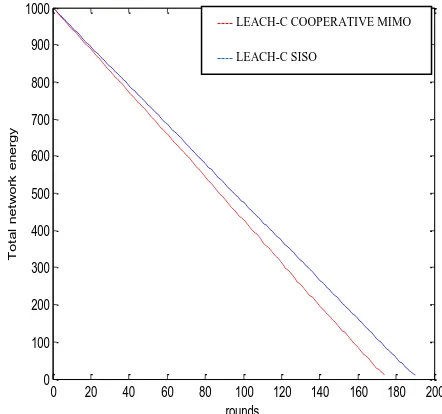
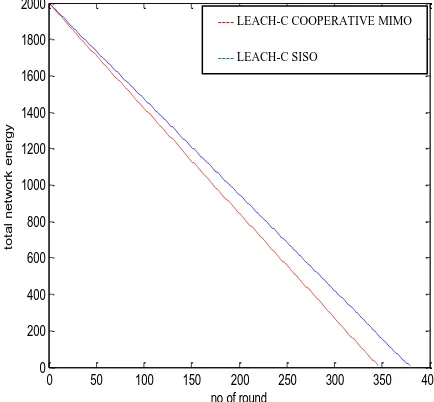
Fig 6: Round Vs total network energy at BS (50, 50)
Fig 7: Round Vs total no of alive node at BS (100,100)
Fig 8: Round Vs total no of dead node at BS (100,100)
Fig 9: Round Vs total network energy at BS (100,100)
Fig 10: Round Vs total no of alive node at BS (200,200)
0 20 40 60 80 100 120 140 160 180
0 100 200 300 400 500 600 700 800 900 1000
rounds
T
o
ta
l
n
e
tw
o
rk
e
n
e
rg
y
0 20 40 60 80 100 120 140 160 180 200
60 65 70 75 80 85 90 95 100
rounds
T
o
ta
l
n
o
o
f
a
li
v
e
n
o
d
e
0 20 40 60 80 100 120 140 160 180 200
0 5 10 15 20 25 30 35 40
rounds
T
o
ta
l
n
o
o
f
d
e
a
d
n
o
d
e
0 20 40 60 80 100 120 140 160 180 200
0 100 200 300 400 500 600 700 800 900 1000
rounds
T
o
ta
l
n
e
tw
o
rk
e
n
e
rg
y
0 20 40 60 80 100 120 140 160 180
50 55 60 65 70 75 80 85 90 95 100
rounds
T
o
ta
l
n
o
o
f
a
li
v
e
n
o
d
e
s
---- LEACH-C COOPERATIVE MIMO
---- LEACH-C SISO
---- LEACH-C COOPERATIVE MIMO
---- LEACH-C SISO
---- LEACH-C COOPERATIVE MIMO
---- LEACH-C SISO
---- LEACH-C COOPERATIVE MIMO
---- LEACH-C SISO
---- LEACH-C COOPERATIVE MIMO
45
[image:6.595.72.288.81.279.2]Fig 11: Round Vs total no of dead node at BS (200,200)
Fig 12: Round Vs total network energy at BS (200,200)
Fig 13: Round Vs total network energy at BS
(400,400)
Fig 14: Round Vs total no of dead node at BS (400, 400)
Fig 15: Round Vs total network energy at BS (400,400)
4.1.2Energy-20J
0 20 40 60 80 100 120 140 160 180
0 5 10 15 20 25 30 35 40 45 50
rounds
T
o
ta
l
n
o
o
f
d
e
a
d
n
o
d
e
s
0 20 40 60 80 100 120 140 160 180
0 100 200 300 400 500 600 700 800 900 1000
rounds
T
o
ta
l
n
e
tw
o
rk
e
n
e
rg
y
0 10 20 30 40 50 60 70 80
55 60 65 70 75 80 85 90 95 100
no of round
to
ta
l
n
o
o
f
a
li
v
e
n
o
d
e
0 10 20 30 40 50 60 70 80
0 5 10 15 20 25 30 35 40 45
no of round
to
ta
l
n
o
o
f
d
e
a
d
n
o
d
e
0 10 20 30 40 50 60 70 80
0 100 200 300 400 500 600 700 800 900 1000
no of round
to
ta
l
n
e
tw
o
rk
e
n
e
rg
y
---- LEACH-C COOPERATIVE MIMO
---- LEACH-C SISO
---- LEACH-C COOPERATIVE MIMO
---- LEACH-C SISO
---- LEACH-C COOPERATIVE MIMO
---- LEACH-C SISO
---- LEACH-C COOPERATIVE MIMO
---- LEACH-C SISO
---- LEACH-C COOPERATIVE MIMO
---- LEACH-C SISO
Fig 16: Round Vs total no of alive node at BS (50, 50)
[image:7.595.325.543.83.287.2]Fig 17: Round Vs total no of dead node at BS (50, 50)
Fig 19: Round Vs total network energy at BS (50, 50)
[image:7.595.62.283.541.733.2]Fig 20: Round Vs total no of alive node at BS (100,100)
Fig 21: Round Vs total no of dead node at BS (100,100)
Fig 22: Round Vs total network energy at BS (100,100)
0 50 100 150 200 250 300 350 400
60 65 70 75 80 85 90 95 100
no of round
to
ta
l
n
o
o
f
a
li
v
e
n
o
d
e
0 50 100 150 200 250 300 350 400
0 5 10 15 20 25 30 35 40
no of round
to
ta
l
n
o
o
f
d
e
a
d
n
o
d
e
0 50 100 150 200 250 300 350 400
0 200 400 600 800 1000 1200 1400 1600 1800 2000
no of round
to
ta
l
n
e
tw
o
rk
e
n
e
rg
y
0 50 100 150 200 250 300 350 400
60 65 70 75 80 85 90 95 100
no of round
to
ta
l
n
o
o
f
a
li
v
e
n
o
d
e
0 50 100 150 200 250 300 350 400
0 5 10 15 20 25 30 35 40
no of round
to
ta
l
n
o
o
f
d
e
a
d
n
o
d
e
0 50 100 150 200 250 300 350 400
0 200 400 600 800 1000 1200 1400 1600 1800 2000
no of round
to
ta
l
n
e
tw
o
rk
e
n
e
rg
y
---- LEACH-C COOPERATIVE MIMO
---- LEACH-C SISO
---- LEACH-C COOPERATIVE MIMO
---- LEACH-C SISO
---- LEACH-C COOPERATIVE MIMO
---- LEACH-C SISO
---- LEACH-C COOPERATIVE MIMO
---- LEACH-C SISO
---- LEACH-C COOPERATIVE MIMO
---- LEACH-C SISO
---- LEACH-C COOPERATIVE MIMO
[image:7.595.323.540.547.748.2]International Journal of Computer Applications (0975 – 8887) Volume 96– No.5, June 2014
Fig 23: Round Vs total no of alive node at BS (200,200)
Fig 24: Round Vs total no of dead node at BS (200, 200)
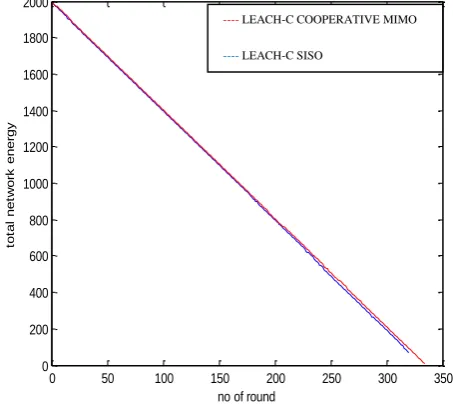
Fig 25: Round Vs total network energy at BS (200, 200)
Fig 26: Round Vs total no of alive node at BS (400,400)
Fig 27: Round Vs total no of alive node at BS(400 ,400)
Fig 28: Round Vs total network energy at BS (400, 400)
0 50 100 150 200 250 300 350
60 65 70 75 80 85 90 95 100
no of round
to
ta
l
n
o
o
f
a
li
v
e
n
o
d
e
0 50 100 150 200 250 300 350 400
0 5 10 15 20 25 30 35 40
no of round
to
ta
l
n
o
o
f
d
e
a
d
n
o
d
e
0 50 100 150 200 250 300 350
0 200 400 600 800 1000 1200 1400 1600 1800 2000
no of round
to
ta
l
n
e
tw
o
rk
e
n
e
rg
y
0 10 20 30 40 50 60 70 80
55 60 65 70 75 80 85 90 95 100
no of round
to
ta
l
n
o
o
f
a
li
v
e
n
o
d
e
0 10 20 30 40 50 60 70 80
0 5 10 15 20 25 30 35 40 45
no of round
to
ta
l
n
o
o
f
d
e
a
d
n
o
d
e
0 10 20 30 40 50 60 70 80
0 100 200 300 400 500 600 700 800 900 1000
no of round
to
ta
l
n
e
tw
o
rk
e
n
e
rg
y
---- LEACH-C COOPERATIVE MIMO
---- LEACH-C SISO
---- LEACH-C COOPERATIVE MIMO
---- LEACH-C SISO
---- LEACH-C SISO
---- LEACH-C COOPERATIVE MIMO
---- LEACH-C SISO
---- LEACH-C COOPERATIVE MIMO
---- LEACH-C SISO
---- LEACH-C COOPERATIVE MIMO
Table 2. Rounds at Different BS for 20J
Location of Base-Station
LEACH-C SISO
Cooperative MIMO
(50,50) 359 344
(100,100) 380 349
(150,150) 359 347
(200,200) 323 336
(250,250) 260 311
(300,300) 164 268
(400,400) 43 154
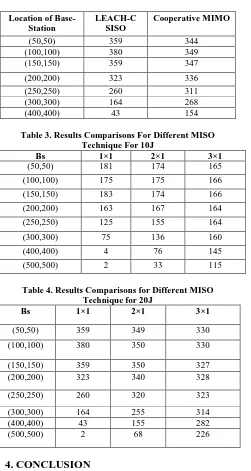
Table 3. Results Comparisons For Different MISO Technique For 10J
Bs 1×1 2×1 3×1
(50,50) 181 174 165
(100,100) 175 175 166
(150,150) 183 174 166
(200,200) 163 167 164
(250,250) 125 155 164
(300,300) 75 136 160
(400,400) 4 76 145
(500,500) 2 33 115
Table 4. Results Comparisons for Different MISO Technique for 20J
Bs 1×1 2×1 3×1
(50,50) 359 349 330
(100,100) 380 350 330
(150,150) 359 350 327
(200,200) 323 340 328
(250,250) 260 320 323
(300,300) 164 255 314
(400,400) 43 155 282
(500,500) 2 68 226
4. CONCLUSION
The traditional conviction is that MIMO system is not more energy efficient than SISO system in Rayleigh fading channel but from the results we have conclude that it is not necessary when both transmission and circuit consumption is considered. From table 2 and 3 it is concluded that for short range application specifically when base-station is inside or nearer to the sensor network area SISO system is better. From the table if number of rounds is compared for different base-station location it is shown that up to 150 m distance round of SISO system is outperforms the cooperative MIMO system but from 200 m distance rounds of cooperative MIMO system is suddenly increases for both 10J and 20J energy. Results are taken for different topologies for 10J and 20J energy.
In table 4 and 5 SISO system is compared with MISO 2×1 and 3×1 for 10J and 20J.from the results if numbers of rounds are compared for different systems at one particular base-station it is seen that round are decreasing because of intra-cluster cluster communication. As the numbers of cooperative nodes are increases in the system it consumes more energy in intra-cluster communication. If the rounds are compared at different base-station location as the distance increases the
numbers of rounds are decreases for one particular system because of the intra-cluster communication but it is up to some distance that is 150 m. After 200 m distance numbers of rounds are increases because transmission energy of the system is decreases, but at the same distance circuit energy consumption is constant. So, finally which MISO system should be selected and how many nodes are selected as cooperative node is depends on type of application, distance between base-station and sensor network area also it depends on the initial energy of the node and also on number of sensor nodes.
7. ACKNOWLEDGMENTS
Special thanks to my guide Prof. Jayesh Munjani for his guidance and encouragement in the development and preparation of this research work. His wise and convincing suggestions always help me out of the dead end in the research work and head to the right destination. He provides me basic ideas and techniques essential for carrying out this project.
8. REFERENCES
[1] S. Cui, A. J. Goldsmith, and A. Bahai, “Energy-efficiency of MIMO and Cooperative MIMO techniques in sensor networks,” IEEE J. Select. Areas. Commun. vol. 22, no. 6, pp. 1089-1098, Aug. 2004.
[2] M.Dohler, E. Lefranc, and H. Aghvami, “Space-time block codes for Virtual antenna arrays,”PIMRC, Lisbon, Portugal, September 2002.
[3] S.K. Jayaweera, “Virtual MIMO-Based Cooperative Communication for Energy-Constrained Wireless Sensor Networks”;IEEE Transactions on Wireless Communications, vol. 5, no. 5, pp. 984-989 May 2006.
[4] S. Cui, A. J. Goldsmith, and A. Bahai, “Modulation optimization under energy constraints,” Proc. IEEE Intl. Conf. Commun. (ICC 03), Alaska, USA, May 2003.
[5] George N. Bravos , Student Member, IEEE and Athanassios G. Kanatas, Senior Member, ”Energy efficiency of MIMO-based sensor networks with a cooperative node selection algorithm” IEEE Communications Society, ICC 2007.
[6] Pan Zhou, Wei Liu, KanruXu, “An Energy-efficient Multihop Cooperative Transmission Protocol Design for Sensor Networks”, 32nd IEEE Conference on Local Computer Networks, 2007.
[7] Qinghua Wang, YuguiQu, “An Effective organizing method for Wireless Sensor Networks based on MIMO”, IEEE, 2007.
[8] Siva D. Murganathan, Daniel C. F. MA, Rolly I. Bhasin, Abraham O. Fapojuwo, “A Centralized Energy – Efficient Routing Protocol for Wireless Sensor Networks”, IEEE Journal and Magazine, 2005, Volume: 43, PP 8-13.
[9] Shuguang Cui, Andrea J. Goldsmith, and Ahmad Bahai, Member, IEEE “Energy-constrained modulation optimization,” IEEE transactions on wireless communications, September, 2005