Journal of Chemical and Pharmaceutical Research, 2015, 7(5):606-629
Research Article
CODEN(USA) : JCPRC5
ISSN : 0975-7384
A stability indicating method development and validation for determination of
Methylphenidate Hydrochloride and its impurities in solid pharmaceutical
oral dosage form by RP-HPLC as per ICH guidelines
Ch. Naveen Kumar
1,2* and N. Kannappan
21
Bright Labs, Kothapet, Dilshuknagar, Hyderabad, Telangana, India
2Department of Pharmacy, Faculty of Engineering and Technology, Annamalainagar, Annamalai University,
Chidambaram, Tamilnadu, India
_____________________________________________________________________________________________
ABSTRACT
A simple, rapid, and precise, robust and rugged reverse phase high performance liquid chromatographic (RP-HPLC) method for analysis of Methylphenidate hydrochloride (MPH) and its Impurities in a tablet dosage form have been developed and validated. This method condition optimization was performed with HSSD waters symmetry C18 (100x 40 i.d., 3.7 µm particle column with Mobile phase Methanol: Acetonitrile: buffer (50:20:30v/v/v) and pH
adjusted 4.0 with acetic acid at a flow rate of 1.5 ml/min. The eluted compounds were detected and monitored at 210 nm for Methylphenidate Hydrochloride (MPH) assay and 203 nm for related substances (RS) by PDA detector. By this method Methylphenidate Hydrochloride (MPH), Imp-A, Imp-B were eluted with retention times of 3.162, 2.349, and 2.792 min, respectively. Validation revealed the method is accurate, precise, reliable, and reproducible. Calibration curve plots were linear over the concentration ranges 0.1-2.0 µg/mL for Impurities and for MPH 500-1500 µg/. Limits of detection (LOD) for MPH, Imp-A, Imp-B were 0.03, 0.04, and 0.04µg/ml and limits of quantification (LOQ) were 0.1, 0.1, 0.1 µg/mL respectively. The statistical analysis proves the method is suitable for the analysis of MPH, Imp-A, Imp-B in bulk and tablet dosage form without any interference from the excipients. It was also proved study for degradation kinetics of the drug in tablet dosage form. The developed method separated MPH from its two known and two unknown impurities within 6.0 min. Methylphenidate Hydrochloride(MPH) was subjected to the stress conditions of oxidative, acid, base, hydrolytic, thermal and photolytic degradation. MPH was found to degrade significantly in base stress condition, degrade slightly in oxidative stress condition and remain stable in acid, hydrolytic, thermal and photolytic degradation conditions. All impurities were well resolved from each other and from the main peak, showing the stability-indicating power of the method. The developed method was validated as per International Conference on Harmonization (ICH) guidelines.
Keywords: Methylphenidate Hydrochloride (MPH), Impurities, RP-HPLC, Stability Indicating, Method Development, Validation, ICH guidelines.
_____________________________________________________________________________________________
Methylphenidate Hydrochloride (MPH) is used for the treatment of attention deficit hyperactivity disorder (ADHD) and narcolepsy, the drug is a CNS stimulant and inhibits the reuptake of dopamine in the synapses [1, 2]. The use of MPH has increased considerably in recent years.
B) (2RS)-phenyl [(2RS)-piperidine-2-yl] acetic acid (IMP-A)
C) Methyl (2RS)-phenyl [(2SR)-piperidin-2yl] acetate (IMP-B)
Some research studies have theorized that ADHD is caused by a dopamine imbalance in the brains of those affected. Methylphenidate is a nor epinephrine and dopamine reuptake inhibitor, which means that it increases the level of the dopamine neurotransmitter in the brain by partially blocking the dopamine transporter (DAT) that removes dopamine from the synapses. This inhibition of DAT blocks the reuptake of dopamine and nor epinephrine into the pre synaptic neuron, increasing the amount of dopamine in the synapse. [7, 8]
Literature survey revealed that only few analytical methods like spectrophotometric, RP-HPLC and LCMS methods [9-11] Gas-chromatographic and gas-chromatographic-mass spectrometric procedures recently described for quantitation of methylphenidate and ritalinic acid [12-16] require relatively large sample volumes (2-5 mL of plasma or serum) have been reported for the determination of methylphenidate hydrochloride. All these methods are expensive, time consuming, complex in nature. Consequently, there is no stability indicating method reported in the presence of known impurities and also from the unknown degradation products hence, there was still a need to develop a simple, less time-consuming and economical stability indicating method for the determination of methylphenidate hydrochloride in pharmaceutical oral dosage forms. Therefore, the attempt was made to develop a fast and reproducible RP-HPLC method for the estimation Methylphenidate in API and pharmaceutical solid oral dosage form by following ICH method validation guidelines. In the present work, we developed a simple, precise, accurate, selective and robust liquid chromatographic method for the determination of Methylphenidate hydrochloride in API and in solid Dosage forms for routine quality control.
EXPERIMENTAL SECTION
Apparatus:
The analysis was performed using waters-2695(Model alliance) High Performance liquid chromatography waters auto sampler–PDA detector 996 by using, EmpowerTM-3S-software version-3,analytical balance (Mettler Toledo) UV/Visible-Detector (Standard cell) and data handling system (Autochrome-3000), pH meter (lab India), Sonicator. The column used is HDSS waters symmetry C18 (100x 40 i.d., 3.7 µm) particle column.
Materials and Reagents:
Selection of wavelength by UV-Spectroscopy:
The maximum absorbance of MPH and Impurity-A, Impurity-B were found to be 210 and 203 nm respectively from the UV Visible spectrophotometer results and the detector used in eluent monitoring HPLC is PDA detector.
Preparation of sodium acetate buffer solution:
Dissolve 1.62 gms of sodium acetate in 800 ml of HPLC grade water and adjust to the pH 4.0 with acetic acid and dilute with HPLC grade water up to 1000ml.the buffer was filtered through 0.45µ nylon membrane filter and degassed.
Preparation of Mobile Phase:
The mobile phase is consisted a mixture of methanol, acetonitrile, and buffer in the ratio of 50:20:30 (v/v/v), pH is adjusted to 4.0 with acetic acid and filtered through 0.22 µm nylon membrane filter.
Diluent preparation:
Mobile phase is used as diluents
System suitability solution preparation
Suitability solution is prepared by dissolving standard substances in diluent to obtain solution containing 1000 µg/mL of MPH, 1 µg/mL of Imp-A and 1 µg/mL of Imp-B.
Preparation of Placebo Solution:
Twenty tablets of placebo are crushed to fine powder. An accurately weighed portion of the powder equivalent to 25 mg of MPH is taken into 25 ml volumetric flask. About 20 ml of diluent is added to this volumetric flask and sonicated in an ultrasonic bath for 10 minutes. Dilute volume up to the mark and mixed well. It is then filtered through 0.22 µ m PVDF syringe filter and the filtrate is collected after discarding first few milliliters.
Preparation of standard solution:
Standard solution are prepared by dissolving the drug MPH working standard in diluent to attain the solution containing 1000 µg/mL for assay and 1µg/mL for related substances.
Preparation of Sample Solution (Assay):
Sample solution is prepared by dissolving sample Brand name Ritalin Tablets 10 mg Novartis (twenty tablets are crushed to fine powder by mortar and pestle) in diluent to obtain the solution that containing 1000 µg/mL of MPH (for assay and related substances). It was then filtered through 0.22 µm PVDF syringe filter and the filtrate is collected after discarding first few milliliters.
Assay of Pharmaceutical Formulation:
Calculated the the quantity, in mg, of MPH in the portion of solid oral pharmaceutical formulation using the following formula:
Assay (%w/w) =Cstdx Rs x 10,000 Cs x Rstd Where,
Cstd= Concentration of standard solution in mg/ml. Cs= Concentration of sample solution in mg/ml.
Rs= Compound peak response obtained from the sample preparation.
Rstd= Compound peak response (mean peak area) obtained from the standard preparation.
Percentage Impurity in Pharmaceutical Formulation:
For Calculating the % impurity present in the finished product formulation using the following formula:
Impurity (%w/w) = Cstdx Rs x 10,000x1 Cs x R std x RRF Where,
Cstd= Concentration of standard solution in mg/ml. Cs= Concentration of sample solution in mg/ml.
using the same proposed method and one more is the Intermediate precision is studied by other analyst, using different columns, different HPLC, and is performed on different days.
Specificity:
Specificity is the ability to assess unequivocally the analyte in the presence of some components which may be expected to be present. Typically these might include degradants, impurities, matrix, etc. Specificity was determined by injecting a blank, placebo and also standard solution. No interference should be seen at the retention time of an analyte. The specificity has to demonstrate by induced degradation of MPH formulation and placebo samples to acid degradation, alkali degradation, water degradation, peroxide degradation, thermal degradation, and U.V. degradation.
Accuracy (Recovery)
For the confirming the recovery of the proposed method, recovery related experiments are carried out by considering the special standard addition technique for assay(MPH) and impurities(Impurity-A, Impurity-B) by addition technique for related substances. The accuracy of the assay method for MPH is evaluated in triplicate (n=3) at the five concentrations of 500, 750, 1000, 1250 and 1500 µg/mL (50, 75, 100, 125 and 150 %) of the finished dosage form product, and the recovery is calculated for each added (externally spiked) concentration. The mean of percentage recoveries (n=15) and the relative standard deviation are calculated. For all impurities, the recovery is determined in triplicate (n=3) for 0.5, 0.75, 1.0, 1.25 and 1.5 µg/mL (50, 75, 100, 125 and 150 %) of the analyte concentration (1000 µg/mL) of the drug finished product, and the recovery of the impurities is calculated. The mean of percentage recoveries (n=15) and the relative standard deviation are also calculated for related substances.
Linearity
For related impurities or substances test, the linearity is demonstrated from the parameter LOQ (0.1 µg/mL) to 2.0 µg/mL of std concentration of Impurities using a minimum of eight to nine calibration levels (LOQ, 0.2, 0.4, 0.6, 0.8, 1.0, 1.2, 1.5 and 2.0 µg/mL) for Imp-A and Imp-B. For assay test, linearity is demonstrated from 50% to 150% of standard concentration using a minimum of seven calibration levels (500,700, 800, 1000, 1200, 1400 and 1500 µg/mL) for MPH. The method of linear regression is used for data evaluation. The peak areas of the standard compounds are plotted against the respective MPH, Impurity-A and Impurity-B concentrations. Linearity is described by the linearity equation, correlation coefficient and Y-intercept bias is also determined.
Limit of detection (LOD) and limit of quantification (LOQ):
The detection limit of an individual analytical procedure is the lowest amount of analyte in a sample which can be detected but not necessarily quantitated as an exact value. The quantitation limit of an individual analytical procedure is the lowest amount of analyte in a sample which can be quantitatively determined with suitable precision and accuracy. Calculated the LOD & LOQ, with the calculations obtained from evaluation of the calibration curve of the linearity.LOD and LOQ values are less than the minimum linearity concentration.
Robustness
The robustness it is a measure of the capacity of a method to remain unaffected by small but deliberate changes in flow rate (± 0.05 mL/min), change in column oven temperature (± 5 °C) and change in organic solvent ratio (± 10%). These all most important characteristic including % assays, resolution (between MPH and Impurity-A, Impurity-B), tailing factor, theoretical plate’s number and the retention behavior of the certain targeted compound are evaluated.
Solution stability
the fresh sample. The stability of standard solution is established by the storage of the standard solution at ambient temperature for 24h. The standard solution is re-injected after 12, 24 and 48 hrs % RSD is calculated.
Filter compatibility
Filter compatibility is majorly performed for nylon 0.25 µm syringe filter (Whatman sciences) and PVDF 0.25 µm syringe filter (Millipore). To confirm the filter compatibility in proposed analytical method, filtration recovery experiment is carried out by sample filtration technique. Need Sample is mainly filtered via both syringe filters and percentage purity assay is determined and compared to against centrifuged sample.
RESULTS AND DISCUSSION
Method Development and Optimization
Selection of chromatographic conditions and Optimization of Mobile Phase:
The main objective of the RP-HPLC method development is to rapid assay and related substances determination of MPH in pharmaceutical formulation and the method should be able to determine assay (ASY) and related substances (RS) in single run and should be accurate, reproducible, robust, stability indicating, filter compatible, linear, free of interference from blank / placebo / impurities / degradation products and straightforward enough for routine use in quality control laboratory.
The spiked solution of MPH (1000 µg/mL), Impurity-A (1 µg/mL) and Impurity-B (1 µg/mL) is subjected to separation by RP-HPLC. Initially the separation of all compounds is studied using water as a mobile phase-A (MP-A) and acetonitrile (ACN) as a mobile phase-B (MP-B) on a BES C18 (100x 40 i.d., 5 µm) using a Waters (HPLC)
system with the linear program. The flow rate of 1.5 mL/min is selected with regards to the backpressure and analysis time as well. Various types of MP-A and MP-B are studied to optimize the method, which are summarized with the associated observations in [Table 1].
Based on mobile phase selection experimental study, the optimized HPLC parameters are; flow rate1.5 mL/min; column oven temperature 20°C; mixture of water, ACN, MeOH and buffer in the ratio of 50:20:30: v/v/v respectively (pH adjusted 4.0 with Acetic acid). In order to achieve symmetrical peak shape of all substances and more resolution between MPH and Imp-B different stationary phases are explored. Peak merging (Imp-B and MPH) and broad peak shape of MPH is observed with an Acquity BHC C8 (100 x 2.1 mm, 4µ m) column. Poor resolution (Imp-B and MPH) and broad peak shape of MPH is observed with an Acquity BHC C18 (100 x 2.1 mm, 5 µ m) column.
Finally the desired separation with symmetrical peaks is obtained using HSSD waters symmetry C18 (100x 40 i.d.,
[Figure 3: Overlaid specimen chromatograms of blank, placebo, diluted standard and spiked impurities along with analyte (at 205nm)]
[Figure 4: Overlaid specimen chromatograms of assay study (at 230nm)]
Analytical Parameters and Validation
After satisfactory development of the method it is subjected to method validation as per ICH guideline [9]. The method is validated to demonstrate that it is suitable for its intended purpose by the standard procedure to evaluate adequate validation characteristics (system suitability, accuracy, precision, linearity, robustness, solution stability, filter compatibility and stability indicating capability).
Specificity
Specificity is the ability of the method to measure the analyte response in the presence of its potential impurities. Forced degradation studies are performed to demonstrate selectivity and stability indicating capability of the proposed RP-HPLC method. [Figure 2,3] are show that there is no any interferences at the RT (retention time) of MPH due to blank, placebo and impurities. Stress studies are performed at concentration of 1000 µg/mL of MPH to provide the stability indicating property and specificity of the proposed method. Spectral purity of MPH, Imp- A and Imp-B are presented in [Figure 5-7]
Forced degradation studies are performed by the stress conditions acid hydrolysis [1 N HCl (3 mL),60°C, 1h, Figure 8], base hydrolysis [1N NaOH (3 mL), 60°C, 30 min, Figure 9], oxidative [30% H2O2 (3 mL), 60°C, 1h, Figure 10], thermal [105°C, 6h, Figure 11], water hydrolysis [at 60 °C for 2h, Figure 12], and photolytic degradation [1.2 million Lux hours, Figure 13] to evaluate the ability of the proposed method to separate MPH from its degradation products. Minor degradation products are observed when MPH is subjected to acid, heat, photolytic and hydrolytic conditions.
calculated. The results from forced degradation study and Peak purity plots of all stress condition samples are presented in [Figures 5, 6, 7] and [Table 3].
[Figure 5: Spectral purity plots of MPH]
[Figure 6: Spectral purity plots of Impurity-A]
[Figure 8: Overlaid chromatograms of acid hydrolysis study]
[Figure 9: Overlaid chromatograms of base hydrolysis study]
[Figure 11: Overlaid chromatograms of heat degradation study]
[Figure 12: Overlaid chromatograms of hydrolytic degradation study]
[Figure 14: Base hydrolysis]
[Figure 15: Water hydrolysis]
[Figure 17: Acid Hydrolysis]
[Figure 18: Thermal] [Figure 19: Photolytic]
[Figure 14-19 are the Obtained spectral purity plots of MPH in forced Degradation study]
System suitability
The percentage RSD of area counts of six replicate injections is below 1.0 % .The parameters all complied with the acceptance criteria and system suitability is established. As seen from this data, the acceptable system suitability parameters would be: resolution between Imp-B and MPH is not less than 1.5, theoretical plates is not less than 5000, tailing factor for MPH is not more than 2.0. Specimen chromatogram of system suitability solution and diluted standard are presented in [Figure 20, 21] respectively and replicate in data [Table 4].
[Figure 20: Specimen chromatogram of system suitability solution]
Precision
[Figure 21: Specimen chromatogram of diluted standard solution]
[Figure 22: Overlaid chromatograms of replicate standard injection (at 230 nm)]
[Figure 24: Overlaid chromatograms of assay precision study (at 230 nm)]
[Figure 25: Overlaid chromatograms of related substance precision study (at 205 nm)] Accuracy
[Figure 27: Overlaid specimen chromatograms of accuracy study (related substances at 205 nm)]
Linearity:
The linearity of an analytical method is its ability to elicit test results that are directly proportional, or by a well-defined mathematical transformation to the concentration of analyte in a sample within a given range. The detector response linearity for Imp-A, Imp-B and MPH are assessed by injecting nine separately prepared solutions covering the range of LOQ (0.1 µg/mL) to 2.0 µ g/mL (LOQ, 0.2, 0.4, 0.6, 0.8, 1.0, 1.2, 1.5 and 2.0 µg/mL) of the normal analyte concentration (1µg/mL). For MPH assay the response function is determined by preparing standard solutions at seven different concentration levels ranging from 500 to 1500 µg/mL (500, 700, 800, 1000, 1200,1400 and 1500 µg/mL). The correlation coefficients, slopes and y-intercepts of the calibration curve are determined. The correlation coefficient obtained is greater than 0.999 in both cases. Overlaid specimen chromatograms of linearity study of assay and related substances are presented in [Figure 28, 28] respectively. Linearity graph of Imp-A, Imp-B, MPH (at 205nm) and MPH (at 230 nm) are presented in [Figure 28, 29] and [Table 7] respectively.
[Figure 29: Overlaid specimen chromatograms of linearity study (related substances)]
[Figure 30: Linearity curve of impurity-A]
[Figure 32: Linearity curve of MPH for RS at 203 nm]
[Figure 33: Linearity curve of MPH at 210 nm]
Limit of detection (LOD) and limit of quantification (LOQ)
The LOD and LOQ for MPH and its impurities are determined at a signal to noise ratio of 3:1 and10:1, respectively, by injecting a series of dilute solutions with known concentrations. Precision study is also carried out at the LOQ level by injecting six (n=6) individual preparation and calculating the % RSD of the area for each impurity and for MPH. The determined limit of detection, limit of quantification and precision at LOQ levels for MPH, Imp-A and Imp-B are presented .Specimen chromatogram of LOD [Figure 34] And LOQ study is presented in [Figure 36] and Overlaid chromatograms of LOD and LOQ precision study is presented in [Figure 37] and [Table 8].
[Figure 35: Overlaid spiked chromatograms of LOD precision study for IMP-A, IMP-B, andMPH]
[Figure 36: Spiked Specimen chromatogram of LOQ for IMP-A, IMP-B, andMPH]
[Figure 37: Spiked Overlaid chromatograms of LOQ precision study for IMP-A, IMP-B, andMPH]
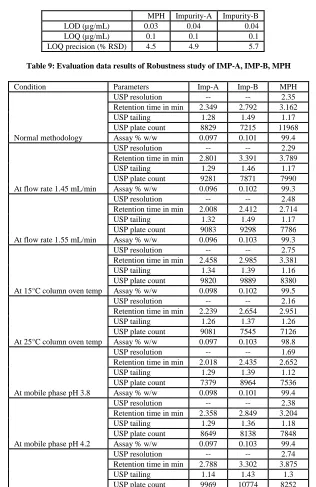
Robustness
[Figure 38: Specimen chromatograms of IMP-A, IMP-B, MPH robustness study (change in organic solvent ratio, ± 10%)]
[Figure 39: Specimen chromatograms of IMP-A, IMP-B, MPH robustness study (change in mobile phase pH)]
[Figure 41: Specimen chromatograms of IMP-A, IMP-B, MPH robustness study (flow rate variation)]
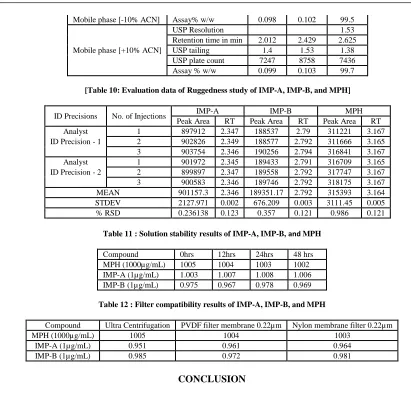
Ruggedness: The ruggedness can be evaluated by using different analysts but in the same chromatographic conditions in different laboratories and different instruments. The result of ruggedness of developed method is stated in table and the results are shown during by different analysts but in the same chromatographic condition of the test solution wasn’t affected & in the accordance with the actual. The suitability parameters are also been found to be good hence this method was concluded as rugged [Table 10].
Solution stability
[Figure 43: Overlaid specimen chromatograms of related substance sample solution stability]
Filter compatibility
Filter compatibility is performed for PVDF 0.22 µ m syringe filter (Millipore) and nylon 0.22 µ m syringe filter (Analytical Tech Labs). To confirm the filter compatibility in proposed analytical method, filtration recovery experiment is carried out by sample filtration technique. Sample is filtered through both syringe filters. Assay and related substances is determined (in µg/mL) and compared against centrifuged sample. The sample solution does not show any significant changes in assay and related substances with respect to centrifuged sample. Filter compatibility results are presented in which indicates that both syringe filters are compatible with sample solution. Overlaid specimen chromatograms of assay and related substance test (filter compatibility) are presented in [Figure 48, 49] & [Table 12], respectively.
[Figure 44: Overlaid specimen chromatograms of MPH assay filter compatibility study]
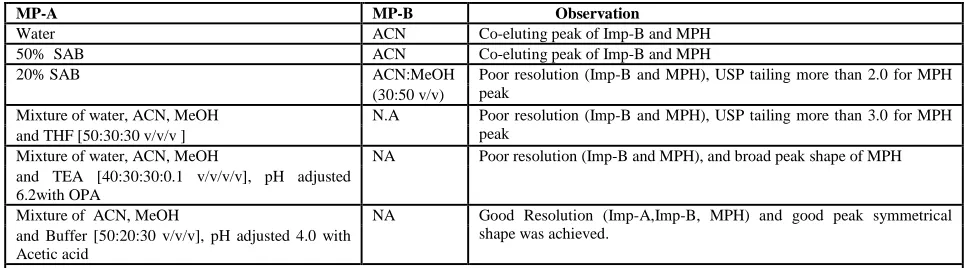
Table 1: Summary of mobile phase optimization Trails and its observations
MP-A MP-B Observation
Water ACN Co-eluting peak of Imp-B and MPH
50% SAB ACN Co-eluting peak of Imp-B and MPH
20% SAB ACN:MeOH Poor resolution (Imp-B and MPH), USP tailing more than 2.0 for MPH
peak (30:50 v/v)
Mixture of water, ACN, MeOH N.A Poor resolution (Imp-B and MPH), USP tailing more than 3.0 for MPH
peak and THF [50:30:30 v/v/v ]
Mixture of water, ACN, MeOH NA Poor resolution (Imp-B and MPH), and broad peak shape of MPH
and TEA [40:30:30:0.1 v/v/v/v], pH adjusted 6.2with OPA
Mixture of ACN, MeOH NA Good Resolution (Imp-A,Imp-B, MPH) and good peak symmetrical
shape was achieved. and Buffer [50:20:30 v/v/v], pH adjusted 4.0 with
Acetic acid
USP = United state pharmacopoeia; ACN=Acetonitrile,MeOH=Methanol;AA=Acetic Acid OPA= Orthophosphoric acid; THF=Tetrahydrofuran ,SAB=Sodium Acetate Buffer
Table 2: Optimized Chromatographic Conditions
Parameters Description
Stationary Phase( Column ) HSSD waters symmetry C18 ( 100x 40 i.d., 3.7 µm)
Mobile phase Methanol:Acetonitrile:buffer (50:20:30 v/v/v) and pH adjusted 4.0 with acetic acid
pH 4
Flow rate 1.5 ml min-1
Run time (minutes) 6
Column temperature 20 ± 10C
volume of Injection loop (µl) 20 µl
Detection wavelength 210 nm
Impurities & Drug RT (min) 2.349,2.792 & 3.168
Table 3: Summary of forced degradation results
Degradation condition Mass balance Purity
Angle Threshold Observation
Control sample 99.8 0.056 0.26 N.A.
Acidic hydrolysis 99.2 0.094 0.283 No degradation observed
Alkaline hydrolysis 98.5 0.129 0.328 Significant degradation observed
Oxidation 98.4 0.073 0.282 No significant degradation
Observed Water hydrolysis 99.5 0.056 0.25 No significant degradation
observed Thermal (solid) 100.1 0.054 0.26 No significant degradation
[image:21.595.127.484.528.643.2]Photolytic 100.2 0.056 0.26 No significant degradation observed
Table 4: System suitability results (system precision, method precision and intermediate precision)
Test Parameters
Imp-A Imp-B MPH MPH
(1µg/mL) (1µg/mL) (1000µg/mL) (1 µg/mL)
System Precision Area % RSD 0.8 0.9 0.9 0.3
Presicison(n=6) USP Resolution NA NA NA NA
USP tailing 1.34 1.52 1.12 1.19
USP plate count 8831 7219 11975 11994
Intermediate precision USP resolution NA NA NA NA
(n=6) USP tailing 1.34 1.52 1.12 1.19
USP plate count 8831 7219 11975 11994
[image:21.595.191.425.671.726.2]NA= Not applicable
Table 5: Precision (n=6) and Intermediate precision (n=6) results
Drug Substance Precisional Values Intermediate precision
Mean % % RSD Mean % % RSD
MPH (1000µg/mL) 99.3 0.9 99.5 1.1
Imp-A (1µg/mL) 0.098 2.4 0.101 2.3
MPH 500 to 1500 0.9999 y=28306(x)-4E+06 1.452
MPH 0.1 to 2.0 0.9995 y =9700.4(x) + 16526 0.366
Imp-A 0.1 to 2.0 0.9998 y =33041(x)-208.53 -0.635
Imp-B 0.1 to 2.0 0.9992 y =9016.5(x) +16153 1.886
Table 8: Results of LOD, LOQ and LOQ precision (n=6)
MPH Impurity-A Impurity-B
LOD (µg/mL) 0.03 0.04 0.04
LOQ (µg/mL) 0.1 0.1 0.1
[image:22.595.82.523.91.165.2]LOQ precision (% RSD) 4.5 4.9 5.7
Table 9: Evaluation data results of Robustness study of IMP-A, IMP-B, MPH
Condition Parameters Imp-A Imp-B MPH
USP resolution -- -- 2.35
Retention time in min 2.349 2.792 3.162
USP tailing 1.28 1.49 1.17
USP plate count 8829 7215 11968
Normal methodology Assay % w/w 0.097 0.101 99.4
USP resolution -- -- 2.29
Retention time in min 2.801 3.391 3.789
USP tailing 1.29 1.46 1.17
USP plate count 9281 7871 7990
At flow rate 1.45 mL/min Assay % w/w 0.096 0.102 99.3
USP resolution -- -- 2.48
Retention time in min 2.008 2.412 2.714
USP tailing 1.32 1.49 1.17
USP plate count 9083 9298 7786
At flow rate 1.55 mL/min Assay % w/w 0.096 0.103 99.3
USP resolution -- -- 2.75
Retention time in min 2.458 2.985 3.381
USP tailing 1.34 1.39 1.16
USP plate count 9820 9889 8380
At 15°C column oven temp Assay % w/w 0.098 0.102 99.5
USP resolution -- -- 2.16
Retention time in min 2.239 2.654 2.951
USP tailing 1.26 1.37 1.26
USP plate count 9081 7545 7126
At 25°C column oven temp Assay % w/w 0.097 0.103 98.8
USP resolution -- -- 1.69
Retention time in min 2.018 2.435 2.652
USP tailing 1.29 1.39 1.12
USP plate count 7379 8964 7536
At mobile phase pH 3.8 Assay % w/w 0.098 0.101 99.4
USP resolution -- -- 2.38
Retention time in min 2.358 2.849 3.204
USP tailing 1.29 1.36 1.18
USP plate count 8649 8138 7848
At mobile phase pH 4.2 Assay % w/w 0.097 0.103 99.4
USP resolution -- -- 2.74
Retention time in min 2.788 3.302 3.875
USP tailing 1.14 1.43 1.3
[image:22.595.153.469.278.765.2]Mobile phase [-10% ACN] Assay% w/w 0.098 0.102 99.5
Mobile phase [+10% ACN]
USP Resolution 1.53
Retention time in min 2.012 2.429 2.625
USP tailing 1.4 1.53 1.38
USP plate count 7247 8758 7436
Assay % w/w 0.099 0.103 99.7
[Table 10: Evaluation data of Ruggedness study of IMP-A, IMP-B, and MPH]
ID Precisions No. of Injections IMP-A IMP-B MPH
Peak Area RT Peak Area RT Peak Area RT
Analyst 1 897912 2.347 188537 2.79 311221 3.167
ID Precision - 1 2 902826 2.349 188577 2.792 311666 3.165
3 903754 2.346 190256 2.794 316841 3.167
Analyst 1 901972 2.345 189433 2.791 316709 3.165
ID Precision - 2 2 899897 2.347 189558 2.792 317747 3.167
3 900583 2.346 189746 2.792 318175 3.167
MEAN 901157.3 2.346 189351.17 2.792 315393 3.164
STDEV 2127.971 0.002 676.209 0.003 3111.45 0.005
[image:23.595.94.505.57.451.2]% RSD 0.236138 0.123 0.357 0.121 0.986 0.121
Table 11 : Solution stability results of IMP-A, IMP-B, and MPH
Compound 0hrs 12hrs 24hrs 48 hrs
MPH (1000µg/mL) 1005 1004 1003 1002
IMP-A (1µg/mL) 1.003 1.007 1.008 1.006
[image:23.595.161.472.72.134.2]IMP-B (1µg/mL) 0.975 0.967 0.978 0.969
Table 12 : Filter compatibility results of IMP-A, IMP-B, andMPH
Compound Ultra Centrifugation PVDF filter membrane 0.22µm Nylon membrane filter 0.22µm
MPH (1000µg/mL) 1005 1004 1003
IMP-A (1µg/mL) 0.951 0.961 0.964
IMP-B (1µg/mL) 0.985 0.972 0.981
CONCLUSION
The rapid isocratic RP-HPLC method is developed for quantitative and related substances analysis of MPH in pharmaceutical formulation. Satisfactory results are obtained from validation of the method. The run time (6 min) enabled rapid determination of MPH. This method exhibited an excellent performance in terms of sensitivity and speed. This stability-indicating method can be applied for the routine analysis of production samples and to check the stability of MPH in bulk drug and formulation. Moreover, it can be applied for determination of assay, blend uniformity, content uniformity and in vitro dissolutions of pharmaceutical products, where sample load is higher and high throughput is essential for faster delivery of results
Acknowledgements
The author wish to acknowledge the Bright Labs and KDPL Pharmaceuticals,Hderabad for providing gratis samples of Impurities and infrastructural facility to carry out this work and also special thanks to my mentor Dr.N.Kannappan for his excellent advise on this work.
REFERENCES
[1] B Hechman; B Greenfield. J.Expert Rev Neurother., 2005, 5(2), 107-121.
[2] BE Leonard; MC Cartan; DJ White; DJ King. J. Human Psychology., 2004, 19,151-80. [3]. A Gilmore; R Milne. J .Pharmaco Drug Saf., 2001, 10(2), 85–94.
[4] TF Mott; L Leach; L Johnson. J.of Family Practice., 2004, 53(8): 659–61. [5] BA Faraj; ZH Israeli; JM Perel. J.Pharmaco Exp Ther., 1974, 23(6) 191-199. [6] MF Bartlett; HP Egger. Academic J. Exp Biol., 1972, 31(4), 537.
[7] PK Capp; PL Pearl. J.Rev Neurother., 2005, 5(3): 325–31.