WIRELESS INDOOR MIMO CHANNEL PROPAGATION
PREDICTION BASED ON A 3-D RAY TRACING TECHNIQUE
1MOHD NAZRUL HANIF NORDIN, 2ROSDIADEE NORDIN
1,2Faculty of Engineering & Built Environment, Universiti Kebangsaan Malaysia, Bangi 43600, Selangor,
MALAYSIA
E-mail: [email protected], [email protected]
ABSTRACT
This paper presents a wireless Multiple Input Multiple Output (MIMO) radio wave propagation prediction technique based on the results generated from the software package known as the Site Specific Indoor Propagation Prediction. This study is motivated by the proposed IEEE 802.11ac standard, which supports MIMO spatial streams and is expected to be introduced sometime in early 2014. The results presented here are based on 2×2 MIMO antenna configurations. The indoor MIMO channel measurement is based on the propagation environment at Level 3, the administration building of the Faculty of Engineering & Built Environment (FEBE) at the Universiti Kebangsaan Malaysia (UKM). The operating frequencies considered in this study are the 2.4 GHz and 5 GHz frequency bands, which are representative of the proposed 802.11ac standard. In addition, measurements of on-site activity levels are presented. All of the simulation and visualization results are analyzed to measure the spatial correlation among the MIMO antennas (to reduce the effect of MIMO spatial interference), power delay profile, predicted path loss, power density, and ray paths, as well as the predicted signal strength and signal coverage. Comparisons are carried out with different frequencies and locations in the building. The results indicate that the 3-D ray tracing technique is able to predict the propagation characteristics of the MIMO wireless channel in an indoor environment. It is also found that the minimum spacing between the MIMO antenna elements should be at least 0.8λ as a practical design consideration
Keywords: Channel Model, Indoor Propagation Prediction, Multiple Input Multiple Output (MIMO), 3-D Ray Tracing, Wireless,
1. INTRODUCTION
Designing a wireless system for an indoor environment is a major challenge and can be considered a 'Black Art' [1]. There are many factors that influence the propagation characteristics of indoor wireless channels. One of these factors is the antenna location. The MIMO transmission scheme generally consists of a combination of multiple antennas at both the transmitter and receiver. MIMO schemes have the potential to increase capacity in rich environments, including both outdoor and indoor propagation environments. This study was conducted to predict the propagation of radio waves in a closed indoor communication environment motivated by the proposed 802.11ac technical standards. This simulation was performed using a ray tracing software package, Site Specific Outdoor/Indoor Propagation Prediction Code, provided by Site Ware Technologies [2].
1.1 Problem Statement
The aim of this research is to predict the radio wave propagation for a MIMO system in an indoor environment. The Administration Building of the Faculty of Engineering & Built Environment (FEBE) in UKM is used as a representative indoor environment. The propagation inside the building is treated as a single class, even though it may involve propagation over a single floor or propagation between floors. The selected measurement area is the third floor of the FEBE Administration Building. The third floor includes the lecturers'
rooms and is equipped with two WiFi
(IEEE802.11n) access points (APs). The location of the APs was also used as input parameters for the simulation.
The propagation prediction was conducted using a carrier frequency of 2.4 GHz Unlicensed Industrial, Scientific and Medical (ISM band) and 5 GHz Unlicensed National Information Infrastructure (UNII band), which is under consideration for the IEEE802.11ac standard [5]. For these two frequency bands, especially for indoor applications, the maximum distance may not be more than a few hundred meters due to the possibility that the signal will be diffracted, reflected or refracted, thus decreasing the received signal strength. The purpose of using the 2.4 GHz frequency band in this study is to investigate the propagation characteristics of existing wireless network systems under the IEEE 802.11n standard with 3D ray tracing techniques, while the 5 GHz frequency band is used to obtain the propagation characteristics to support the WiFi system based on the IEEE 802.11ac standard, which is new and still in the development phase (Draft 5.0) [5]. Therefore, a number of assumptions were made for the wireless network system environment with the MIMO antenna system. A study on MIMO antenna spacing using ray detection techniques was conducted.
The building dimensions (height, length, and width), interior configuration (such as interior wall and floor types) and receivers’ locations were measured to generate the results based on the ray tracing technique. The results are represented in an illustration and supported by in-depth analysis and discussion.
Part I in this paper briefly presented the background study of this research. Part II explains the methodology, while Part III describes the results and analysis and Part IV concludes the results from this study.
This study is divided into three phases. The first phase involved a site survey at the prediction area to gather and collect the information of the building and the APs. From the configuration of the building, the simulation and propagation prediction were performed using the ray tracing software as mentioned before. All of the input parameters were also measured in this phase.
The second phase involved using the site configuration and producing simulation results using MATLAB. The efficiency and coverage of a radio base station or transmitter at the prediction area are analyzed based on the correlation coefficient to quantify the effect of the MIMO spatial substream interference, power delay profiles, predicted path loss, power density and direction of the signal rays. The actual on-site signal strength measurement readings were taken using an application (inSSIDer), which is installed in a tablet (Samsung Galaxy Tab). There are two wireless APs included in the considered prediction area. Because the current APs are based on the 802.11xx standard, which is in the migration path toward the 802.11ac standard, both of the APs are assumed to be equipped with a MIMO antenna system in a 2×2 configuration.
In the third phase, an executable file and a Graphical User Interface (GUI) have been developed for visualization purposes to support the findings and analysis.
2.1 Building Floor Plan of Prediction Area Initially, information was gathered from the floor plan of the prediction area. Then, the floor plan of the building was studied in several aspects such as the position in a room, whether a partition is closed or open, the wall material type, ceiling and floor material type, and the height as well as width of each room partition. From the original floor plan, the simplified version of the floor plan has been built to facilitate the process of the building data extraction. The third floor has been chosen as the study area because it is a closely spaced area with approximately 93% indoor coverage area.
2.2 MIMO 2×2 Antenna System
substreams at a time. In addition, this study assumed that MIMO systems have power control and load control on the uplink, while they transmit at full power on the downlink. Figure 1 shows an overview of the MIMO systems considered in this study.
2.3 Database Preparation
The information concerning the building interior layout and structure was digitalized by creating the building database, building interior database and the database of receivers. These databases must be in a specific format as required by the simulation software.
2.4 Transmitter and Receiver Locations
The study has established two locations as transmitters (existing APs) to be used in the simulation, which are identified as location 1 (15,11) in our coordinate scheme and location 2 (39, 11) in our coordinate scheme. The locations of these access points are shown in Figure 2, with a total of 13 observation points within the measurement area. Three measurements were made for the received signal at each observation point. The three measurement readings were summarized as an average RSSI signal strength value before being compared with the simulation results.
3. RESULTS AND DISCUSSION
The output produced in this study can be divided into three parts, which are the (i) power & delay spread output, (ii) impulse response output, and (iii) information ray path output. From the power & delay spread, there are four more results generated related to the indoor wireless MIMO channel model, which include (i) the predicted path loss for the receiver, (ii) total power received, (iii)
root mean squared (RMS) delay spread, and (iv) mean excess delay.
3.1 MIMO Spacing Correlation
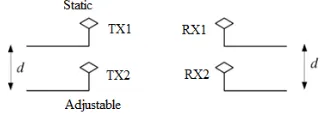
In the study of the space between the antennas, two transmitter antennas and two receivers were configured, as in Figure 3. The first antenna, labeled as TX1, is at a fixed position, while the second antenna, namely TX2, is assumed to vary. Simulation readings were gathered each time the
TX2 changed the spacing distance, d, allowing the
measurement of the effect of MIMO spacing. In the MIMO antenna system, the correlation coefficient is a parameter that represents the spatial correlation between the MIMO spatial substreams. When the correlation coefficient is lower in a specific position in the system, the channel capacity will be higher; inversely, higher correlation values will result in a degradation of channel capacity, which is similar to a SISO system. Therefore, this study was conducted to measure the correlation coefficient of the 2×2 MIMO antenna system. The correlation coefficient was calculated using the following formula [6]:
2 2 ) , ( ) , ( ) , ( ) , ( j j i i j i j i h h c h h c h h c h h ⋅ =
[image:3.612.312.511.72.243.2]ρ (1)
Figure 1: The considered SU-MIMO 2×2 system
0 10 20 30 40 50 60
0 5 10 15 20 25 30 13 12 11 10 9 8 x-coordinate 7 6 5 4 3 2 1 y -c oor di nat e
Access Point AP1 Access Point AP2 Observation Point
Figure 2: Location of the access points or transmitter and the observation points
[image:3.612.337.499.285.345.2]where, c(hi,hj) is the covariance between antenna,
) , (hi hi
c is standard deviation and hi is the received
[image:4.612.323.498.81.401.2]antenna power.
Figure 4 shows the correlation coefficient that is calculated using the formula as in Equation (1) at both the 2.4 GHz and 5 GHz frequency bands. ‘RT 2.4 GHz’ and ‘RT 5 GHz’ refer to the calculation results obtained using the Ray Tracing technique. ‘LIN 2.4 GHz’ and ‘LIN 5.2 GHz’ are the measurements taken from the linear model (from ref [7]) for comparison.
Figure 4 shows that the patterns are similar between the ‘RT’ and ‘LIN’ model. From the graph, the correlation coefficient between the TX1 and TX2 antennas at 2.4 GHz frequency are similar for both the Ray Tracing models and linear models. This result shows that the study of radio wave propagation in buildings using ray tracing produces similar results as previously published methods [7]. In addition, Figure 4 suggests that the correlation coefficient is lower when propagation occurs at a higher frequency.
This effect can be observed in the correlation coefficient at a frequency of 5 GHz, which is much less than the correlation coefficient at a frequency of 2.4 GHz. In theory, these results are in line with the concept of wavelength. When the frequency is high, the wavelength is shorter and the expected correlation coefficient is also lower. When the correlation coefficient is low, the MIMO capacity is expected to increase.
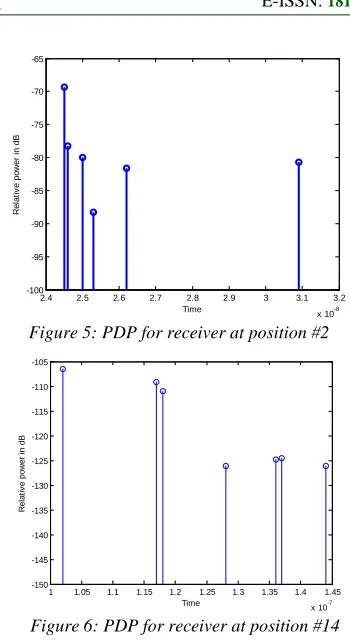
3.2 Power Delay Profile (PDP)
The two AP locations were simulated using a 3D ray tracing technique. The receiver is located at the corridor (coordinates 8,9) and in the lecturer's room (coordinates 41,9). In other words, one receiver is close to the MIMO transmitter and the other is far from the MIMO transmitter.
[image:4.612.97.298.119.290.2]Figure 5 displays the graph of PDP for observation point #2 at (8,9), while Figure 6 shows the graph of PDP of observation point #10 at location (41,9). The delay spread for observation point #2 (8,9) is 1.50 ns, while the delay spread for observation point #14 (41,9) is 8.79 ns. It should be noted that the multipath rays emitted from the center of the transmitter to the lecturer room experience the propagation phenomena of reflection, diffraction, scattering and refraction. These phenomena cause the rays to experience a delay before reaching the receiver. The receiver in the corridor only experiences negligible multipath phenomena or is dominated by LOS propagation, thus resulting in a shorter delay spread. Table I compares the delay spread based on several wireless environments based on reference [8] to validate the measurement on the delay spreads in the considered indoor location.
Table 1: Delay spread with different environments & frequencies
Environment Frequency (MHz) Delay Spread (σ)
Urban 892 10 to 25 µs
Rural 910 200 to 310 ns
Indoor 1500 10 to 50 ns
Figure 4: Correlation coefficient comparison
2.4 2.5 2.6 2.7 2.8 2.9 3 3.1 3.2
x 10-8 -100
-95 -90 -85 -80 -75 -70 -65
Time
R
el
at
iv
e pow
er
i
n dB
Figure 5: PDP for receiver at position #2
1 1.05 1.1 1.15 1.2 1.25 1.3 1.35 1.4 1.45
x 10-7 -150
-145 -140 -135 -130 -125 -120 -115 -110 -105
Time
R
el
at
iv
e pow
er
i
n dB
3.3 Simulation vs. Measurement
To understand the activity in the prediction area, it is important to collect signal propagation data. Thirteen receiver stations were established along the corridor in the third floor of the administration building as in Figure 2. Figure 7 shows a comparison of the RSSI from the simulation and actual measurements for access point AP1.
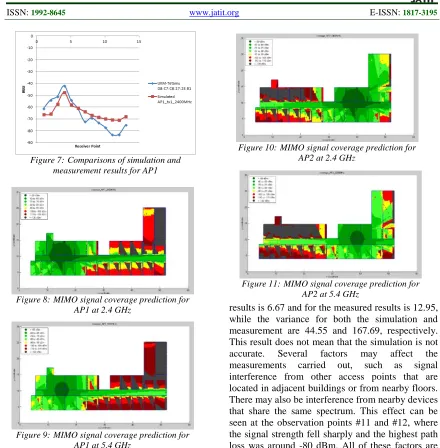
Figure 7 clearly shows a similar pattern between the simulation and the measured data. This result means that the 3-D ray tracing methods used in the MIMO multipath propagation simulation method is accurate. Comparisons between the simulation and measured results are almost the same in the range of -65 dBm. However, there are significant differences in the standard deviation and variance. The standard deviation for the simulation
results is 6.67 and for the measured results is 12.95, while the variance for both the simulation and measurement are 44.55 and 167.69, respectively. This result does not mean that the simulation is not accurate. Several factors may affect the measurements carried out, such as signal interference from other access points that are located in adjacent buildings or from nearby floors. There may also be interference from nearby devices that share the same spectrum. This effect can be seen at the observation points #11 and #12, where the signal strength fell sharply and the highest path loss was around -80 dBm. All of these factors are not taken into account in the simulation process.
3.4 Signal Coverage Prediction
Figure 8 shows the indoor MIMO signal coverage prediction for access point (AP1) using a 3D ray tracing technique at a frequency of 2.4 GHz, while Figure 9 shows the same results at a frequency of 5 GHz. Figure 8 and 9 show that the signal coverage in the frequency range of 2.4 GHz is better than the coverage at 5 GHz. The pattern of dark green is wider at 2.4 GHz frequency compared to the same green pattern in the 5 GHz range. This result is due to the longer wavelengths at 2.4 GHz, which are able to propagate farther than the 5 GHz wavelength. The result is consistent with the
wavelength formula, λ = c/f, where λ is the
[image:5.612.84.524.69.517.2]wavelength, c = 3× 10⁸ m/s, and f is the frequency
Figure 7:Comparisons of simulation and
measurement results for AP1
Figure 8:MIMO signal coverage prediction for
AP1 at 2.4 GHz
Figure 9:MIMO signal coverage prediction for
AP1 at 5.4 GHz
Figure 10:MIMO signal coverage prediction for
AP2 at 2.4 GHz
Figure 11:MIMO signal coverage prediction for
[image:5.612.93.300.69.526.2]wavelength will be.
The same pattern can be observed in Figure 10, which shows the MIMO signal coverage prediction for access point (AP2) using the 3D Ray Tracing Code at the 2.4 GHz frequency, while Figure 11 is at a frequency of 5 GHz. The second AP aims to support WiFi coverage on the right side of third floor. This is shown by the pattern of path loss, which is largely concentrated on the right side where AP1 is operated. Therefore, to provide almost 100% coverage on the third floor, two APs are required. However, the effect of signal interference between APs is ignored in this study.
4. CONCLUSIONS
The simulations that are performed in the 2.4 GHz and 5 GHz bands have shown that the ray tracing technique can predict indoor MIMO wireless propagation characteristics. This finding can be explained by the correlation coefficient results, and these results are very similar to the findings in the literature. From the correlation coefficients found between the two antennas, TX1 and TX2, the minimum spacing between the MIMO
antenna elements should be at least 0.8λ for
practical design consideration.
The simulation conducted at 5 GHz successfully predicted the signal coverage, which will be used in the future IEEE 802.11ac standard. Although this standard is still in the development stages, the simulation using ray tracing techniques is able to predict the signal strength, path loss, correlation coefficient, shape of the power delay profile and MIMO capacity. However, it should be emphasized that environmental factors, building materials, appliances and furniture, and propagation phenomena such as reflection, diffraction, scattering, etc. need to be considered and taken into account for accurate representation of the results.
Factors such as interference from other access points at the adjacent buildings or nearby floors of the building, as well as devices or electronic hardware, need to be included so that the results produced are more accurate.
5. ACKNOWLEDGEMENT
This work was supported by the Malaysia’s Ministry Of Science, Technology and Innovation, under the grant ref: 01-01-02-SF0788
[1] B. Nathan and C. Christon. 2007. Radio
Propagation and Adaptive Antennas for Wireless Communication Links: Terrestrial,
Atmospheric and Ionospheric. John Wiley &
Sons, 2007.
[2] G. Liang. User’s Manual for Site Specific
Outdoor/Indoor Propagation Prediction Code. Site Ware Technologies, Inc. 1999.
[3] R. Nordin, “An Investigation of
Self-Interference Reduction Strategy in a Spatially
Correlated MIMO Channel”, Journal of
Computer Networks and Communications, Feb
2012.
[4] D. Gesbert, M. Shafi, D. S. Shiu, P. J. Smith,
and A. Naguib. “From theory to practice: an overview of MIMO space-time coded wireless
systems,” IEEE Journal on Selected Areas in
Communications, 21(3): 281–302, 2003
[5] IEEE 802.11 Working Group. (18 Mei 2013).
Official IEEE 802.11 Working Group Project Timelines. [Online]. Available: http://grouper.ieee.org/groups/802/11/Reports/
802.11_Timelines.htm
[6] F. Andrea, D. Robert and N. Lajos. “Effect of
Antenna Space on MIMO Channel Capacity in
Practicable Antenna Structures”. Progress in
Electromagnetics Research Symposium
Proceedings. Moscow, Russia, August 2009.
[7] B.T. Maharaj, J.W Wallace, L.P Linde and
M.A Jensen. “Frequency Scaling of Spatial Correlation from Co-located 2.4 and 5.2 GHz Wideband Indoor MIMO Channel
Measurements”. Electronics Letters 41(6).
2005.
[8] V. Jeyasri. Mobile Communications. Technical
Publications. 2009.
[9] S. R. Theodore. Wireless Communications. 2nd
Edition. Prentice Hall, 2002.
[10]G. Andrea. Wireless Communications.
Cambridge University Press, 2005.
[11]B. Les. Propagation of Radiowaves. London:
The Institution of Electrical Engineers, 2003.
[12]B. Lucien. Radio Wave Propagation. London:
North Oxford Academic Publishers Ltd, 1987.
[13]T. George. MIMO System Technology for
Wireless Communications. The Electrical
[14]S. Simon and A. Alejandro. Antennas and Propagation for Wireless Communication
Systems. 2nd Edition. John Wiley & Sons,
2007.
[15]F. I. Magdy & Y. Zhengqing. Propagation
Prediction Models for Wireless
Communication Systems. IEEE Transaction on
Microwave Theory and Techniques 50(3):
662-673. 2002.
[16]G. Gesbert, H. Bolcsken, D. A. Gore & A. J.
Paulraj. Outdoor MIMO Wireless Channels:
Models and Performance Prediction. Asilomar
Conference on Signals, Systems, and
Computers. Pacific Grove, CA, October 2000.
[17]H. Tommy & M. Abbas. Suppression of EM
Fields using Active Control Algorithms and
MIMO Antenna System. Radio Engineering
13(3): 22-25. 2004.
[18]N. Lajos. Deterministic Indoor Wave