ISSN: 1992-8645 www.jatit.org E-ISSN: 1817-3195
A SOFTWARE QUALITY EVALUATION METHOD BASED
ON THE PRINCIPLE OF MAXIMUM COORDINATION AND
SUBORDINATION
1XINYU GENG, 1LI YANG, 2XIAOYAN HUANG
1School of Computer Science, Southwest Petroleum University, Chengdu, 610500, Sichuan, China 2School of Science, Southwest Petroleum University, Chengdu, 610500, Sichuan, China
ABSTRACT
Software quality evaluation is an important issue in software development. In this work, we investigate the characteristics of software quality and discuss the evaluation attributes of software quality. We then present existing commonly used software evaluation methods. For the limitations of the existing methods, we propose to apply the principle of maximum coordination and subordination to the software quality evaluation. Our method achieves relatively good results in experiment validation.
Keywords: Software Quality Evaluation, Evaluation Attributes, Principle of Maximum Coordination and Subordination
1. INTRODUCTION
Software quality is an important issue throughout the software life cycle, which is a complex combination of various characteristics. To quantitatively evaluate its quality, it is necessary to consider the characteristics of software in its development and maintenance process. However, in realistic scenarios, each observation object has multiple characteristics, making the classification difficult. Moreover, a software quality evaluation system itself is complex with great uncertainties, and its characteristics are hard to quantify, thus it is usually difficult to reflect the completeness and accuracy of the quality evaluation. Therefore, there is a pressing need to build effective software quality evaluation methods.[1]
Boehm, McCall, ISO metric models are software industrial standards. Originating from these models, a lot of software quality evaluation methods have been developed. Commonly used methods include compliance method, pecking order method, and fuzzy comprehensive evaluation method. All these methods have their specific limitations. Compliance method requires software to qualify all the requirements, so it is clear that this approach is relatively rough. Pecking order method is effective for comparing different software qualities but it cannot make a quantitative evaluation of individual software. Fuzzy comprehensive evaluation method completely relies on the experience of experts,
resulting in a lack of necessary accuracy. To address these limitations, we present a software quality evaluation method based on the principle of maximum coordination and subordination. Simulation results show that the proposed method achieves reliable and accurate evaluation of software quality. [2]
2. THE ESTABLISHMENT OF SOFTWARE QUALITY EVALUATION
2.1 Software Quality Characteristics Analysis
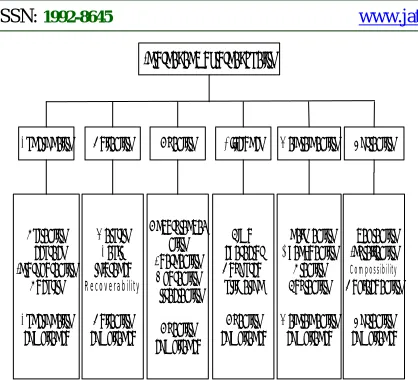
ISO/IEC 9126 standard is the commonly used international standard on software metrics and software quality evaluation. ISO/IEC 9126 standard contains four parts: software quality model, external metrics, internal metrics, and quality metrics in use. ISO/IEC 9126 - Part1 (software quality model) has been officially published, and the other three are still in development.
Internal and external quality
Functionality Reliability Usability Efficiency Maintainability Portability
Suitability Accuracy Interoperability
Security
Functionality compliance
Maturity Fault-tolerance
Recoverability
Reliability compliance
Understanda_ bility Learnability Operability Attractability
Usability compliance
Time-character Resource- utilization
Usability compliance
Analyzability Changeability Stability Testability
Maintainability compliance
Adaptability Installability Compossibility Replaceability
[image:2.612.94.303.73.267.2]Portability compliance
Figure 1: Software Quality Evaluation
Each quality characteristics can be represented by certain sub-characteristics. For example, the sub-characteristics of reliability include error tolerance, easy recovery, and reliability compliance. Each sub-characteristic contains some relevant metrics. Characteristics, sub-characteristics, and metrics constitute a software quality model.
ISO/IEC 9126 standard has detailed descriptions and classifications about the software characteristics and sub-characteristics, which have been widely used. ISO/IEC 9126 standard provides users with multiple perspectives to analyze and evaluate the quality of the software. Metrics defined in the ISO/IEC 9126 standard: the measurement method and the measurement standard, is a relatively general concept. For a more straightforward and more operable evaluation, the above metrics can be broken down into the indicators and data items to construct a software quality evaluation system. Each indicator contains n data items (n >= 1), with each item collected in the software testing process. Substituting the value of these data items into the indicator formula, one can obtain the value of this indicator.[3]
2.2 Software Quality Evaluation Analysis
The top-down breaking-down of the system is a software quality measurement process. The bottom-up putting-together of the system is a software quality evaluation process. The details are given below:
(1) Acquire the values of the data item in the software testing process.
(2) Substitute the values of the data items into the indicator calculation formula to obtain the value of the indicator;
(3) Evaluate the quality of the indicators based on their values;
(4) Determine the quality of the sub-characteristics according to the relationship between the sub-characteristic and their indicators;
(5) Determine the quality of the characteristic according to the relationship between the characteristics and their sub-characteristics;
(6) Obtain the quality of the software by synthesizing the quality of its quality characteristics.
Through the above process, quality indicator system solves the metric problem. However, to achieve bottom-up software quality evaluation, one should also know how to evaluate the indicators and how to establish the relationship between sub- characteristics and indicators (characteristics and sub-characteristics). In other words, one should solve the problem of the evaluation standards and the problem of comprehensive evaluation of multiple characteristics. The principle of maximum coordination and subordination can effectively solve these two problems.[4,5]
3. OVERVIEW OF SOFTWARE QUALITY EVALUATION METHODS
Currently, the common software quality assessment methods are: sensitivity analysis, gray system theory, fuzzy comprehensive evaluation method, hierarchical analysis process, stochastic simulation, and artificial neural network method.
3.1 Sensitivity Analysis Method
Out of the many uncertainties affecting the final decision, the sensitivity analysis method finds the factors that have an important impact on the target by measuring and analyzing the objective’s sensitivity in response to one or more factor changes. Therefore, this method can determine the importance of each factor to the objective, and serve as an analytical tool to evaluate and determine the objective’s risk tolerance.
3.2 Gray System Theory
ISSN: 1992-8645 www.jatit.org E-ISSN: 1817-3195
3.3 Fuzzy Comprehensive Evaluation Method
The fuzzy comprehensive evaluation method utilizes the fuzzy relationship between objectives in fuzzy mathematics to make decision on the objectives that are affected by multiple factors. This method transforms the evaluation from qualitative to quantitative measurements, while its evaluation results are not absolutely yes or no. Fuzzy comprehensive evaluation method effectively addresses the problems that contain multiple uncertain factors, and are poorly-defined.
3.4 Analytic Hierarchy Process
Analytic hierarchy process (AHP) treats a complex decision-making problem with multiple objectives as a system. It divides the objective to individual objectives or principle, and then calculates the ranking by qualitative fuzzy quantification method. AHP classifies the decision making problem into a ranked structure according to the overall objective, sub-objective, evaluation principles and detailed alternative plans. It then solves for the eigenvectors to obtain the priority weights of the elements in one rank to its upper-level rank, then it uses weighted sum of the alternative plans to obtain the final weights to the overall objective. The maximum of the final weight is the best plan. Here the so-called “priority weights” are a relative measurement. They indicate the relative measurement of the evaluation principle and sub-objective of the alternative plans, as well as the relative measurements of the sub-objective’s importance to its upper-level objective. AHP is suitable for the objective system with hierarchy and interactive evaluation standards with objective values hard to quantity. The use it to construct judging matrix, and to get its maximum characteristic values and its corresponding characteristic vector W. After normalizing, it is the relative importance value of one standard on one rank with respect to upper-level standard.
3.5 Stochastic Simulation
Stochastic simulation is also known as the Monte Carlo simulation. When the real problems or research objects do not have a mathematical model of accurate solutions but show the characteristics of probability and statistics, we can build for them an associated probability model or stochastic processes, obtain the sampling results through simulation, and assign the arithmetic mean of the results as the numerical solution of the real problems. With the increase in the number of simulations and the gradual improvement in the
estimation accuracy of parameters, the numerical solution can be obtained.
3.6 Artificial Neural Network Method
The artificial neural network is an important branch of the field of artificial intelligence. It is to simulate different degrees and different levels of brain information processing mechanisms and to learn about their structure and characteristics of the neurons in the human brain. Neural network is computation model, which is composed with a large number of nodes (and neurons) and there interconnection. Each node represents a specific output function, which is called activation function. The connection between each two nodes represents a weighting value for the connection signal, which is called weight. This is equivalent to the memory of artificial neural network. The network output then depends on the connection modes of the network, varying with the weighting values and activation function. The networks itself is usually analogous to a certain algorithm or function in nature, and can also be an expression of a certain logic strategy.
4. THE PRINCIPLE OF MAXIMUM
COORDINATION AND SUBORDINATION
Let A=(A A1, 2,,An)
be a fuzzy sets of the
domain X, A jj( =1,, )n be n fuzzy subsets of X,
( 1, , )
i
X ∈X i= t ,the membership vector of Xi
with respect to the fuzzy set A is Bi
1 2
( , , , )
i i i in
B = b b b i=1,,n (1) Meanwhile, we assume that in domain X there are n such elements 0
( 1, , )
j
x j= n , then its membership vectors Bj0are
0 0 0 0
1 2
( , , , )
j j j jn
B = b b b
where
0 1 j
0 j
jk
k b
k =
= ≠
i f
i f (2)
In other words, Xj0 ’s membership is 1 with respect to the fuzzy subset A, and is 0 to other fuzzy subsets. Evidently, 0
j
X fully belongs to Aj 。
To identifyxi0(i=1,, )t ’s membership, we first calculate the association degree rij between the membership vectors Bi ( i=1,,t ) and 0
j
1
1
( ) n
ij ij
k
r k
n = ξ
=
∑
(i=1,, )n (3)where
min min ( ) max max ( )
( )
( ) max max ( )
ij ij
i k i k
ij
ij ij
i k
k k
k
k k
ρ ξ
ρ
∆ + ∆
=
∆ + ∆ (4)
0
( )
ij k bjk bjk
∆ = − (5) The principle of maximum coordination and subordination indicates that:
If there exists Sϵ{i=1 ,…, n}, and
{
1 2}
max , , ,
is i i in
r = r r r (6) then xibelongs toAs
.
If the importance and influences of multiple factors on decision making are different, one can use weights on the association factors to obtain weighted association degree rijw, i.e.,
1 2
1
(1)
(2)
( ) ( , , , )
( ) ij
n
ij T
ijw k ij n
k
ij
r a k a a a A
n ξ ξ ξ
ξ
=
= = = ⋅ ∑
∑
where, ∑ is the association vector, A is the weighting matrix, A=( ,a a1 2,,an)which satisfies
1
1 n
i i
a
=
=
∑
The weighting matrix A can be obtained by fuzzy analytic hierarchy process (AHP).
Here, if Sϵ{i=1,…,n}, and
1 2
max( , , , )
isw i w i w inw
r = r r r then
i
x belongs toAs
According to the principle of maximum coordination and subordination, if the membership vector Bi of xi has the largest or association degree ris or the largest weighted association degree risw with the membership vector Bs0 of the elements 0
s
x that fully belongs to As
. Compared
with the maximum subordination principle, principle of maximum coordination and subordination has the following features,
(1) According to the principle of maximum coordination and subordination, the non-largest components in the membership vectors provides effective information, so that the results are affected by the magnitude of the non-largest components. While in the maximum subordination principle, once the maximum membership component is
obtained, the non-largest components have no effect in the results.
(2) The principle of maximum coordination and subordination calculates association degree between the membership vectors Biof elements xi
and n membership vector 0
j
B (j=1,, )n that belongs to n various reference elements. The attribution of xi is determined based on maximum association degree. Therefore, it can fully utilize the information of the components of the membership vectors, and can avoid incorrect conclusions.
(3) By adding the weighed association degrees, it can be applied to meet the requirement of application, and is more reasonable and effective.
5. EXAMPLE
Because some factors that affect the software quality are vague and subjective, people’s opinions toward them may differ and it is hard to use statistical methods to quantify these values. Therefore, it is important to quantify and compressively evaluate the fuzzy information. In software quality evaluation, the selection of evaluation parameters is very important, which requires:
(1) good correlation of the evaluation parameters and software quality
(2) discrete distribution of evaluation parameters (3) large number of evaluation parameters
Therefore, generally selected factor set X={functionality, reliability, usability, efficiency, maintainability}. Evaluation set B={excellent, good, fair, poor}
Using single factor judge, the fuzzy relationship matrix R can be obtained. Then weighting set A is used based on their relative importance (
~ ~ ~
B=A R ). B is the overall evaluation results. Based on the principle of maximum coordination and subordination
1 2
max( , , , )
isw i w i w inw
r = r r r it can determine the quality of the software.
ISSN: 1992-8645 www.jatit.org E-ISSN: 1817-3195 Table 1 Evaluation Result
evaluation excellent good fair poor maximum coordination
maximum coordination and subordination
Actual evaluation by the company 1 0.76 0.12 0.08 0.04 excellent excellent excellent 2 0.41 0.45 0.11 0 good excellent excellent 3 0.21 0.32 0.45 0.02 fair fair excellent 4 0.05 0.13 0.24 .058 poor poor poor 5 0.07 0.35 0.32 0.26 good fair fair 6 0.23 0.44 0.22 0.11 good good good 7 0.46 0.34 0.11 0.09 excellent excellent excellent
From the results shown in this table, our approach obtained similar results with those obtained by the company. It shows that this evolution is reliable. Especially for the second and the fifth software, since their association degree to two indicators is relatively large, misleading evaluation would be made by maximum subordination principle. While using maximum coordination and subordination principle gave reasonable results.
6. CONCLUSION
Software quality evaluation is a complicated problem. Typical methods are likely to give incorrect conclusion for the problems with similar results. Maximum coordination and subordination principle can integrate multiple factors in the evaluation and avoid the artifact. Example shows that this method is reliable and worthwhile for wide applications.
REFERENCES:
[1] J. C. Munson, T. M. Khoshgoftaar, “Regression modeling of software quality: an empincal investigation”, Information and Software Technology, Vol. 32, No. 2, 1990, pp. 106-114. [2] T. M. Khoshgoftaar, Y. Liu, “Multiobjective
module-order model for software quality enhancement”, IEEE Transactions on Evolutionary Computation, Vol. 8, No. 6, 2004, pp. 593-608.
[3] B. Gupta, M. P. Singh, “Estimation of software reliability with execution time model usingthe pattern mapping technique of artificial neural network”, Computer and Operations research, Vol. 32, No. 1, 2005, pp. 187-199.
[4] K. Y. Cai, W. D. Wang, Z. Y. Yu, D. Zhang, “On the neural network approach in software reliability modeling”, Systems and Software, Vol. 58 , No. 1, 2001, pp. 47-62.
[5] L. Tian, A. Noore,
“
Evolutionary neural modeling for software cumulative failure timeprediction”, Reliability Engineering andSystem Safety, Vol. 87, No. 1, 2005, pp. 45-51.
[6] L. Tian,A. Noore, “On-line prediction of software reliability using an evolutionary connectionistmodel”, Systems and Software, Vol. 77, No. 2, 2005, pp. 173-180.
[7] S. L. Ho, M. xie, T. N. Goh, “A study of connectionist models for software reliability prediction”, Computers and mathematics with appluications,Vol.46,No.7,2003,pp. 1037-1045.
[8] W. Pedrycz, J.F.Peters, “Software quality measurement: concepts and fuzzyneural relational model”,Proceedings of International Conference on Fuzzy Systems, IEEE Conference Publishing Services, May 4-9, 1998, PP. 1026-1031.
[9] K. K. Aggarwal, Yogesh Singh, Pravin Chandra, Manimala Puri, “Evaluation of vatious trainingalgorithms in a neutral network model for software engineering applications”, ACM sigsoft softwrare engineering notes, Vol. 30, No. 4, 2005, pp. 1-4.