Study of Performance Variation of AODV Routing
Protocol for Various Parameter Patterns using
Qualnet Simulator
Vaishali Sahu
M.Tech Student, MNNIT, AllahabadGaurav Sharma
M.Tech Student SHIATS, AllahabadRajeev Paulus
Assistant ProfessorECED, SHIATS
ABSTRACT
Ad-hoc On-demand Distance Vector (AODV) is a routing protocol used for Mobile Ad hoc Network (MANET). MANET is formed by mobile nodes connected by multi-hop wireless links without centralized access points or backbone network. Popularity of MANET has been increased because of the availability of license-free wireless communication devices. MANETs can be used for disaster-management, business meetings, military operations, rescue operations, or in a situation where temporary communication network among some nodes is demanded. Routing protocols used in fixed infrastructure networks cannot be efficiently used for mobile ad-hoc networks, so that MANET requires different protocols. This paper presents the analysis of performance of one of the routing protocols used in mobile ad-hoc networks (AODV) under various parameter-patterns with two path loss models, i.e. Two-ray and Free-space model.
Keywords
Mobile Ad-hoc networks, AODV, Packet Transmission rate, Node density, Pause time, Path loss propagation model, Free-space model and Two-ray model.
1.
INTRODUCTION
Today, in the era of Laptops, tablets, and mobile phones, there is often a requirement to set up a network to enable communication among some of these devices. For movable devices, a wireless network is often very suitable. Wireless networks can be with infrastructure, or without pre-specified infrastructure. Mobile Ad-hoc Network (MANET) is a temporary network that is designed for communication among mobile nodes, without any need for fixed or pre-specified infrastructure. Each node here itself works like a router. MANET can be used for disaster-management, business meetings, military operations, rescue operations, or in a situation, where temporary communication network among some nodes is demanded. In an ad-hoc network nodes are not familiar with the topology of the network, since all nodes are mobile, also topology of the network changes continuously. This change can be random with random velocity, or it can be uniform, depending upon the situation where network is operating. Nodes have to identify the topology of the network. A new node can introduce itself into a network by using the process of broadcast. A MANET can be used for both unicast and multicast type of communication. Protocols used in fixed infrastructure networks cannot be efficientlyused for mobile ad-hocnetworks, so that MANET requires
different protocol. There are various routing protocols used in mobile ad-hoc networks, as, AODV [1, 2, 3], DSR [4], FSR [8], OLSR [7], ZRP [9], TORA [6], DSDV [10] etc., we have discussed AODV [1, 2, 3] in section 2. This paper is divided into four sections: we have given the introduction in Section
1; Section 2 includes Protocol overview; Section 3 includes simulation setup. Section 4 includes results and discussion. Section 5 gives the conclusion and section 6 is about references.
2.
AODV ROUTING PROTOCOL
Ad-hoc on-demand Distance Vector Routing protocol is designed for wireless mobile ad-hoc networks.
AODV comes in the category of Reactive routing protocols. In reactive protocols routes are discovered and created on demand. The other category is proactive, in which each node has to maintain tables including the information about all the nodes in the network and periodical updates are necessary along with the updates about the change in the network topology. Periodic global broadcasting increases the control message and bandwidth requirements [1].
In AODV, nodes never participate in periodic global routing-table exchange. When a node wants to communicate to another node, then only it finds and maintains a route to that node. Nodes discover other nodes in its neighborhood by locally broadcasting a packet called Hello message [1] with Time-to-live value of 1, so that it cannot be rebroadcasted outside the neighborhood.
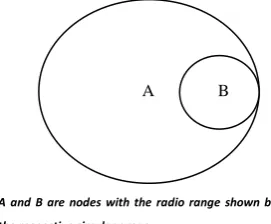
Symmetric links [1, 4] between neighbors are used in AODV. In Fig.1, node B is in the radio-range of node A, but node A is not in the radio-range of node B; then A can transmit to B but B cannot transmit to A; thus this link is not symmetric. To initiate the path discovery, the source node broadcast a RREQ (route request) [1, 4] packet to its neighbors. The RREQ packet contains the fields as: source-address, request id, destination-address, source sequence number, destination sequence number and hop-count. Source and destination address are the IP addresses of source and destination nodes respectively. Request id is a counter which is incremented whenever the source generates a new RREQ. Hop count is counter initially set to zero and incremented after each hop.
Fig. 1 Radio Range of nodes A and B
A B
[image:1.595.361.497.616.728.2]Whenever an intermediate node gets a RREQ, it checks the source address and request id to detect whether it is a new request or a duplicate. If duplicate, it is discarded; if fresh, table update is done. The intermediate node compares the destination sequence numbers in the received RREQ packet with the stored one in its route-entry. If the sequence number in the RREQ packet is greater than or equal to the stored one, then RREQ is rebroadcasted, also the greater sequence number is updated in the route entry; otherwise it unicasts RREP (Request Reply) packet [1] back to the source via the node from which it received RREQ to declare that it has a valid route to the destination. With the traverse of RREQ, reverse pointers [1] were set up from all intermediate nodes towards the source node. As RREP travels towards the source, each node in the path sets up a forward pointer [1], and also updates its table.
A node propagates the first RREP it received for a particular source towards that source; more RREPs for the same source are propagated, if these replies contain the destination sequence number greater than the previous one, or equal to the previous one with a smaller hop count; otherwise these are discarded. Thus resulting in the decrease of redundant replies and confirming the latest routing information. Data transmission is initiated by the source node as soon as first RREP is received by it, however, if a better alternative for the route is found in future, it can update its routing table. Link breakage is obvious in mobile networks, which invokes the need of path maintenance [3]. In the case of link failure during an active session, the node upstream [3] of the breakpoint, broadcasts the RERR (Route Error) [3] message. In this way RERR propagates back to the source node, which in turn re-initiates path discovery process if it still requires.
3.
SIMULATION SETUP
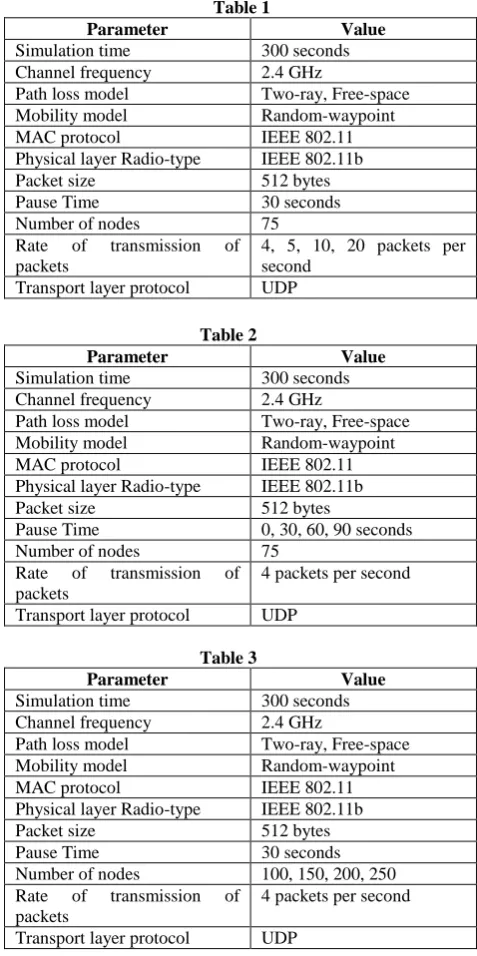
Extensive simulations [12, 13, 15, 16] have been done in recent years to evaluate the performance of AODV and other protocols; however, in our paper we have studied the performance variation of AODV by changing some parameters as node-density, pause time, and rate of transmission of packets, over the area of 1500×1500m2. On the other hand, path loss propagation model has been changed with every variation along with data traffic of CBR is applied between various source and destination. The mobility model used is Random-Way point. Two pathloss models used here are Free-space and Two-ray model. Propagation models [14] are used to predict the average received signal strength at a given distance from the transmitter, and the variation of the signal strength in close spatial proximity to a particular location. The scenario parameters are briefly depicted in Table 1, 2, 3. The Free-Space propagation model [14] is used to predict the signal strength when the transmitter and the receiver have a clear, unobstructed line-of-sight path between them. The free space power received by the receiver antenna at a given distance from the transmitter is given by the Friis free space equation [14]. The two-ray ground reflection model [14] is based on geometric optics, and considers both the direct path and a ground reflected path between transmitter and receiver.
The simulations are done with the help of a network simulator, called Qualnet 5.0 [11]. It is a simulator used to analyze the performance of wired, wireless, and heterogeneous networks. It allows designing network models easily, efficiently coding protocols, and run models that present real-time statistics.
On the basis of simulated results we have analyzed Packet delivery ratio, Throughput, End-to-End delay, Jitter for the given protocol.
3.1 Packet delivery ratio is the ratio of packets received by the destination to the packets sent by the source application layer. It is the measure of reliability for a particular network and protocol used.
3.2 Throughput is the amount of information successfully received in unit time. It is specified in bits per second.
3.3 Jitter is the variation in the arrival time of the packets at the receiver end.
3.4 End-to-End delay is the time elapsed when a packet is sent from the source node and is successfully received by the destination node. It includes delays as delay for route discovery, propagation time, data transfer time, and intermediate queuing delays.
Table 1
Parameter Value
Simulation time 300 seconds
Channel frequency 2.4 GHz
Path loss model Two-ray, Free-space
Mobility model Random-waypoint
MAC protocol IEEE 802.11
Physical layer Radio-type IEEE 802.11b
Packet size 512 bytes
Pause Time 30 seconds
Number of nodes 75
Rate of transmission of packets
4, 5, 10, 20 packets per second
Transport layer protocol UDP
Table 2
Parameter Value
Simulation time 300 seconds
Channel frequency 2.4 GHz
Path loss model Two-ray, Free-space
Mobility model Random-waypoint
MAC protocol IEEE 802.11
Physical layer Radio-type IEEE 802.11b
Packet size 512 bytes
Pause Time 0, 30, 60, 90 seconds
Number of nodes 75
Rate of transmission of packets
4 packets per second
Transport layer protocol UDP
Table 3
Parameter Value
Simulation time 300 seconds
Channel frequency 2.4 GHz
Path loss model Two-ray, Free-space
Mobility model Random-waypoint
MAC protocol IEEE 802.11
Physical layer Radio-type IEEE 802.11b
Packet size 512 bytes
Pause Time 30 seconds
Number of nodes 100, 150, 200, 250 Rate of transmission of
packets
4 packets per second
[image:2.595.308.547.252.731.2]4.
RESULTS AND DISCUSSION
[image:3.595.327.524.76.175.2]In Fig. 2, it is observed that the throughput is increasing with the increase in packet transmission rate. In free space model, the throughput is better and increment is steeper than the Two-ray model.
Fig. 2 Throughput vs Packet Transmission Rate
[image:3.595.68.269.136.239.2]From Fig. 3, it can be observed that the average jitter increases with the increase in packet transmission rate. Also the jitter is larger in the Two-ray model.
Fig. 3 Average Jitter vs Packet Transmission Rate
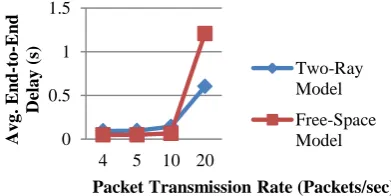
In order to analyze the effect of packet-transmission rate on the average end-to-end delay; it is observed (Fig. 4) that with comparatively lower amount of data sent per second, the average end-to-end delay is almost constant, and when we increased the rate of transmission from 10 to 20 packets per second, there is a sharp increase in the average end-to-end delay, almost in both the models.
Fig. 4 Avg. End-to-end delay vs Packet Transmission Rate
[image:3.595.328.541.276.381.2]The Packet Delivery Ratio (PDR) decreases (Fig. 5) with the increase in packet transmission rate; and the rate of decrease is also more for larger number of packets transmission per second. PDR is better for free-space model. The change can be justified by the fact, that if packets are sent at a greater speed, then more frequently packets enter into the network and as a result congestion occurs and packet dropping probability by the nodes increases, due to which PDR decreases.
Fig. 5 PDR vs Packet Transmission Rate
[image:3.595.67.269.309.421.2]It can be seen from Fig. 6, that the variation of mobility (lesser pause time means higher mobility) does not affects much the throughput, however, the free-space model performs better in the case.
Fig. 6 Throughput vs Pause Time
In Fig. 7, average jitter is shown against different pause times; jitter is not changing too frequently and in the scenario free-space model is working better than two-ray model for AODV.
Fig. 7 Average Jitter vs Pause Time
In Fig. 8, average end-to-end delay is plotted against different pause times, but delay is not varying so much for both the path loss models, however, free-space model outperforms the two-ray model here too.
Fig. 8 Avg. End-to-end delay vs Pause Time
0 10000 20000 30000 40000
4 5 10 20
Th ro u g h p u t (b p s)
Packet Transmission Rate (Packets/sec)
Two-Ray Model Free-Space Model 0 0.05 0.1 0.15
4 5 10 20
A v er a g e J itte r (s)
Packet Transmission Rate (Packets/sec)
two ray model Free Space Model 0 0.5 1 1.5
4 5 10 20
A v g . En d -to -En d De la y (s)
Packet Transmission Rate (Packets/sec)
Two-Ray Model Free-Space Model 0 0.2 0.4 0.6 0.8 1 1.2
4 5 10 20
Pa ck et De li v er y Ra tio (PDR)
Packet Transmission Rate (Packets/sec)
Two-Ray Model Free-Space Model 12000 13000 14000 15000 16000 17000
0 30 60 90
Th ro u g h p u t (b p s)
Pause Time (seconds)
Two-Ray Model Free-Space Model 0 0.02 0.04 0.06 0.08
0 30 60 90
Av er a g e J itter (s)
Pause Time (seconds)
Two-Ray Model Free-Space Model 0 0.02 0.04 0.06 0.08 0.1 0.12
0 30 60 90
Av er a g e En d -to -e n d De la y (s)
Pause Time (seconds)
Two-Ray Model
[image:3.595.329.526.442.548.2] [image:3.595.66.262.532.630.2] [image:3.595.329.527.629.746.2]In Fig. 9, PDR is shown, and it ranges between 0.95 and 1 for free-space model and between 0.85 and 0.9 for two-ray model. Free-space model is better again.
Fig. 9 PDR vs Pause Time
[image:4.595.69.274.109.237.2]When node density is increased (Fig. 10), the throughput decreased continuously in the Two-ray model, and the same pattern is observed with free-space model. For node density from 100 to 200, throughputs are approximately similar for both the model but at node density of 250 free-space model performs better.
Fig. 10 Throughput vs Node Density
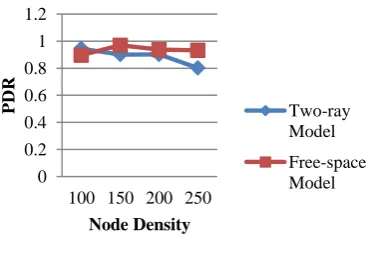
In Fig. 11, Packet delivery ratio is plotted against node density and same pattern as for throughput is observed here also, for both the models PDR is decreased with increased node density. Between nodes 100 and 200, PDR is approximately similar for free-space and two-ray model, but for node density of 250, two-ray model does not compete with free-space model.
Fig. 11 PDR vs Node Density
In Fig. 12, it is shown that average jitter is increased with increase in node density. The phenomenon can be justified by the fact that as nodes in the network increases, load on the
[image:4.595.326.533.328.446.2]network increases and due to that jitter also increases; however, for AODV this change is not very high.
Fig. 12 Average Jitter vs Node Density
In Fig. 13, average end-to-end delay is plotted against node density; delay is increased with node density due to increased load on the network. For free-space model it is between 0.014 and 0.1, however for two-ray model, it is between 0.024 and 0.15, so free-space is again better in this case too.
Fig. 13 Avg. End-to-end delay vs Node Density
5.
CONCLUSION
In this paper, the performance of AODV routing protocol on the basis of variation in packet-transmission rate, pause-time and node-density is studied. Also two path loss models Free-space and Two-ray ground-reflection models are used for analysis. In each case, it is found that free-space model gives better performance due to the fact that in this model, transmitter and receiver have unobstructed LOS path between them. Throughput and PDR are important parameter to judge the performance of a network. Higher throughput and PDR means better performance. However, jitter and end-to-end delay must be low. It is observed that the overall performance for AODV degrades as node density increases. It is found in analysis that with the increase in packet transmission rate efficiency of the network increases as throughput is increasing; but the reliability decreases which is justified by the reduced PDR.
6. REFERENCES
[1] C.E. Perkins and E.M. Royer, “Ad-hoc On-Demand Distance Vector Routing”, Proceeding of 2nd
IEEE Workshop, Mobile Computing System Applications, pp:90-100, 1999.
0.8 0.85 0.9 0.95 1
0 30 60 90
Pa
ck
et
De
li
v
er
y
Ra
tio
(PDR)
Pause Time (seconds)
Two-Ray Model
Free-Space
0 5000 10000 15000 20000
100 150 200 250
Th
ro
u
g
h
p
u
t
(b
p
s)
Node Density
Two-ray Model
Free-space Model
0 0.2 0.4 0.6 0.8 1 1.2
100 150 200 250
PDR
Node Density
Two-ray Model
Free-space Model
0 0.02 0.04 0.06 0.08 0.1
100 150 200 250
Av
er
a
g
e
J
itter
(s)
Node Density
Two-ray Model
Free-space model
0 0.05 0.1 0.15
100 150 200 250
Av
er
a
g
e
En
d
-to
-En
d
De
la
y
(s)
Node Density
Two-ray Model
[image:4.595.67.259.329.446.2] [image:4.595.81.272.559.694.2][2] C.E. Perkins, E.M. Royer, and S Das, “Ad-hoc On-Demand Distance Vector (AODV) routing”, IETF MANET Working Group, 2000.
[3] E.M. Royer and C.E. Perkins, “An Implementation Study of the AODV Routing Protocol”, 2000.
[4] Josh Broch, David Jhonson, and David Maltz, “The dynamic source routing protocol for mobile adhoc networks for IPv4” IETF RFC 4728, Feb 2007.
[5] A.S. Tanenbaum, “Computer Networks” 4th edition, Pearson
[6] V. Park and S. Corson, “Temporally-Ordered Routing Algorithm (TORA) version 1 Functional Specification”, draft-ietf-manet-tora-spec-04.txt.July 2001.
[7] Philippe Jaquet, Paul Muhlethaler and Amir Qayyum, 2001. “Optimized Link State Routing Protocol”, IETF Draft, draft-ietf-manet-olsr-06.txt.
[8] G. Pei, M. Gerla and T.W. Chen, “Fisheye State Routing in Mobile Ad-hoc Networks”, in proceedings of the 2000 ICDCS workshops, Taipei, Taiwan, April 2000.
[9] Zygmunt J. Haas, Mark R. Pearlman, and Prince Samar, “The Zone Routing Protocol (ZRP) for Adhoc Networks”, draft-ietf-manet-zone-zrp-04.txt.July 2002.
[10] Perkin C, Bhagwat P, “Highly Dynamic Destination Sequenced Distance-Vector Routing”, SIGCOMM 94, Computer Communication Review, vol. 24, no. 4, pp: 234-244, October 1994.
[11] Qualnet Network Simulator; http://www.scalacble-networks.com
[12] Md. Arafatur Rahman, Farhat Anwar, Jannatul Naeem, and Md. Sharif Minhazul Abedin, “A Simulation based Performance Comparison of Routing Protocol on Mobile Ad-hoc Network (Proactive, Reactive, and Hybrid)”, ICCCE, IEEE, 2010.
[13] M. Bhourma, H. Bentaouit, and A. Boudhir “Performance Comparison of Ad-hoc Routing Protocols AODV and DSR”, IEEE, 2009.
[14] T.S. Rappaport, “Wireless Communications, Principles and Practice” second edition, Pearson.
[15] K. Amzad and A. J. Stocker, “Impact of Node Density and mobility on the performance of AODV and DSR in MANETs”, CSNDSP, IEEE 2010.
[16] V. Kumar, S. Jain, and S. Tiwari, “Impact of Node Density and Mobility on Scalable Routing Protocols in Mobile Ad-hoc networks”, Special Issue of IJCA, 2012.