GREEN SYNTHESIS OF NANO-FE–BIOTITE FOR REMOVAL
OF HAZARDOUS METALS IONS FROM AQUEOUS
SOLUTIONS
Khaled M. Elsabawy
1,2,*, Morsy M.A.Sekkina
1and Ahmed T.Tawfik
1,3Keywords: biotite, heavy metals, uranium, thorium, removal, fluoride-free , wastewater
This paper represents synthesis of a new family of a fluoride-free Fe-Biotite type compound having the general formula NaFe2.5(Al,Si)4O10 (OH)2. Itwas prepared carefully by using solid- state reaction technique with nominal compositions of
individual oxides in the main formula for the potential remediation of heavy metals and some radioactive elements from applying solution. The structural and micro-structural properties were determined using both XRD, SEM and IR techniques. The particle size estimated was 56 nm. Further electron spin resonance (ESR) proved that Fe-biotite is paramagnetic in nature, electrical conductivity was measured as a function of absolute temperature, while thethermal stability of the samples were studied using thermogravimetry (TG). Analytical applications were done by using (AAS). Investigations proved that synthetic fluoride-free Fe-biotite has medium of strong efficiency as cation selective clay towards metals under test.
Corresponding Authors
Tel: +9660503252190
E-Mail:[email protected]
[a] Materials Science Unit ,Chemistry Department ,Faculty of Science, Tanta University, 31725-Tanta-Egypt
[b] Faculty of Science-Chemistry Department-Taif University-Taif–Alhawyah-888-Saudi Arabia
[c] Egyptian Environmental Affairs Agency-Egypt
Introduction
The extensive use of metals in industries such as mining, electroplating, battery, alloys processing, and other human activities (agricultural practices, transport, and waste disposal) have introduced substantial amounts of toxic heavy metals into the aquatic and terrestrial environment1.
The removal of metal ions from industrial wastewaters using different adsorbents is always a subject of great interest,2,3
because industrial wastewaters often contain considerable amounts of metal ions that would be dangerous to public health and the environment if discharged without adequate treatment.
Industrial activities generate a wide diversity of wastewaters, often containing agents that cause pollution, which can cause dangerous consequences for human beings by affecting the ecosystems. To minimize these unfavorable conditions, adsorption methodologies have been proposed as an alternative process for resolving such problems.4-9
Composite adsorbents/ion exchangers have been widely studied for treatment of liquid radioactive wastes. The composite ion exchangers present improved qualities with respect to those of pure inorganic exchangers or resins, such as; better selectivity for the capture of some ions, increased mechanical and chemical resistance, more regular form of the grains, smaller solubility in water than the respective inorganic compound, and better kinetics of exchange relatively to the pure inorganic exchangers. The composite ion exchangers are generally obtained by implantation of inorganic (e.g. clay minerals, cement, silica-gel or alumina)
into the wide range organic materials during the polymerisation process.10,11
The composite ion exchangers have been used in several studies for the treatment of low and medium level liquid radioactive wastes10-12 and to investigate of sorption
behavior of I–V group.13
Biotite is a member of the trioctahedral micas. It is commonly found in almost all types of granitic rocks and Some metamorphic rocks. Such a silicate mineral commonly coexists with quartz and feldspar, which are widely used as natural dosimeters for retrospective dosimetry and dating.14
Fe(II) is an important inorganic reductant that is abundant in soils and sediments. Fe(II) is found in many silicates, and oxidation-reduction reactions between aqueous species and structurally bound Fe on or beneath the surface of both silicates and oxides can control the redox state of associated solutes.15-17
Naturally occurring micas must be modified for use as commercial and cost-effective ion exchangers suitable to separate radionuclides from groundwater or aqueous nuclear wastes because micas have low cation exchange capacity (CEC). The low CEC of micas is due to interlayer potassium ions which are fixed. A few attempts have been made to improve CEC of the micas. Interlayer potassium ions can be replaced by sodium.
Green chemistry is a design, development,
implementation of chemical products and processes to reduce or eliminate the use and generation of substances hazardous to human health and environment, the present study aims to: (1) synthesis the Fe-Biotite adsorbent from eco-friendly and low cost raw materials:
(ii) by using Na+ as interlayer ion to increase cation
exchange of the mica for remediation;
(2) In order to characterize the adsorbent with a variety of techniques; and finally (3) to evaluate the performance of Fe-Biotite for effective Ag(I), Hg(II), As(V), Cr(III), Pb(II), Th (IV), U(VI), removal from aqueous solution.
Experimental and Methods
Materials
All reagents used were of analytical grade, Aluminum silicate Al2SiO5 (BHD), anhydrous sodium carbonate
Na2CO3 (GPR), Ferric oxide Fe2O3 were mixed in the
chemical compositions corresponding to synthesizing {NaFe2.5(Al,Si)4O10(OH)2}, which have chemical formula of
Fe-Biotite.
Clay's synthesis
The sample of synthetic free-fluoride Fe-biotite was prepared carefully by using solid-state reaction technique with nominal compositions of individual oxides in the main formula, aluminum silicate Al2O3.SiO2 (10.7 g), sodium
carbonate (anhydrous) Na2CO3 (0.8g), ferric oxide Fe2O3
(3.5 g). The powder mixtures were mixed in a ball mill and then blending to make a homogeneous mass with uniform distribution of particle size and composition. The green compacted metals powder were heated in a controlled atmosphere furnace to a temperature below its melting point in sealed platinum container at 900-950 °C for 9 h, followed by sintering step at 880 °C to allow packed metal powders to bond together and finally, annealing step that the temperature have gradual decrease till reach room temperature.
Adsorbent characterization techniques
X-ray diffraction
The X-ray diffraction pattern was obtained using an X'Pert SW. X-ray diffractometer with filtered CuKα radiation (λ=1.54 Å), at 40 Kv and 30 mA. The scanning speed was in the range of 2θ=5-70 (298 K). To determine the crystal size, Debye-Scherrer equation was used.18
where λ is the wavelength, β is the FHWM (full half width
maximum) of Bragg's peak corrected using the
corresponding peak in micron-sized powder and θ is the Bragg’s angle.
Infrared spectrum
The IR spectra were scanned on NICOLET 6700 FTIR Thermoscientific spectrophotometer using the KBr disc technique between (4000 and 400 cm-1). The method
includes mixing few mgs of a fine powder of the sample with KBr powder in agate mortar. The mixture was then pressed by means of a hydraulic press. The transmittance was automatically registered against wave-number (cm-1).
Scanning electron-microscope
A Philips model XL 30 CP scanning electron microscope (SEM) was used to take micrographs of the clay samples.
Electron spin resonance spectra
The (ESR) spectra were taken using (Bruker Elexys.500) operated at X-band frequency for investigation with fixed parameters and were at microwave frequency: 9.71 GHz, receiver gain: 30, sweep width: 6000 center at 3480 Gs, and microwave power: 0.002026W.
Thermal studies
Thermo-gravimetric analysis (TGA) and differential thermal analysis (DTA) were carried out on using a Shimadzu DTA-50H thermal analyzer. The sample was placed in platinum crucible (0.1 cm3) the system were
studied under nitrogen atmosphere with a heating rate 10 °C min-1 and following rate at 20 ml min-1, constant weight of
sample, 4.7 mg was used.
Conductance measurements
The dc conductance was measured over the temperature range 10-500 °C using A KEITHLEY 175 multi-meter (ASA). The pellet of synthetic Fe-biotite was sandwiched between spring loaded copper electrodes mounted into a specially designed temperature-controlled chromel-alumel thermocouple. Measurements were conducted in such a way that at each temperature, sufficient time was allowed to attain thermal equilibrium.
The number of conduction electron n is given by:
where n0 is the concentration of atoms at the lattice site, E𝐠
is the band gap, and k is the Boltzman constant (assuming E𝐠 ≈ kT), the conductivity relationship becomes
where
A=nο eµ. (4)
0.9
(1) cos
D
/
0 (2)
g E kT
n n e
/ 0
(n eEg kT)e (3)
lg lg (5) 2.303
g
E A
kT
The plot of log σ against 1/T should give a straight line with a slop of –E/2.303k. The measurements of σ as a function of temperature will permit calculation of the band gap energy Eg of materials behavior.
Adsorption experiments
Determination of distribution coefficient values of Fe-biotite was performed by using a series of metal ions. The selected metal ions were Ag(I), Hg(II), As(V), Cr(III), Pb(II). The concentration of each metal ion solution was adjusted as (10mg L-1 of each). In a 50 ml measuring flask,
for each experiment, (2 g) of sorbent material was suspended in 50 mL of metal ion solution19 the flask was
shaken and kept the solution for 24 h at room temperature. The pH was adjusted as previous studies. The specific adsorption of Pb2+ ion was examined at the pH about 4 to
avoid the hydrolysis, at higher PH values, and the dissolution of biotite, at lower pH values.20 The optimum pH
for adsorption silver ions from aqueous solution was found to be 4.0.21 Arsenate sorption onto biotite shows a broader
maximum in the pH range 4.6–5.6.23 The optimum pH value
appeared to be about 5.0, at lower pH (<5), Hg(II) was in the free ionic form of Hg2+23 and Cr(III) sorption was found to
be at pH 5.0.24 The pH adjusted by additions of
non-complexing substances such as HNO3 or NaOH. And did
not observe desorption to the solution directly in contact with biotite. This mixture was filtered using whatman filter
paper 40 ashless/circles 125 mm diameter. The
concentration of metal ion in the sample, standard and blank solutions were determined by atomic absorption analysis (AAS) and the amount of each metal sorbed by sorbent was calculated by difference.
The adsorption removal efficiency () of heavy metals from aqueous solution was calculated as follows:
where C0 and Cf are the liquid-phase concentrations of
heavy metal before and after adsorption, respectively.
Evaluation of the metal binding properties is considered more convenient by the distribution coefficient (Kd) when
possible concentrations of the tested metal ions are at very low concentration levels, especially in the range of ppm or ppb. The Kd value is determined from Eq. (7) (in ml/g)
where v is the volume of the solution (mL) and m is the weight of adsorbent (g).
The uranyl nitrate (UO2(NO3)2) and thorium dioxide
(ThO2) solutions of given concentration, volume was added
to a conical flask containing the synthetic Fe-biotite. The mixture was shaken and left at room temperature and pH 4.0 for 24h. The uranium (VI) and thorium (IV) in solution was
determined by using CARY 400 scan UV-VIS
spectrophotometer at 652 and 660nm respectively. The amount of adsorption at equilibrium time t,qe (mg/g), was
calculated by:
where C0 and Ce are the liquid-phase concentrations of
uranium(VI) and thorium(IV) at the initial concentration and equilibrium time, respectively; v the volume of the solution (mL); W is the mass of dry adsorbent used (g). The adsorption removal efficiency of uranium (VI) and thorium (IV) from aqueous solution was calculated as described above.
Results and Discussion
Characterization of synthetic Fe-biotite
Biotite (ideal formula [NaFe2.5(Si,Al)4O10(OH)2] is a 2:1
phyllosilicate mineral with tightly held, non-hydrated interlayer cations. The 2:1 layer has octahedrally coordinated cations sandwiched between two sheets of Si, Al tetrahedra. The main cations in the octahedral layer are divalent iron Fe(II), and the interlayer ion is mainly Na. that cause expansion of the interlayer regions due to an exchange of non hydrated K with Na.
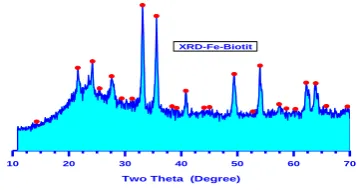
The analysis of the corresponding 2θ values and the inter-planner spacing d(A˚) were carried out using computerized program indicating that, the X-ray crystalline structure mainly belongs to a monoclinic phase in major beside few peaks of silicate(Fig.1).
Figure 1. XRD pattern of fluoride-free Fe-biotite .
The crystal size of detected phase was calculated using Scherer's equation and found to be 56 nm. This indicates that, the actual grain size in the material bulk is smaller than that detected on the surface morphology.
0
0
(%) 100C Cf (6)
C
(7)
adsorbent d
solution
m v
K
m m
0 e (8)
e
C C
q v
W
10 20 30 40 50 60 70
Two Theta (Degree)
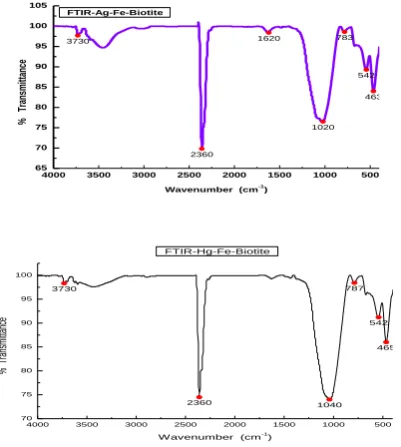
The FTIR spectra of Fe-biotite, was reported in Fig. 2. The spectrum of Fe-biotite shows infrared bands of ỌH stretching at 3420 cm−1 and Ṣi-Ọ-Si bending at 1030 cm−1.25
Fe-biotite also shows a wide and intense band at 1490 cm−1 and two weaker bands at 829 and 529 cm−1. The last band is due to ỌH bending Fe3+ hydration water.
Figure 2. FTIR spectra of fluoride-free Fe-biotite
TGA and DTA thermographs (Supplementary material and Fig.3) represent the synthetic (Fe-biotite) clay. TGA curve exhibit three main steps of weight loss. Initial step (T< 400 °C) a weight loss (about 5%) corresponding to both adsorbed and interlayer water loss takes place. Second step, the TGA curve shows a gradual decrease (about 2.3%) in the range 450-500 °C which is attributed to water loss. Finally, a third main loss occurs at temperatures in the range 630-830°C , where the TG curve displays a step weight loss (about 3.4 %) related to release of structural OH of Fe-biotite.
Figure 3. DTA curve of fluoride-free Fe-Biotite sample .
DTA curve of Fe-biotite, shown in (Fig. 3), illustrate endothermic peak at 187 °C due to dehydration effect, followed by exothermic peak at 220 °C is associated with the formation of structure.26
The ESR spectra of Fe-biotite were shown (Fig. 4). The spectrum recorded one intense absorption band at high field, which is isotropic due to the tumbling motion of the molecules. The magnetic susceptibility of 1.81 BM for Fe(II) indicates the presence of one unpaired electron, showing the structure is mononuclear in nature. This fact is also evident from g signal which appear at a lower magnetic field 3800 G. The observed g-value suggests that one ESR signals originates from Fe ion situated on an interstitial site.27
The SEM micrograph of the synthetic Fe-biotite sample was shown in (Fig. 5). It is seen from figure that Fe-biotite shows irregular platelets-like structure which have ragged edges and form sub-rounded flakes. SEM of Fe-biotite
indicates that the well crystallized clay sample contains stacked flasks of large particles which give low specific area little incorporation of impurities in the clay minerals.
Figure 4. ESR spectra of free-fluoride Fe-Biotite sample
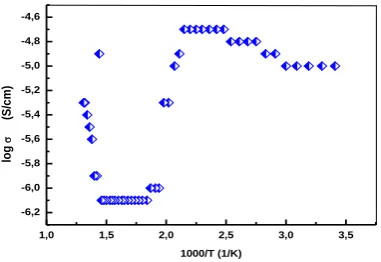
The temperature dependence of the electrical conductivity of synthetic Fe-biotite shows remarkable hysteresis Fig.(6). The electrical conductivity at a given temperature is significantly lower after heating than before. In order to investigate the hysteresis of conductivity, we conducted stepwise heating experiments of biotite. With increasing the temperature the conductivity decreases and gradually reaches a stationary value. Then the temperature was increased to the next value. The conductivity increase at a fixed temperature is not significant below 450 °C.
Figure 5. SEM of free-fluoride Fe-Biotite sample
Remarkable increase is observed at the temperature of 450-500 °C. The conductivity increase is not significant above 500 °C. The conductivity at a fixed temperature does not change during cooling.28 The band gap energy was
calculated from fig.6 found be -140 JK-1. Mica has a possibility as ionic conductors because they are a layered compound having interlayer cations.29
Micas with smaller interlayer cations, e.g. Na-type have a higher possibility as the ionic conductors.Removal of heavy metals from aqueous solution by using synthetic Fe-biotite. Sorption is a transfer of ions from liquid phase to the solid phase. Recently, adsorption has become one of the
4000 3500 3000 2500 2000 1500 1000 500
65 70 75 80 85 90 95 100
465 548 775
1030 1380 1630
2360 2920
3420
%
T
ra
ns
m
itta
nc
e
Wavenumber (cm-1)
FTIR-Fe-Biotite
0 200 400 600 800 1000
-30 -20 -10 0 10
H
ea
t f
lo
w
(µ
V)
Temperature [C] (b)
0 1000 2000 3000 4000 5000 6000 7000
-8000 -6000 -4000 -2000 0 2000 4000 6000
In
te
ns
ity
Field [G]
1,0 1,5 2,0 2,5 3,0 3,5 4,0
-6000 -4000 -2000 0 2000 4000 6000
In
te
ns
ity
alternative treatment techniques for wastewater laden with heavy metals. Basically, adsorption is a mass transfer process by which a substance is transferred from the liquid phase to the surface of a solid, and becomes bound by physical and/ or chemical interactions.30
In general, there are three main steps involved in pollutant sorption onto solid sorbent:
(i) the transport of the pollutant from the bulk solution to the sorbent surface;
(ii) adsorption on the particle surface; and (iii) transport within the sorbent particle.
Technical applicability and cost-effectiveness are the key factors that play major roles in the selection of the most suitable adsorbent to treat inorganic effluent.
Figure 6. Temperature dependence of the electrical conductivity of free-fluoride Fe-Biotite
The Atomic absorption spectrophotometric analysis of heavy metals after adsorbed on synthetic Fe-biotite revealed that a high level of adsorption was that the percentage removal of Ag(I), As(V), Pb(II), Cr(III) and Hg(II) ion by the adsorbent in solution would interact with the binding sites and thus facilitated reached to 99.8%, 69.3%, 33%,28%,11% and adsorption and Kd values were 14681 mg L-1 , 56.4 mg L-1, 12.3 mg L-1, 9.72 mg L-1, 3.1 mg L-1,
and respectively.
The synthetic mica gave high removal efficiency (% E) and good distribution ratio (Kd) value for uptake of
investigated heavy metals from 10 ml g-1 background
solution and thus proving that synthetic free-fluoride Fe-biotite is capable of removing these cations from contaminated water or soil because better access of the interlayer space due to reduced charge.31
As a general rule, the relative adsorbent affinity for a metallic cation increases with the cation ability to form inner cation sphere coordination complexes. For a same valence cation series, this tendency is positively related to metallic ionic radius.32
For each sorbent element, Figs. (7a-f) and Figs. (8a-e) plots the XRD and FTIR respectively, of each element sorbed and retained on the sorbent in the sorption experiments against its initial concentration in the sorption solution (ICSS).
Figure 7.a-e. XRD of Fe-biotite after Ag, Hg, As, Cr and Pb-adsorption
Diffractograms of the samples and FTIR Figs. (7a-f) and Figs. (8a-e) respectively showed that structures after adsorption of heavy metals almost changed than the original before treatment. The peaks centered between 2930 cm-1 and 2360 cm-1 are due to the presence of KBr disc used as a “matrix” and therefore are not diagnostic of any mineral.33
1,0 1,5 2,0 2,5 3,0 3,5
-6,2 -6,0 -5,8 -5,6 -5,4 -5,2 -5,0 -4,8 -4,6
lo
g
(S
/c
m)
1000/T (1/K)
10 20 30 40 50 60 70
Two Theta (Degree)
(a) XRD-Ag-Fe-Biotite
10 20 30 40 50 60
Two Theta (Degree) (b) XRD-Hg-Fe-Biotite
10 20 30 40 50 60 70
Two Theta (Degree) (c) XRD-As-Fe-Biotite
10 20 30 40 50 60 70
Two Theta (Degree)
(d) XRD-Cr-Fe-Biotite
10 20 30 40 50 60 70
The characteristic of synthetic Fe-biotite peak at 36 (2θ) was reduced to about 33(2θ). One would expect that it should be due to the heavy metal removal process.34 The
metal uptake is attributed to different mechanisms of ion-exchange and adsorption processes.35 During the
ion-exchange process, metal ions move through the pores of the biotite and channels of the lattice, and they replace exchangeable cations (mainly sodium) and additionally exchange with protons of surface hydroxyl groups.
Figure 7f. Removal efficiency values of Fe-biotite towards different heavy metals cations solutions.
In the case of exchange with sodium, Naً+(biotite) +
Mً+(solution)→ Mً+(biotite)+ Naً+(solution) reaction, in which sodium
ions placed on the biotite surface exchange with the metal ions (M+) in the solution, occurs. When the exchange site is
a hydroxyl group, biotite–OH(biotite) + Mً+(solution)ً → biotite–
O–M(biotite) +H+ً(solution) exchange reaction occurs and in this
case, metal ions (M+) exchange with the H+ ions.
Figure 8a and b. FTIR spectra for Fe-biotite after (a) Ag-adsorption, (b) after Hg-Adsorption
Diffusion was faster through the pores and retarded when the ions moved through the smaller diameter channels. The ion-exchange processes in biotite are affected by several factors such as concentration and nature of cations, pH and crystal structure of the biotite. The effect of these parameters has been investigated in several studies due to
the importance of biotite’s mineral stability in the applications of biotite as an ion exchanger.36,37 These data
confirm that, the cation selectivity of Fe-biotite towards the investigated metals that captured through silicate layers.
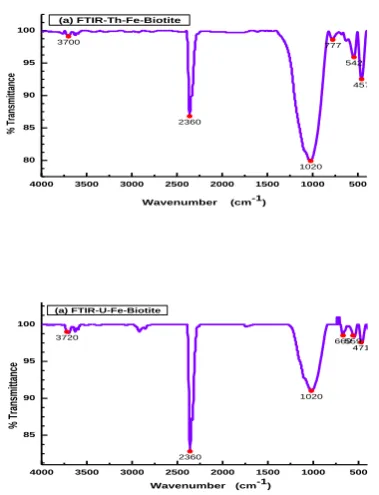
Figure 8c-e. FT-IR spectra of Fe-biotite (c) after As adsorption; (d) after Cr adsorption; (e) after Pb adsorption
Uptake of thorium and uranium cations by newly synthetic Fe-biotite
Depending on the structure of the adsorbent, several diffusion mechanisms become dominant and sometimes only two or three of them compete or cooperate. The dominant mechanism also depends on a combination of adsorbate, adsorbent and adsorption conditions, such as temperature and concentration range.38
The adsorption of thorium ion onto the biotite is mainly affected by the surface hydroxyl groups of the adsorbent. The silicon atoms at the surface tend to maintain their tetrahedral coordination with oxygen. They complete their coordination at room temperature by attachment to monovalent hydroxyl groups, forming silanol groups. Theoretically, a pattern in which one silicon atom bears two or three hydroxyl groups, yielding silanediol and silanetriol groups respectively is possible. It has already been reported as improbable that silanetriol groups exist at the silica surface.39,40 The types of silanol groups and hydrous oxide
surface groups in alumina are given in Fig. 11.39 These
groups give the adsorption property to perlite, similar like biotite.
4000 3500 3000 2500 2000 1500 1000 500
70 75 80 85 90 95 100 465 542 787 1040 2360 3730 % T ra nsmi tta nce
Wavenumber (cm-1)
FTIR-Hg-Fe-Biotite
4000 3500 3000 2500 2000 1500 1000 500
65 70 75 80 85 90 95 100 105 463 542 783 1020 1620 2360 3730 % Tr an sm itta nc e
Wavenumber (cm-1)
FTIR-Ag-Fe-Biotite
4000 3500 3000 2500 2000 1500 1000 500
82 84 86 88 90 92 94 96 98 100 102 463 544 785 1020 1630 2360 3440 3730 % Tr an sm itta nc e
Wavenumber (cm-1
)
(c) FTIR-As-Fe-Biotite
4000 3500 3000 2500 2000 1500 1000 500
80 85 90 95 100 461 542 783 1020 1630 2360 3450 3720 % T ra ns m itta nc e
Wavenumber (cm-1
) (d) FTIR-Cr-Fe-Biotite
4000 3500 3000 2500 2000 1500 1000 500
80 85 90 95 100 467 548 785 1010 1080 2360 3630 3720 % T ra ns mit ta nc e
Wavenumber (cm-1)
Figure 9a and b. X-ray diffraction patterns of Fe-biotite after (a) Th- adsorption, (b) U-Adsorption .
It seems that once U(VI) ions are adsorbed and have penetrated into the interlayer region, they become immobile.41 This statement is partly supported by the
observation that U(VI) was partially reduced to U(IV) on ferrous mica.42
Figure 10a and b. Infrared absorption spectra recorded after U and Th capture on the Fe-biotite .
The result showed higher efficiency removal for uranium than the previous studied which reported that the maximum amount of uranium sorbed onto each individual mineral was different and ranged from 48% of the initially added uranium for quartz, 58% for albite, 70% for muscovite and chlorite, to 97% for phyllite
Figure 11. The types of silanol groups and the hydrous oxide
surface groups in alumina by Dogan et al.29
Conclusions
The conclusive remarks inside this paper can be briefed as follows:
1. Green synthesis of fluoride-free NaFe2.5(Al,Si)4O10
(OH)2 for remediation of contaminated effluents has been
developed.
2. Fe-biotite shows moderate to strong strength as cation selective ion exchanger for the tested toxic metals
3. Sorption of heavy metal ions by Fe-biotite was established according to the aforementioned group of BATNEEC (best available technology not entailing excessive costs) treatment technologies as a standard process has been developed.
Acknowledgments
The authors are thankful to the Department of Chemistry, faculty of Science, University of Tanta, Egypt for providing laboratory facilities.
References
1O’Connell, D. W., Birkinshaw, C., & O’Dwyer, T. F., Bioresour.
Technol., 2008, 99, 6709.
2Abollino, O. Aceto, M. Sarzanini, C. Mentasti, E., Anal. Chim.
Acta., 2000, 411, 223.
3Huang, C. P., Tsong, M. W., Hsieh, Y. S. in: K. Peters, D.
Bhattaacharya (Eds.), AIChE Symp. Ser., Heavy Metal
Separation Processes, American Institute of Chemical
10 20 30 40 50 60 70
Two Theta (Degree)
(a) XRD-Th-Fe-Biotite
10 20 30 40 50 60 70
Two Theta (Degree)
(b) XRD-U-Fe-Biotite
4000 3500 3000 2500 2000 1500 1000 500
85 90 95 100
471 559 669
1020
2360 3720
% Tr
an
smit
ta
nc
e
Wavenumber (cm-1)
(a) FTIR-U-Fe-Biotite
4000 3500 3000 2500 2000 1500 1000 500
80 85 90 95 100
457 542 777
1020 2360
3700
%
T
ra
ns
m
itta
nc
e
Wavenumber (cm-1) (a) FTIR-Th-Fe-Biotite
Si OH silanol group
Si
OH
OH silanediol group
Si OH
OH
OH silanetriol group
Al OH
Al OH
OH
4Bhattacharyya, K. G. Gupta, S. S., Colloids Surf. 2006, 277, 191.
5Sharma, P., Tomar, R., Micropor. Mesopor. Mater., 2008, 116,
641.
6Babel, S., Kurniawan, T. A., J. Hazard. Mater., 2003, 97, 219.
7Naseem, R., Tahir, S. S., Water Res. 2001, 35, 3982.
8Tsoufis, T., Xidas, P., Jankovic, L., Gournis, D., Saranti, A.,
Bakas, T., Karakassides, M.A., Diamond Relat. Mater. 2007,
16, 155.
9Karadag, D., Koc, Y., Turan, M., Ozturk, M., J. Hazard. Mater.
2007, 144, 432.
10Sebesta, F. Motl, A. John, J. Proc. Int. Conf. Nuclear Waste
Manag. Environ. Remediation, 1993, 3, 871., Prague, Czech
Republic
11Sebesta, F. John, J. An Overview of the Development, Testing,
and Application of Composite Absorbers, Los Alamos
National Laboratory, Report No: LA-12875-MS, 1995, p. 30.
12Tranter, T. J., Herbst, R. S., Todd, T. A., Olson, A. L., Eldredge,
H. B., Adv. Environ. Res., 2002, 6, 107.
13Szeglovski, Z., Constantinescu, O., Hussonnois, H., Radiochem.
Acta., 1994, 64, 127.
14Aitken, M. J. Thermoluminescence Dating, Academic Press,
London, 1985.
15Ilton, E. S. and Veblen, D. R., Geochim. Cosmochim. Acta1994,
58, 2777.
16Gan, H., Bailey, G. W., and Yu, Y. S., Clays Clay Miner., 1996,
44, 734.
17Peterson, M. L. Brown, G. E. Jr., Parks, G. A. and Stein, C. L.,
Geochim. Cosmochim. Acta1997, 61, 3399.
18Profi, S., Sideris, C. and Filippakis, S. E., N. Jb. Miner. Mh.,
1973, H1, 8.
19Covelo, E. F. Vega, F. A. Andrade, M. L., J. Hazard. Mater.
2007, 140, 308.
20Lazarevic, S., Jankovic-Castvan, I., Jovanovic, D., Milonjic, S.,
Janackovic, D., Petrovic, R., App. Clay Sci., 2007, 37, 47.
21Akgul, M., Karabakan, A., Acar, O., Yurum, Y., Micropor.
Mesopor. Mater., 2006, 94, 99.
22Frost, R. R., Griffin, R. A., Soil Sci. Soc. Am. J., 1977, 41, 53.
23Gonc¸ C., Rocha, A., Zaia, D. A. M., da Silva Alfaya, R. V., da
Silva Alfaya, A. A., J. Hazard. Mater. 2009, 166, 383.
24Zhou, Y.-F., Haynes, R. J., Water, Air, & Soil Pollut., 2011,
215(1-4), 631.
25Farmer, V. C., The Infrared Spectra of Minerals. Mineralogical
Society, London (1974).
26Mohsen, Q., El-Maghraby, A., Arabian J. Chem., 2010, 3, 271.
27Joseyphus, R. S., Nair, M. S., Arabian J. Chem., 2010, 3, 195.
28Tate, I., Kitajima K. and Daimon, N., Kougyou Kagaku (J. Chem.
Soc. Japan), 1968, 71, 976.
29Mahmoud, M. E., Osman, M. M., Hafez, O. F., Elmelegy,
E.,J. Hazard Mater., 2010, 173, 349.
30Kurniawan, T. A., Babel, S., 2nd Int. Conf. Energy Technol. Clean
Environ. (RCETE), 2003, 2, 1110. Phuket, Thailand, 12–14 February
31Komarneni, S., Pidugu, R., Amonette, J.E., J. Mater. Chem.,
1998, 8, 205.
32Sposito, G., The Chemistry of Soils. Oxford University Press,
New York, USA, 1989.
33Lugwisha, E. H.J., Tanz. J. Sci., 2011, 37, 167.
34Vengris, T., Binkiene, R., Sveikauskaite, A., J. Appl. Clay Sci.,
2001, 18, 183.
35Erdem, E., Karapınar, N., Donat, R:, J. Colloid. Interface. Sci.,
2004, 280(2), 309.
36Chakraborty, S., Wolthers, M., Chatterjee, D., Charlet, L., J.
Colloid Interface Sci., 2007, 309, 392.
37Cho Y. C., Komarneni, S., App. Clay Sci., 2009, 44, 15.
38Suzuki, M., Adsorption Engineering. Kodansha, Tokyo, 1990.
39Dogan, M., Alkan, M., Onganer, Y., Water Air Soil Pollut., 2000,
120, 229.
40Talip, Z., Eral, M., Hiçsönmez, U., J. Environ. Radioact. 2009,
100, 139.
41Lee, S. Y., Baik, M. H., Lee, Y. J., Lee, Y. B., App. Clay Sci.,
2009, 46(3), 255.
42 Ilton, E. S., Haiduc, A., Moses, C. O., Heald, S. M., Elbert, D. C.,
Veblen, D. R., Geochim. Cosmochim. Acta2004, 68, 2417.
Received: 29.Sept. 2012.