COMPARISON OF RELIABLE CHANGE INDICES OF CNS VITAL SIGNS FOR DIFFERENT RANGES OF BASELINE SCORES
By
Michelle M. Ikoma
Honors Essay
Department of Exercise and Sport Science University of North Carolina
2014
ABSTRACT
MICHELLE IKOMA: Comparison of Reliable Change Indices of CNS Vital Signs for Different Ranges of Baseline Scores
(Under the direction of Jason P. Mihalik)
Computerized neurocognitive tests are widely used in the management of
sport-related concussion. Many of these assessments use reliable change confidence intervals—
computed as baseline score ± reliable change index (RCI)—to classify an individual as
impaired or unimpaired at a follow-up test point. If an individual’s retest score falls
outside of the reliable change confidence interval on a given domain, he or she is
classified as impaired on that domain. The purpose of this study was to compare RCIs for
three different ranges of CNS Vital Signs baseline scores: the lowest quintile (0-20th percentile), middle quintile (40-60th percentile), and highest quintile (80-100th percentile).
One-hundred seven Division I student-athletes completed baseline and follow-up
computerized neurocognitive testing on CNS Vital Signs and were divided into quintile
groups based on their baseline score for each clinical domain. RCIs were computed for
the lowest, middle, and highest quintiles for each domain. Overall group RCIs were also
computed. The RCIs varied considerably across the quintile groups, with average and
high baseline performers tending to have smaller RCIs than low baseline performers and
the full group in each domain. In addition, significant interaction effects of time and
quintile group were found for several domains as well as for Neurocognition Index.
These results suggest that it is important for clinicians to consider an individual’s
baseline performance level when interpreting CNS Vital Signs neurocognitive test results
TABLE OF CONTENTS
LIST OF TABLES ... v
LIST OF FIGURES ... vi
CHAPTER I ... 1
Research Question and Hypothesis ... 3
Significance of the Study ... 3
CHAPTER II ... 5
Introduction ... 5
Sport-Related Concussion ... 6
Definition & Epidemiology ... 6
Pathophysiology ... 7
Symptomatology ... 8
Proper Management of Sport-Related Concussion ... 9
Early Return-to-Play and Repeat Concussions ... 11
Neurocognitive Testing in Sport-Related Concussion Management ... 12
Interpretation of Neurocognitive Test Scores ... 13
CHAPTER III ... 16
Participants ... 16
Instrumentation ... 16
Procedures ... 17
Statistical Analysis ... 18
CHAPTER IV ... 22
Introduction ... 22
Methods ... 24
Participants ... 24
Instrumentation ... 25
Procedures ... 25
Data Reduction ... 26
Statistical Analysis ... 26
Results ... 28
Discussion ... 29
Limitations ... 34
Conclusions and Clinical Implications ... 35
LIST OF TABLES
Table 3.1. Participants by sport... 20
Table 3.2. Descriptions of CNS Vital Signs subtests... 21
Table 4.1. Participation by sport ... 37
Table 4.2. Description of CNS Vital Signs subtests ... 38
Table 4.3. Overall domain reliable change indices (RCIs) and RCIs for each quintile .... 39
LIST OF FIGURES
CHAPTER I
INTRODUCTION
In the United States alone, an estimated 1.6 to 3.8 million sport-related
concussions occur each year (Langlois, Rutland-Brown et al. 2006). Concussion is
defined as “a traumatically induced transient disturbance of brain function…[involving] a
complex pathophysiological process,” and can have numerous adverse short-term effects
including, but not limited to, headaches, balance deficits, sensitivity to light and noise,
and difficulty concentrating (Harmon, Drezner et al. 2013). While symptoms generally
resolve within 7 to 10 days in college athletes, in some cases they may persist for weeks,
months, or even years (Frommer, Gurka, et al. 2011; Makdissi, Darby et al. 2010; Marar,
McIlvain et al. 2012; Meehan, d’Hemecourt et al. 2010). Objective measures are
important for concussion evaluation, because cognitive recovery can lag behind clinical
concussion symptom resolution (Lovell, Collins et al. 2004; McCrea, Barr et al. 2005).
This has prompted the widespread adoption of neurocognitive testing in managing
sport-related concussion over the past 15 years (Echemendia, Iverson et al. 2013). Currently,
several organizations recommend using neurocognitive testing as part of a
comprehensive, multidimensional concussion management program (Harmon, Drezner et
al. 2013; McCrory, Meeuwisse et al. 2013). In addition, many high schools and other
institutions with limited resources may rely heavily on the results of computerized
neurocognitive testing in making return-to-play decisions for athletes who have sustained
An athlete’s neurocognition is generally evaluated during a baseline test prior to
sports participation to establish his or her “normal” level of neurocognitive functioning.
Then following a concussive incident, the athlete takes a similar neurocognitive test, and
the results of this post-injury test are compared to the athlete’s baseline performance to
provide some level of objective information with respect to the level of injury severity or
state of recovery. While this baseline/post-injury comparison protocol helps control for
inherent inter-individual differences in cognitive abilities, it depends on an athlete’s
baseline neurocognitive scores’ being truly representative of his or her “normal”
cognitive functioning level. However, at present, evidence that athletes’ preseason test
scores serve as reliable baselines for comparison to post-injury test results weeks,
months, or even years later is insufficient to recommend widespread baseline testing for
all athletes (Harmon, Drezner et al. 2013; McCrory, Meeuwisse et al. 2013).
As with any test, random variability plays a role in determining an individual’s
performance level on a neurocognitive assessment. Exceptionally low neurocognitive test
performance likely results from the interaction of below average cognitive abilities and
unfavorable random variability. Symmetrically, exceptionally high neurocognitive test
performance likely results from the interaction of above average cognitive abilities and
favorable random variability. Thus, regression to the mean theory suggests that, due to
chance alone, exceptionally low performers at baseline will score higher the second time
they take a neurocognitive test, and vice versa for exceptionally high performers at
baseline. Consequently, the reliable change indices (RCIs) for a neurocognitive
assessment may be different for these extreme score ranges as compared to “average”
commonly used neurocognitive assessment tool, CNS Vital Signs, for three different
ranges of baseline test scores—(1) the lowest quintile (0-20th percentile), (2) the middle
quintile (40th-60th percentile), and (3) the highest quintile (80th-100th percentile)—in a large sample of college student-athletes. Different RCIs across these groups would imply
different utility levels of NC testing in helping clinicians and other healthcare providers
make the most prudent return-to-play decisions for their athletes. Additionally, we were
interested in whether test-retest scores differed based on group (quintile) assignment.
Research Question and Hypothesis
What are the RCIs for CNS Vital Signs for the lowest quintile, middle quintile, and
highest quintile of baseline scores for each clinical domain and Neurocognition Index
(NCI)?
We hypothesize the RCIs for CNS Vital Signs will be larger for the lowest
quintile and highest quintile of baseline scores than for the middle quintile of
baseline scores for each clinical domain and NCI.
Significance of the Study
If the research hypothesis is accepted, the results would suggest that
baseline/post-injury comparisons of performance on neurocognitive assessments may be
less sensitive to changes in cognitive functioning for those scoring in the extreme ranges
at baseline when a baseline/post-injury comparison interpretation method is used. This
would suggest that larger score variations from baseline may be normal for these
these athletes post-injury neurocognitive test results. Moreover, if these quintile RCIs are
found to be too large to be clinically meaningful for certain domains, the results would
suggest that these domains may contribute limited value in informing clinicians’
return-to-play decisions for very low and very high baseline performers in these domains. In
addition, the results may prompt similar studies investigating variability in test-retest
reliability across different baseline score ranges using other commonly used NC test
batteries, such as ImPACT, Headminder, and Axon.
CHAPTER II
LITERATURE REVIEW
Introduction
Sport-related concussion has drawn a great deal of attention from medical
practitioners, researchers, and the general public alike. Consequently, increasing attention
has been paid to best practices in the prevention, management, and treatment of
sport-related concussions. One area in concussion management that has grown exceptionally
over the past two decades is using NC assessment tools to aid return-to-play decisions.
Over the past 15 years, there has been an exponential increase in the use of NC testing in
managing sport-related concussion (Echemendia, Iverson et al. 2013).
However, evidence has recently suggested that the pre-injury/post-injury
comparison model which has been widely adopted for NC testing in concussion
management may frequently result in false positives, raising concerns about relying on
such information in making return-to-play decisions (Randolph 2011; Resch, Driscoll et
al. 2013). Nonetheless, computerized NC assessment continues to be a key component of
sport-related concussion management programs in high schools and universities across
the country since neurocognitive deficits are commonly the last adverse effects of a
concussion to resolve (Bleiberg, Cernich et al. 2004; Bleiberg, Warden 2005; Ellemberg,
Henry et al. 2009; Fazio, Lovell et al. 2007; Johnson, Kegel et al. 2011; Makdissi, Darby
significant information in concussion evaluation” (McCrory, Meeuwisse et al. 2013).
Therefore, this study aims to better understand how the test-retest reliability of such
computerized NC tests may be impacted by an individual’s baseline performance on
these assessments.
This literature review will provide a thorough description of sport-related
concussion, including its epidemiology, pathophysiology, symptomology, and potential
consequences of repeat concussions; briefly describe current recommendations regarding
proper management of sport-related concussion; and describe how NC assessment tools
are currently used in the management of sport-related concussion.
Sport-Related Concussion
Definition & Epidemiology
Concussion is a form of mild traumatic brain injury (TBI). As defined by the AMSSM, a concussion is “a traumatically induced transient disturbance of brain
function…caused by a complex pathophysiological process” (Harmon, Drezner et al.
2013). Although concussion may involve a loss of consciousness, in 80.8% to 92% of all
instances of sport-related concussion, athletes remain fully conscious (Collins, Iverson et
al. 2003; Schulz, Marshall et al. 2004). Based on data collected by the Centers for
Disease Control and Prevention, it is estimated that as many as 3.8 million sport-related
concussions occur each year (Langlois, Rutland-Brown et al. 2006). Moreover, because
many mild TBIs may go unrecognized and thus unreported, the true number of
sport-related concussions occurring annually may be even higher (Langlois, Rutland-Brown et
Approximately 5% to 9% of all injuries that occur in high school and collegiate
sports are concussions (Gessel, Fields et al. 2007; Hootman, Dick et al. 2007; Powell and
Barber-Foss 1999). Although concussions occur in a wide array of sports, they are most prevalent in football, wrestling, women’s soccer, men’s soccer, and women’s basketball
(Gessel, Fields et al. 2007; Lincoln, Caswell et al. 2011; Powell and Barber-Foss 1999;
Schulz, Marshall et al. 2004). Concussion rates tend to be higher in competition than in
practice, especially for contact sports (Gessel, Fields et al. 2007; Marar, McIlvain et al.
2012). Recent studies have also shown systematically higher concussion rates for women’s soccer and basketball as compared to their men’s equivalents, suggesting a
possible gender difference in concussion risk (Covassin, Swanik et al. 2003; Dick 2009;
Gessel, Fields et al. 2007; Lincoln, Caswell et al. 2011; Marar, McIlvain et al. 2012).
Pathophysiology
Concussion is caused by the transmission of rotational and/or linear forces to the
brain (Harmon, Drezner et al. 2013). These forces “initiate a complex cascade of
neurochemical and neurometabolic events” known commonly as the ‘neurometabolic
cascade’ which manifest themselves outwardly as NC deficits and concussion symptoms
(Barkhoudarian, Hovda et al. 2011). This neurometabolic cascade begins with a
non-discriminant flux of ions across neuronal membranes resulting in membrane
depolarization and action potential (AP) generation in turn causes excitatory
neurotransmitters to be released (Barkhoudarian, Hovda et al. 2011). This results in a
massive efflux of potassium, leading to a widespread suppression of neurons, temporarily
membrane potential, sodium-potassium pumps must operate at maximal capacity, quickly
depleting adenosine-triphosphate (ATP) stores, resulting in hyperglycolysis immediately
following injury (Barkhoudarian, Hovda et al. 2011). Glucose, which has been shown to
contribute to both learning and memory, is thus diminished, potentially explaining acute
memory deficits resulting from concussion (Gold 2001; Korol and Gold 1998).
Concurrently, large influxes of calcium cause oxidative dysfunction in
mitochondria, resulting in impaired oxidative glucose metabolism for up to 10 days
following a mild concussive injury (Barkhoudarian, Hovda et al. 2011). Because glucose
metabolism is vital to proper brain function—particularly for learning and memory
tasks—this impairment may result in temporary attention and memory deficits associated
with concussion (Gold 2001; Korol and Gold 1998). Likewise, axonal injury resulting
from concussive forces has been associated with diminished cognitive performance in
both children and adults (Niogi, Mukherjee et al. 2008; Wozniak, Krach et al. 2007).
Symptomatology
The most common symptoms associated with concussion are headaches,
dizziness, and difficulty concentrating, all of which may interfere with normal cognitive
functioning (Marar, McIlvain et al. 2012; Meehan, d’Hemecourt et al. 2010). Over 90%
of high school athletes diagnosed with a concussion reported headaches, 75% reported
dizziness, and over half reported having difficulty concentrating (Marar, McIlvain et al. 2012; Meehan, d’Hemecourt et al. 2010). Other commonly reported symptoms include
confusion/disorientation, nausea, drowsiness, and sensitivity to light (Marar, McIlvain et
and their overlap with those of other neurocognitive disorders such as ADHD and
depression can make concussions difficult to identify and diagnose (Harmon, Drezner et
al. 2013). Moreover, athletes may underreport (or simply not report) their symptoms and/or the severity of their symptoms to avoid losing playing time, further complicating
the diagnosis and management of sport-related concussion (McCrea, Hammeke et al.
2004; Register-Mihalik, Guskiewicz et al. 2013). Thus, authorities on concussion in sport
more strongly recommend the use of NC testing for athletes who may deny their
symptoms in hopes of returning to play sooner (Harmon, Drezner et al. 2013).
Short-term balance and neurocognitive deficits also commonly result from
concussion (Harmon, Drezner et al. 2013; McCrory, Meeuwisse et al. 2013).
Approximately 30% of athletes diagnosed with concussion experience balance deficits
which generally resolve within 3 to 7 days (Guskiewicz 2011; Harmon, Drezner et al.
2013). Neurocognitive deficits often coincide with self-reported concussion symptoms (such as difficulty concentrating and feeling mentally ‘foggy’), and NC recovery
generally overlaps with symptom resolution (McCrory, Meeuwisse et al. 2013). In some
instances, however, cognitive deficits may persist beyond clinical symptom recovery,
prompting many organizations to adopt baseline NC testing as a key component of their
concussion management programs (Bleiberg, Cernich et al. 2004; Bleiberg and Warden
2005; Broglio, Macciocchi et al. 2007; Fazio, Lovell et al. 2007).
Proper Management of Sport-Related Concussion
Proper management of sport-related concussion is critical to ensure that athletes
predispose athletes to sustaining a subsequent, more severe concussion and lead to
prolonged symptom duration (Harmon, Drezner et al. 2013). Currently, authorities in this
area recommend a multifaceted, multimodal approach to managing sports-related
concussion, which includes consideration of an athlete’s concussion history,
comorbidities and complicating factors (such as LD or ADHD), symptoms,
balance/postural stability, and cognitive function (Echemendia, Iverson et al. 2013;
Harmon, Drezner et al. 2013; McCrory, Meeuwisse et al. 2013).
Thus, ‘best practices’ in sport-related concussion management encompass the
following components:
A pre-participation exam (PPE), including:
o Questions about concussion history,
o Questions about learning, mood, attention, and/or migraine disorders,
o Baseline symptom evaluation,
o Baseline balance evaluation, and
o Baseline sideline assessment using a well-validated sideline assessment
tool (which may itself include symptom and balance evaluation) and/or
baseline computerized NC testing;
Immediate post-injury evaluation, including:
o Symptom evaluation,
o Balance evaluation, and
o Cognitive evaluation;
And ongoing evaluation of an athlete’s:
o Neurocognitive function, once the athlete is symptom-free.
(Guskiewicz, Bruce et al. 2004; Harmon, Drezner et al. 2013)
Early Return-to-Play and Repeat Concussions
Even with proper management, those with a previous concussion are over twice
as likely to have a concussive injury in the future (Colvin, Mullen et al. 2009;
Guskiewicz, Marshall et al. 2007; Guskiewicz, McCrea et al. 2003; Schulz, Marshall et
al. 2004). Allowing an athlete with unresolved symptoms or NC deficits to return to play
can further increase his/her risk of sustaining a subsequent concussion by diminishing
his/her ability to meet the physical and mental demands of his/her sport (Longhi, Saatman
et al. 2005; Lovell and Collins 1998; McCrea, Guskiewicz et al. 2003; Slobounov,
Slobounov et al. 2007).
Repeat concussions predispose athletes to developing both clinical depression and
mild cognitive impairment (MCI) and may lead to persistent neurocognitive deficits
(Guskiewicz, Marshall et al. 2005; Guskiewicz, Marshall et al. 2007; Iverson,
Echemendia et al. 2012). Among retired professional football players, those who
sustained three or more concussions were three times more likely to be diagnosed with
depression and five times as likely to be diagnosed with MCI as compared with those
with no history of concussion (Guskiewicz, Marshall et al. 2005; Guskiewicz, Marshall et
al. 2007). In addition, studies have suggested that lingering cognitive deficits may result
from sustaining three or more concussions (Collins, Grindel et al. 1999; Iverson,
further investigation is needed to understand how NC function is impacted by repeat
concussions (Broglio, Ferrara, et al. 2006; De Beaumont, Brisson et al. 2007).
Neurocognitive Testing in Sport-Related Concussion Management
Evaluation of an athlete’s neurocognitive functioning can be particularly
beneficial in helping clinicians make return-to-play decisions (Harmon, Drezner et al.
2013; McCrory, Meeuwisse et al. 2013). NC testing “can identify occult cognitive
impairment” in athletes, providing clinicians with more complete information to use in
their decision-making process (Harmon, Drezner et al. 2013). Either paper-and-pencil
tests or computerized NC assessment tools such as Immediate Postconcussion
Assessment and Cognitive Testing (ImPACT), CNS Vital Signs, and Headminder can be
used for NC testing. Computerized NC tests are used far more commonly than their
paper-and-pencil counterparts by schools and professional sports organizations because
they are much more efficient and cost-effective to administer (Echemendia, Iverson et al.
2013; Harmon, Drezner et al. 2013; Johnson, Kegel et al. 2011). ImPACT alone is used
by over 7,000 high schools, more than 1,000 universities, and numerous MLB, NFL, and
NHL teams (About ImPACT). Other possible advantages of computerized NC assessment tools over traditional paper-and-pencil tests include reduced practice effects, improved
reliability across multiple test administrators, increased accuracy in reaction time
measurement, and greater validity in identifying subtle changes in cognitive speed
(Johnson, Kegel et al. 2011). One key disadvantage of computerized NC testing,
however, is the test administrator’s inability to directly observe an individual as he/she
Interpretation of Neurocognitive Test Scores
Baseline/Post-Injury Comparison
The notion behind baseline testing is intuitive. In theory, baseline testing provides an individualized benchmark of what is “normal” for a particular athlete which can be
used as a basis of comparison for that person following a concussion (Guskiewicz, Bruce
et al. 2004). However, in reality, numerous intrinsic and extrinsic factors other than an
athlete’s cognitive functioning impact his/her performance on an NC test (Johnson, Kegel
et al. 2011; Mulligan, Boland et al. 2012). Both physiological variables such as fatigue
(Mulligan, Boland et al. 2012), as well as environmental variables like the
presence/absence of distractions (Echemendia, Herring et al. 2009; Johnson, Kegel et al.
2011), can impact an athlete’s performance on a NC assessment. Likewise, motivation
and effort on the part of the athlete can also significantly impact his/her NC test scores
(Erdal 2012). High false positive rates exceeding 35% on computerized NC assessments,
pointing to this inherent variability in NC test scores (Resch, Driscoll et al. 2013).
Normative Comparisons
Thus, some investigations have looked at normative comparisons as an alternative
method for interpreting NC test scores. In two recent studies, impaired/not impaired
classifications made using normative benchmarks differed minimally from classifications
made using baseline comparisons (Echemendia, Bruce et al. 2012; Schmidt,
Register-Mihalik et al. 2012). Thus, preliminary evidence suggests that, for the college-age
resource-intensive process of obtaining individual baseline NC scores for all athletes (Echemendia,
Bruce et al. 2012; Schmidt, Register-Mihalik et al. 2012).
However, Schmidt and colleagues’ results also point to potential limitations of
normative comparison methods for identifying cognitive impairment. On a test of
mathematical processing ability, normative comparisons classified individuals as
impaired 7.6 times more often than baseline comparisons. This discrepancy likely
resulted due to inherent differences in people’s cognitive abilities which limit some
individuals from performing at a “normal” level (Schmidt, Register-Mihalik et al. 2012).
Thus, it is possible that normative comparison could result in systematically lower or
higher rates of impairment for individuals with above or below average cognitive
abilities, respectively.
Therefore, additional research is needed to understand the most effective method
of interpreting NC test results in sport-related concussion management. Limitations of
normative comparisons may make baseline comparisons the preferred interpretation
method, particularly for certain subgroups. Authorities in sport-related concussion
management have already identified those with a history of concussion and those with
learning disabilities or attention disorders as specific subpopulations for whom baseline
NC testing may be more valuable since these groups demonstrate overall lower
performance on NC tests (Harmon, Drezner et al. 2013). However, evidence on the
reliability of an athlete’s preseason baseline score as a dependable benchmark of his/her
normal cognitive functioning level against which to compare post-injury data is currently
warranted to ensure that return-to-play decisions are made in the most prudent way
CHAPTER III
METHODOLOGY
Participants
This study included 107 (67 male, 40 female; at testing session 1, age = 18.7 ± 1.1
yrs; height = 177.6 ± 12.2 cm; mass = 77.7 ± 19.6 kg) NCAA Division I college
student-athletes who completed the CNS Vital Signs neurocognitive test battery at two different
time points (median time between sessions = 10 weeks; range = 7 to 81 weeks).
Participation by sport for these athletes is listed in Table 3.1. Athletes who sustained a
concussion between these two testing sessions or with diagnosed depression, anxiety
disorders, learning disabilities or attention disorders were excluded from the analysis.
Individuals who had sustained a concussion in the six months preceding initial testing or
reported having vestibular, visual, or balance disorders at either time point were also
excluded.
Instrumentation
CNS Vital Signs is a comprehensive neurocognitive test battery that takes about
30 minutes to complete which has been shown to be both reliable and valid (Gualtieri and
Johnson 2006). The CNS Vital Signs consists of eight different tests. These tests include
visual memory, verbal memory, finger tapping, symbol digit coding, the Stroop Test, the
Brief descriptions of these tests can be found in Table 3.2, and more detailed descriptions
are provided in Appendix A.
Based on these eight subtests, scores were calculated for 9 different clinical
domains. These clinical domains were: (1) verbal memory, (2) visual memory, (3)
psychomotor speed, (4) reaction time, (5) complex attention, (6) cognitive flexibility, (7)
processing speed, (8) executive function, and (9) reasoning (“CNS Vital Signs
Interpretation Guide”). Neurocognition Index (NCI), an aggregate metric of overall
neurocognitive function was also calculated. Automatic reports generated by CNS Vital
Signs include both raw scores and standardized scores with a mean of 100 and standard
deviation of 15 for each of these domains.
Procedures
Athletes reported to the Matthew Gfeller Sport-Related Traumatic Brain Injury
Research Center at the University of North Carolina at Chapel Hill on the day of their team’s
pre-participation examination (baseline time point). Prior to participation, each athlete
signed an informed consent form approved by the university institutional review board.
Pre-season testing occurred at different times based on when an athlete’s competitive
season began. As part of their school’s standard baseline testing program, athletes
completed the CNS Vital Signs test battery on a desktop computer. Athletes were tested
in groups of approximately three people. In order to ensure that the testing environment
was as quiet and distraction-free as possible, dividers were placed between the
all electronic devices and to remain silent throughout the test. For 56 participants, follow
up testing (retest time point) was conducted 10 weeks following the initial baseline (±1
week). For the remaining participants, follow up testing was conducted at the conclusion of an athlete’s competitive season, ranging between 19 to 40 weeks following the initial
baseline. For six participants, follow up testing occurred one year following baseline, and
for five participants, follow up testing was approximately 18 months following initial
baseline. The same testing procedures were repeated in that session.
Data Reduction
Invalid scores were considered to be any score that fell outside of two standard
deviations from the mean on that clinical domain. If an individual had an invalid score at
either time point on a given domain, his or her score for that domain was excluded from
analysis. In addition, if an athlete had an invalid score on any of the clinical domains
(except reasoning) contributing to the NCI, that athlete was removed from the NCI
analysis.
Statistical Analysis
The remaining observations were rank-ordered and grouped into quintiles in each
of the nine CNS Vital Signs clinical domains based on athletes’ raw baseline scores. For
each domain, the participants were categorized into 1 of 5 quintiles based on baseline
scores as follows: 0-20th percentile (lowest 20%), 20-40th percentile, 40-60th percentile (‘average’ category), 60-80th percentile, and 80-100th percentile (highest 20%). The
correlation coefficients and standard deviations for both time points (baseline and retest)
were computed for the lowest quintile, middle quintile, and highest quintile of baseline
scores for each of the nine CNS Vital Signs domains and NCI. From these values, the
RCI outcomes were computed using an identical and systematic approach employed for
each outcome measure and quintile of interest as follows:
(1) Correlation (r) between the two test sessions was determined.
(2) Descriptive statistics included standard deviations (SD) for each outcome measure
derived for each test session.
(3) Standard error of the measurements (SEM) were computed:
𝑆𝐸𝑀 = 𝑆𝐷√1 − 𝑟
(4) Standard error of the difference (SEdiff) was computed:
𝑆𝐸𝑑𝑖𝑓𝑓 = √𝑆𝐸𝑀12+ 𝑆𝐸𝑀22
(5) The SEdiff was multiplied by the z scores associated with 80% (z = 1.282), 90% (z =
1.684), and 95% (z = 1.96) confidence intervals to compute the RCI values for each of
the measures as follows (Iverson, Lovell et al. 2003; Register-Mihalik, Guskiewicz et al.
2013):
RCI = SEdiff x z score
Additionally, we performed 3 (quintile group assignment) x 2 (test session) mixed model
ANOVA to identify whether test-retest scores differed based on group (quintile)
assignment. Data were analyzed using SPSS 19 (SPSS Inc.; Chicago, IL). An a priori α
Table 3.1. Participants by sport
Sport Number of
Subjects
Men’s basketball 6
Women’s basketball 2
Men’s cheerleading 4
Women’s cheerleading 5
Men’s diving 1
Women’s diving 1
Field hockey 1
Football 20
Gymnastics 2
Men’s lacrosse 13
Women’s lacrosse 8
Men’s soccer 16
Women’s soccer 13
Softball 5
Men’s track and field 2
Women’s track and field 3
Table 3.2. Descriptions of CNS Vital Signs subtests
Subtest Cognitive Tasks Assessed
Verbal Memory • Verbal learning
• Memory for words
• Word recognition
• Immediate and delayed recall
Visual Memory • Visual learning
• Memory for geometric shapes
• Geometric shape recognition
• Immediate and delayed recall
Finger Tapping • Motor speed
• Fine motor control
Symbol Digit Coding • Information processing speed
• Complex attention
• Visual-perceptual speed
Stroop Test • Simple reaction time
• Complex reaction time
• Inhibition/disinhibition
• Frontal/executive skills
• Processing speed
Shifting Attention • Executive function
• Rapid decision making
• Reaction time
Continuous Performance • Sustained attention
• Choice reaction time
• Impulsivity
Non-verbal Reasoning • Reasoning
CHAPTER IV
MANUSCRIPT
Introduction
In the United States alone, an estimated 1.6 to 3.8 million sport-related
concussions occur each year (Langlois, Rutland-Brown et al. 2006). Concussion is
defined as “a traumatically induced transient disturbance of brain function…[involving] a
complex pathophysiological process,” and can have numerous adverse short-term effects
including, but not limited to, headaches, balance deficits, sensitivity to light and noise,
and difficulty concentrating (Harmon, Drezner et al. 2013). While symptoms generally
resolve within 7 to 10 days in college athletes, in some cases they may persist for weeks,
months, or even years (Frommer, Gurka, et al. 2011; Makdissi, Darby et al. 2010; Marar,
McIlvain et al. 2012; Meehan, d’Hemecourt et al. 2010). Objective measures are
important for concussion evaluation, because cognitive recovery can lag behind clinical
concussion symptom resolution (Lovell, Collins et al. 2004; McCrea, Barr et al. 2005).
This has prompted the widespread adoption of neurocognitive testing in managing
sport-related concussion over the past 15 years (Echemendia, Iverson et al. 2013). Currently,
several organizations recommend using neurocognitive testing as part of a
comprehensive, multidimensional concussion management program (Harmon, Drezner et
al. 2013; McCrory, Meeuwisse et al. 2013). Although the upfront costs associated with
significant overall cost-advantage to traditional paper-and-pencil tests because they are
less time- and labor-intensive to administer (Collie, Maruff et al. 2004; Ellemberg, Henry
et al. 2009). Therefore, under mounting medicolegal pressure to properly manage
sport-related concussions (Frollo 2013), even under-resourced schools have increasingly
adopted computerized neurocognitive tests. With few clinicians on staff, these tests often
become stand-alone concussion diagnostic tools due to their ease and convenience of use.
An athlete’s neurocognition is generally evaluated during a baseline test prior to
sports participation to establish his or her “normal” level of neurocognitive functioning.
Then following a concussive incident, the athlete takes the same neurocognitive test, and
the results of this post-injury test are compared to the athlete’s baseline performance to
provide some level of objective information with respect to the level of injury severity or
state of recovery. While this baseline/post-injury comparison protocol helps control for
inherent inter-individual differences in cognitive abilities, it depends on an athlete’s
baseline neurocognitive scores’ being truly representative of his or her “normal”
cognitive functioning level.
As with any test, random variability plays a role in determining an individual’s
performance level on a neurocognitive assessment. Exceptionally low neurocognitive test
performance likely results from the interaction of below average cognitive abilities and
unfavorable random variability. Symmetrically, exceptionally high neurocognitive test
performance likely results from the interaction of above average cognitive abilities and
favorable random variability. Thus, regression to the mean theory suggests that, due to
chance alone, exceptionally low performers at baseline will score higher the second time
baseline. Consequently, the reliable change indices (RCIs) for a neurocognitive
assessment may be different for these extreme score ranges as compared to “average”
performers at baseline. Thus, the purpose of this thesis was to compare RCIs for one
commonly used neurocognitive assessment tool, CNS Vital Signs, for three different
ranges of baseline test scores—(1) the lowest quintile (0-20th percentile), (2) the middle quintile (40th-60th percentile), and (3) the highest quintile (80th-100th percentile)—in a large sample of college student-athletes. Different RCIs across these groups would imply
different utility levels of NC testing in helping clinicians and other healthcare providers
make the most prudent return-to-play decisions for their athletes. Additionally, we were
interested in whether test-retest scores differed based on group (quintile) assignment.
Methods
Participants
This study included 107 (67 male, 40 female; at testing session 1, age = 18.7 ± 1.1
yrs; height = 177.6 ± 12.2 cm; mass = 77.7 ± 19.6 kg) NCAA Division I college
student-athletes who completed the CNS Vital Signs neurocognitive test battery at two different
time points (median time between sessions = 10 weeks; range = 7 to 81 weeks).
Participation by sport for these athletes is listed in Table 3.1. Athletes who sustained a
concussion between these two testing sessions or with diagnosed depression, anxiety
disorders, learning disabilities or attention disorders were excluded from the analysis.
Individuals who had sustained a concussion in the six months preceding initial testing or
reported having vestibular, visual, or balance disorders at either time point were also
Instrumentation
CNS Vital Signs is a comprehensive neurocognitive test battery that takes about
30 minutes to complete which has been shown to be both reliable and valid (Gualtieri and
Johnson 2006). The CNS Vital Signs consists of eight different tests. These tests include
visual memory, verbal memory, finger tapping, symbol digit coding, the Stroop Test, the
shifting attention test, the non-verbal reasoning test, and the continuous performance test.
Brief descriptions of these tests can be found in Table 3.2, and more detailed descriptions
are provided in Appendix A.
Based on these eight subtests, scores were calculated for 9 different clinical
domains. These clinical domains were: (1) verbal memory, (2) visual memory, (3)
psychomotor speed, (4) reaction time, (5) complex attention, (6) cognitive flexibility, (7)
processing speed, (8) executive function, and (9) reasoning (“CNS Vital Signs
Interpretation Guide”). Neurocognition Index (NCI), an aggregate metric of overall
neurocognitive function was also calculated. Automatic reports generated by CNS Vital
Signs include both raw scores and standardized scores with a mean of 100 and standard
deviation of 15 for each of these domains.
Procedures
Athletes reported to the Matthew Gfeller Sport-Related Traumatic Brain Injury
Research Center at the University of North Carolina at Chapel Hill on the day of their team’s
pre-participation examination (baseline time point). Prior to participation, each athlete
signed an informed consent form approved by the university institutional review board.
completed the CNS Vital Signs test battery on a desktop computer. Athletes were tested
in groups of approximately three people. In order to ensure that the testing environment
was as quiet and distraction-free as possible, dividers were placed between the
computers, the athletes were given ear plugs and they were instructed to turn off and store
all electronic devices and to remain silent throughout the test. For 56 participants, follow
up testing (retest time point) was conducted 10 weeks following the initial baseline (±1
week). For the remaining participants, follow up testing was conducted at the conclusion
of an athlete’s competitive season, ranging between 19 to 40 weeks following the initial
baseline. For six participants, follow up testing occurred one year following baseline, and
for five participants, follow up testing was approximately 18 months following initial
baseline. The same testing procedures were repeated in that session.
Data Reduction
Invalid scores were considered to be any score that fell outside of two standard
deviations from the mean on that clinical domain. If an individual had an invalid score at
either time point on a given domain, his or her score for that domain was excluded from
data analysis. In addition, if an athlete had an invalid score on any of the clinical domains
(except reasoning) contributing to the NCI, that athlete was removed from the NCI
analysis.
Statistical Analysis
The remaining observations were rank-ordered and grouped into quintiles in each
each domain, the participants were categorized into 1 of 5 quintiles based on baseline
scores as follows: 0-20th percentile (lowest 20%), 20-40th percentile, 40-60th percentile
(‘average’ category), 60-80th percentile, and 80-100th percentile (highest 20%). The
number of observations per quintile (excluding NCI) varied between 19 and 34. Pearson
correlation coefficients and standard deviations for both time points (baseline and retest)
were computed for the lowest quintile, middle quintile, and highest quintile of baseline
scores for each of the nine CNS Vital Signs domains and NCI. From these values, the
RCI outcomes were computed using an identical and systematic approach employed for
each outcome measure and quintile of interest as follows:
(1) Correlation (r) between the two test sessions was determined.
(2) Descriptive statistics included standard deviations (SD) for each outcome measure
derived for each test session.
(3) Standard error of the measurements (SEM) were computed:
𝑆𝐸𝑀 = 𝑆𝐷√1 − 𝑟
(4) Standard error of the difference (SEdiff) was computed:
𝑆𝐸𝑑𝑖𝑓𝑓 = √𝑆𝐸𝑀12+ 𝑆𝐸𝑀22
(5) The SEdiff was multiplied by the z scores associated with 80% (z = 1.282), 90% (z =
1.684), and 95% (z = 1.96) confidence intervals to compute the RCI values for each of
the measures as follows (Iverson, Lovell et al. 2003; Register-Mihalik, Guskiewicz et al.
2013):
RCI = SEdiff x z score
assignment. Post hoc Tukey analyses were also performed to identify significant pairwise
critical differences (dcrit) in baseline versus retest score in each quintile group. Data were
analyzed using SPSS 19 (SPSS Inc.; Chicago, IL). An a priori α level of significance was
set at 0.05 for all analyses.
Results
The overall RCIs and RCIs by quintile for each domain are reported in Table 4.3.
Significant interaction effects were observed for verbal memory (F2,65 = 22.03, P <
0.001), psychomotor speed (F2,56 = 10.48, P < 0.001), reaction time (F2,68 = 7.37, P =
0.001), cognitive flexibility (F2,71 = 8.45, P = 0.001), processing speed (F2,62= 19.03, P <
0.001), executive function (F2,71 = 11.42, P < 0.001), reasoning (F2,82 = 3.29, P = 0.042),
and NCI (F2,36 = 5.80, P = 0.007). Specifically, the lowest quintile performed significantly
better at retest than at baseline on psychomotor speed (dcrit=7.68), reaction time
(dcrit=7.57), cognitive flexibility (dcrit=7.77), processing speed (dcrit=7.28), and executive
function (dcrit=7.50). The highest quintile performed better at baseline than at retest on
verbal memory (dcrit=11.87), processing speed, and reasoning (dcrit=22.40) (P < 0.05 for
all). There were no differences between baseline and retest for the middle quintile group
(P > 0.05). In the absence of a significant interaction effect, we observed a main effect of
time for visual memory (F1,69 = 11.78, P = 0.001) and complex attention (F1,76 = 7.33, P =
0.008), with participants performing better at the first time point than the second time
point. In addition, significant main effects of group were observed for all domains and
NCI (P < 0.05 for all). Table 4.4 includes all descriptive and statistical information for
Discussion
Our main finding was that RCIs varied considerably across the quintile groups for
several CNS Vital Signs clinical domains as well as for NCI. Moreover, our results also
showed that the RCI we determined for each overall domain deviated from the individual
quintile RCI we identified across multiple domains in each quintile group. These results
are significant because they show that the “one-size-fits-all” application of RCIs used by
many computerized neurocognitive assessment tools may lead to higher false-positive
and false-negative rates for subgroups of people who perform differently at baseline.
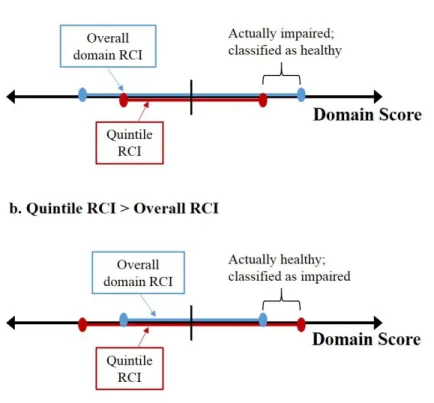
Relying on the overall RCI for quintile groups where the overall RCI exceeds the
quintile-specific RCI could lead to systematic misclassification of cognitively-impaired
individuals as unimpaired (Figure 4.1a); symmetrically, relying on the overall RCI for
groups where the quintile-specific RCI exceeds the overall RCI could lead to systematic
misclassification of healthy individuals as impaired (Figure 4.1b). Thus, investigating
the specificity of each CNS Vital Signs domain as well as the test battery as a whole may
be an interesting avenue for further study.
Specifically, our results suggest that for individuals who score near the mean or
exceptionally well at baseline, even relatively small deviations from baseline scores may
denote clinically meaningful differences. This implies that clinicians should exercise
particular caution in evaluating these athletes’ neurocognitive recovery from a concussion
since automated reports generated by computerized neurocognitive test batteries may not
flag all significant changes from baseline performance. In contrast, our results suggest
made by computer-generated reports may lead to overly-conservative management of
concussions given the generally larger RCIs we determined for this group. These larger
RCIs found in the low baseline performers likely resulted because of a number of factors.
These may include the presence of distractions, fatigue, and lack of effort which can lead
to poor neurocognitive test performance even in the absence of low cognitive abilities
(Erdal 2011; Johnson, Kegel et al. 2011; Mulligan, Boland et al. 2012). Thus, for these
low-scoring individuals, baseline/post-injury comparisons of neurocognitive test scores
may have limited value since the “normal” (unimpaired) score range for these athletes
may be too large to provide clinicians with meaningful information about an athlete’s
neurocognitive functioning level. Although using normative comparisons to interpret
neurocognitive test results is one potential alternative, this method may also result in
overly conservative concussion management for the subset of these low baseline
performers with below average cognitive abilities (Echemendia, Iverson, et al. 2013;
Schmidt, Register-Mihalik et al. 2012). While we did not directly measure this, we
speculate that most of the low-performers were individuals with lower cognitive abilities,
but acknowledge that many factors (described earlier) may adversely affect test
performance such that lower-than-expected scores are measured. Therefore, while
neurocognitive testing as a whole has been shown to add value in managing sport-related
concussions and continues to be recommended as part of a multidimensional approach to
concussion management, our results suggest that neurocognitive testing may have more
limited application for those who score poorly at baseline (Harmon, Drezner et al. 2013;
McCrory, Meeuwisse et al. 2013; Van Kampen, Lovell et al. 2006). That is, individuals
tripping any built-in validity checks the test battery may incorporate should be candidates
for rebaselining so that more meaningful baseline/post-injury comparisons can be made.
Alternatively, for individuals with only one or two very low baseline scores, it may
suffice for clinicians to flag these low-performance domains and apply less conservative
RCIs to these domain scores in interpreting post-injury test results. More broadly, our
results highlight potential problems with indiscriminately drawing conclusions based on
convenient end-user reports generated by computerized neurocognitive assessments and
underscore the importance of having qualified clinicians to interpret neurocognitive test
results.
More generally, it was also notable that the overall RCIs for the clinical domains
found in this study appeared to be considerably larger than those reported by Littleton,
Register-Mihalik, et al. in a forthcoming publication. While our 80% RCIs ranged from
14.86 to 51.41, the 80% RCIs found by Littleton, Register-Mihalik et al. ranged from
9.44 to 20.22. These large discrepancies in RCIs resulted in part due to the lower Pearson
r correlations observed in this study (0.08 to 0.60) as compared to those observed in Littleton’s study (0.11 to 0.87). Our correlations were also lower than those previously
reported by Gualtieri and Johnson (0.31 to 0.88) and Cole, Arrieux, et al. (0.34 to 0.79).
In addition, particularly large standard deviations at retest for visual memory, complex
attention, and reasoning contributed to the wide RCIs we found for these domains. These
large standard deviations resulted from very low retest scores which remained in the
analysis despite removing scores with a |z| > 2. The persistence of these values
underscores the importance of using neurocognitive testing as one tool in concussion
These unusually low correlations and large standard deviations may have resulted
from a number of different factors. Because baseline testing for the student-athletes in
this study was mandatory and no incentives were provided to participants during
follow-up testing, submaximal effort may be one factor contributing to the low correlations and
large retest standard deviations we observed. In addition, the longer test-retest time interval as compared to Littleton et al. and Cole et al.’s studies may have also contributed
to the lower correlations. Notably, the longer and more diverse range of test-retest time
intervals used in this study as compared to the consistent 1-week and 1-month intervals
used by Littleton and Cole, respectively, more closely approximates the true, uncertain
length of time which may pass between baseline and post-injury testing for an athlete,
and therefore may be more clinically relevant. Different study populations may explain
some of the disparity in the correlations found as well; Littleton’s study included
recreationally active college students while Cole’s study focused on active-duty members
of the United States military in contrast to this study which included only NCAA
Division I varsity student-athletes.
Furthermore, mixed-model ANOVA analysis and subsequent Tukey post hoc
results provided evidence that low performers at baseline had systematically inflated
scores at retest, and high performers at baseline had systematically deflated scores at
retest for select domains (specifically verbal memory, processing speed, and reasoning).
These results provide further evidence that baseline/post-injury comparisons may be an
ineffective method of determining cognitive impairment following a concussion for those
who scored poorly at baseline. These findings also suggest that for high baseline
speed, or reasoning to determine an athlete’s impairment status post-injury since 8 to 10
point declines in these domain scores are expected for this group. Additionally, with the
exception of processing speed, none of the domains which showed systematic
improvement for low baseline performers overlapped with those that demonstrated a
systematic decline among high baseline performers. For poor performers at baseline, the
domains demonstrating systematic score inflation related to cognitive speed; whereas,
domains showing consistent score deflation generally related to information recall for
high performers at baseline.
Moreover, the two domains (visual memory and complex attention) where no
significant interaction effect was found were both domains with very large RCIs, which
resulted from large retest standard deviations. These same large standard deviations may
explain why significant interactions were not found in these domains. Our ANOVA
analyses also revealed that participants improved overall fromm baseline to retest on
visual memory, psychomotor speed, and reaction time, which is consistent with previous
findings on practice effects for computerized neurocognitive assessments. Littleton et al.
similarly found significant practice effects on psychomotor speed, reasoning, and reaction
time for CNS Vital Signs, and other researchers have demonstrated practice effects for
analogous reaction time and motor processing speed domains on similar computerized
neurocognitive assessment tools like ImPACT and Automated Neuropsychological
Assessment Metrics (ANAM) (Elbin, Schatz et al 2011; Register-Mihalik, Kontos et al.
2012; Register-Mihalik, Guskiewicz et al. 2013). Our ANOVA analyses also revealed
unique overall declines in performance from baseline to retest on visual memory and
participants at the retest time point or may have been unique to this study due to the
longer and more variable test-retest timeframe.
Finally, while this study focused on computerized neurocognitive assessments in
contrast to traditional paper-and-pencil neurocognitive tests, similar results may be found
for such paper-and-pencil tests. Because factors other than an individual’s neurocognitive
functioning level like random variability, fatigue, and stress similarly influence these two
variations of neurocognitive tests, the RCIs for paper-and-pencil tests will likely also
vary considerably across different initial performance ranges on these tests. However, the
pattern of variability observed may differ from that observed for CNS Vital Signs since
paper-and-pencil neurocognitive tests are influenced by a unique set of factors, and this
may be an interesting area for further study.
Limitations
This study was limited to healthy, Division I NCAA student-athletes, and
therefore the results may not be generalizable to other populations. Another limitation
was the exclusive use of CNS Vital Signs—one of many different neurocognitive test
batteries available to clinicians—in this study. Additionally, because baseline testing was
mandatory for all student-athletes and no incentives were provided for completion of
follow-up testing, lack of full effort being given by participants was another potential
limitation of this study. Furthermore, the persistence of very low retest scores even after
removing scores falling outside of two standard deviations from the mean was another
limitation of this study; removing outliers based on the 1.5*[Interquartile range (IQR)]
future investigations since IQR is more resistant to the effects of outliers than standard
deviation.
Conclusions and Clinical Implications
Our results demonstrate that RCIs vary considerably from one performance
quintile to another for several CNS Vital Signs clinical domains, as well as for NCI.
These results suggest that clinicians using CNS Vital Signs need to be aware of an
athlete’s baseline performance level when interpreting his or her results using the
baseline/post-injury comparison model. Specifically, clinicians should recognize that for
average and very high performers at baseline, even relatively small deviations from
baseline performance (those smaller than the overall RCIs for that domain) may be
clinically-meaningful. In contrast, clinicians should expect greater deviations from
baseline performance for those who initially scored poorly on a particular domain, and
they may need to apply less conservative RCIs in interpreting post-injury test scores for
these individuals. In addition, clinicians who currently use the 95% of baseline method in
determining impairment should exercise particular caution in clearing low baseline
performers on psychomotor speed, reaction time, cognitive flexibility, processing speed
and/or executive function to return to play since above-average gains in performance on
these domains are expected for these individuals. Conversely, clinicians who use the 95%
of baseline approach should expect 8 to 10 point declines in performance on verbal
memory, processing speed, and reasoning, in the absence of lingering cognitive deficits,
and therefore should be cautious about holding athletes out of participation based on
investigations of the consistency of RCIs and test-retest score differences across different
baseline score ranges for other commonly used computerized neurocognitive test
Table 4.1. Participation by sport
Sport Number of
Subjects
Men’s basketball 6
Women’s basketball 2
Men’s cheerleading 4
Women’s cheerleading 5
Men’s diving 1
Women’s diving 1
Field hockey 1
Football 20
Gymnastics 2
Men’s lacrosse 13
Women’s lacrosse 8
Men’s soccer 16
Women’s soccer 13
Softball 5
Men’s track and field 2
Women’s track and field 3
Table 4.2. Description of CNS Vital Signs subtests
Subtest Cognitive Tasks Assessed
Verbal Memory • Verbal learning • Memory for words • Word recognition
• Immediate and delayed recall
Visual Memory • Visual learning
• Memory for geometric shapes • Geometric shape recognition • Immediate and delayed recall
Finger Tapping • Motor speed • Fine motor control
Symbol Digit Coding • Information processing speed • Complex attention
• Visual-perceptual speed
Stroop Test • Simple reaction time • Complex reaction time • Inhibition/disinhibition • Frontal/executive skills • Processing speed
Shifting Attention • Executive function • Rapid decision making • Reaction time
Continuous Performance • Sustained attention • Choice reaction time • Impulsivity
Non-verbal Reasoning • Reasoning
39
Table 4.3. Overall domain reliable change indices (RCIs) and RCIs for each quintile
CNS Vital Signs Domain
Reliable Change Indices
80% 90% 95%
Entire
Sample Lowest Middle Highest
Entire
Sample Lowest Middle Highest
Entire
Sample Lowest Middle Highest Verbal Memory 25.80 25.52 23.93 22.58 33.10 32.75 30.70 28.98 39.44 39.02 36.58 34.53 Visual Memory 50.28 57.86 35.99 45.67 64.52 74.24 46.18 58.61 76.88 88.46 55.03 69.83 Psychomotor Speed 14.98 19.90 12.50 9.67 19.23 25.54 16.04 12.41 22.91 30.43 19.11 14.79 Reaction Time 14.86 17.77 13.78 11.38 19.06 22.80 17.68 14.61 22.71 27.17 21.06 17.40 Cognitive Flexibility 15.75 16.40 15.75 17.46 20.21 21.05 20.21 22.40 24.08 25.08 24.08 26.69 Complex Attention 29.76 29.97 36.01 18.42 38.19 38.46 46.21 23.64 45.50 45.82 55.06 28.16 Processing Speed 17.25 16.70 11.44 13.81 22.14 21.43 14.69 17.72 26.38 25.54 17.50 21.12
Executive
40
Table 4.4. Effect of time and quintile on CNS Vital Signs domain scores
CNS Vital Signs Domain
Mean (95% CI)
N F-value (P-value)
Baseline Retest Time main effect Group main effect Time* Group Interaction
Verbal Memory
Lowest 78.90 (76.64, 81.15) 99.84 (92.27, 107.42) 20
F1, 65 = 0.00 P= 0.949
F2,65 = 50.61a,b,c [P< 0.001]
F2, 65 = 22.03e [P< 0.001] Middle 105.71 (103.70, 107.71) 97.46 (90.72, 104.20) 24
Highest 121.24 (119.28, 123.21) 108.12 (101.52, 114.72) 26 Visual
Memory
Lowest 81.86 (79.95, 83.76) 75.76 (59.47, 92.06) 21
F1, 69 = 11.78 [P= 0.001]
F2, 69 = 14.30a,b,c [P< 0.001]
F2, 69 = 1.02 [P= 0.367] Middle 103.90 (102.28, 105.52) 85.03 (71.17, 98.90) 29
Highest 120.18 (118.32, 122.04) 99.05 (83.12, 114.97) 23 Psychomotor
Speed
Lowest 90.60 (88.31, 92.89) 104.45 (99.97, 108.93) 20
F1, 56 = 9.96 [P= 0.003]
F2, 56 = 91.73a,b,c
[P< 0.001]
F2, 56 = 10.48d
[P< 0.001] Middle 105.60 (103.31, 107.89) 108.15 (103.67, 112.63) 22
Highest 122.58 (120.23, 124.93) 120.21 (115.62, 124.80) 19 Reaction
Time
Lowest 85.46 (83.23, 87.68) 96.73 (92.36, 101.09) 23
F1, 68 = 7.46 [P= 0.008]
F2, 68 = 128.98 a,b,c [P< 0.001]
F2, 68 = 7.37d [P= 0.001] Middle 104.59 (102.65, 106.53) 103.66 (99.86, 107.43) 23
Highest 118.70 (116.36, 121.04) 119.85 (115.27, 124.43) 21
Complex Attention
Lowest 75.71 (71.86, 79.57) 77.95 (66.41, 89.49) 21 F1, 76 =
7.33 [P= 0.008]
F2, 76 = 33.28a,b,c
[P< 0.001]
F2, 76 = 2.86 [P= 0.063] Middle 106.59 (103.56, 109.62) 93.38 (84.31, 102.45) 36
Highest 120.42 (116.81, 124.02) 108.46 (97.66, 119.25) 24 Cognitive
Flexibility
Lowest 81.71 (79.53, 83.90) 89.62 (83.98, 95.26) 22
F1, 71 = 0.45 [P= 0.505]
F2, 71 = 69.93a,b,c
[P< 0.001]
F2, 71 = 8.45d
[P= 0.001] Middle 102.93 (101.04, 104.82) 104.75 (99.86, 109.64) 24
Highest 115.56 (113.56, 117.56) 108.72 (103.55, 113.89) 25 Processing
Speed
Lowest 86.50 (84.22, 88.78) 99.32 (95.27, 103.37) 23
F1, 62 = 1.28 [P= 0.262]
F2, 62 = 105.34a,b,c
[P< 0.001]
F2, 62 = 19.03d,e
[P< 0.001] Middle 102.50 (100.31, 104.69) 102.21 (98.33, 106.09) 19
Highest 121.47 (119.02, 123.93) 113.58 (109.22, 117.94) 19
Executive Function
Lowest 79.82 (76.43, 83.21) 89.77 (84.55, 94.99) 23 F1, 71 =
1.02 [P= 0.317]
F2, 71 = 58.90a,b,c
[P< 0.001]
F2, 71 = 11.42d
[P< 0.001] Middle 102.13 (99.27, 104.99) 103.74 (99.34, 108.14) 27
Highest 115.91 (112.43, 119.38) 108.57 (103.23, 113.92) 21
Reasoning
Lowest 78.74 (77.11, 80.37) 75.07 (59.76, 90.39) 27
F1, 82 = 17.93 [P< 0.001]
F2, 82 = 8.46b
[P< 0.001]
F2, 82 = 3.29e
[P= 0.042] Middle 98.83 (97.26, 100.40) 78.17 (63.40, 92.95) 31
Highest 114.59 (113.01, 116.16) 83.55 (68.78, 98.33) 30
NCI
Lowest 90.20 (88.08, 92.32) 103.9 (94.74, 113.06) 11
F1, 36 = 0.31 [P= 0.581]
F2, 36 = 10.60b,c [P< 0.001]
F2, 36 = 5.80 [P= 0.007] Middle 105.07 (103.33, 106.80) 101.2 (93.72, 108.68) 16
Highest 113.50 (111.71, 115.29) 107.714 (99.97, 115.46) 14
REFERENCES
“About ImPACT.” Retrieved from http://www.impacttest.com/about/.
Barkhoudarian, G., R. C. Cantu, et al. (2011). “The molecular pathophysiology of concussive brain injury.” Clin Sports Med 30(1): 33-48.
Bleiberg, J. and D. Warden (2005). “Duration of cognitive impairment after sports concussion.” Neurosurgery 56(5): E1166.
Bleiberg, J., A. N. Cernich, et al. (2004). "Duration of cognitive impairment after sports concussion." Neurosurgery 54(5): 1073-78; discussion 1078-80.
Broglio, S. P., M. S. Ferrara, et al. (2007). "Concussion is not a predictor of computerised concussion assessment performance." Br J Sports Med 40(9): 802-5.
Broglio SP, Macciocchi SN, et al. (2007). “Sensitivity of the concussion assessment battery.” Neurosurgery 60(6):1050–7; discussion 1057–1058.
Collie, A., P. Maruff, et al. (2004). “Statistical procedures for determining the extent of cognitive change following concussion.” Br J Sports Med 38(3): 273–8.
Collins, M. W., G. L. Iverson, et al. (2003). “On-field predictors of neuropsychological and symptom deficit following sports-related concussion.” Clin J Sport Med 13(4): 222-9.
Collins, M. W., S. H. Grindel, et al. (1999). "Relationship between concussion and neuropsychological performance in college football players." JAMA 282(10): 964-70.
Colvin, A.C., J. Mullen, et al. (2009). “The role of concussion history and gender in recovery from soccer-related concussion.” Am J Sports Med 37(9):1699–704.
Covassin, T., C. B. Swanik, et al. (2003). “Epidemiological considerations of concussions among intercollegiate athletes.” Appl Neuropsychol10(1): 12-22.
Covassin, T., R. J. Elbin, et al. (2012). “The role of age and sex in symptoms, neurocognitive performance, and postural stability in athletes after concussion.” Am J Sports Med 40(6):1303–12
Dick, R.W. (2009). “Is there a gender difference in concussion incidence and outcomes?” Br J Sports Med 43(Suppl 1): i46–50.
Echemendia, R. J., G. L. Iverson, et al. (2013). “Advances in neuropsychological assessment of sport-related concussion.” Br J Sports Med 47(5): 294-8.
Echemendia, R. J., J. M. Bruce, et al. (2012). “The utility of post-concussion
neuropsychological data in identifying cognitive change following sports-related MTBI in the absence of baseline data.” Clin Neuropsychol 26(7):1077-91. Echemendia, R. J., S. Herring, et al. (2009). ”Who should conduct and interpret the
neuropsychological assessment in sports-related concussion?” Br J Sports Med
43(Suppl 1):i32–5.
Ellemberg, D., L. C. Henry, et al. (2009). “Advances in sport concussion assessment: from behavioral to brain imaging measures.” J Neurotrauma 26(12): 2365–82.
Erdal, K. (2012). “Neuropsychological testing for sports-related concussion: how athletes can sandbag their baseline testing without detection.” Arch Clin Neuropsychol
27(5):473–9.
Fazio V.C., M.R. Lovell, et al. (2007). “The relation between post concussion symptoms and neurocognitive performance in concussed athletes.” NeuroRehabilitation
22(3):207–16.
Frollo, J. (2013, April 21). See where your state stands on concussion law. USA Football.
Retrieved April 12, 2014, from usafootball.com.
Frommer, L. J., K. K. Gurka, et al. (2011). “Sex differences in concussion symptoms of high school athletes.” J Athl Train 46(1): 76-84.
Gessel, L. M., S. K. Fields, et al. (2007). “Concussion among United States high school and collegiate athletes.” J Athl Train 42(4): 495-503.
Giza, C. C. and D. A. Hovda (2001). "The Neurometabolic Cascade of Concussion." J Athl Train 36(3): 228-235.