FOOD SECURITY IN RELATION TO DIABETES MANAGEMENT AND ASSESSMENT OF FOOD SECURITY STATUS IN CHILDREN WITH DIABETES
MELLITUS
Violet Noe Senior Honors Thesis Department of Nutrition
University of North Carolina at Chapel Hill 2018
ABSTRACT
Food insecurity (FI) and diabetes are common in youth in the United States. FI has been consistently associated with poorer glycemic control and poorer diet quality among adults with diabetes, but there is limited research on these associations in children. Furthermore, the
Household Food Security Survey Module (HFSSM), the most commonly used tool to assess FI,
has been shown to be an adequate measure of FI at both the population and the individual level,
but little to no research exists on the use of this survey tool in pediatric patients with diabetes.
This study aimed to investigate FI in relationship to hemoglobin A1c (HbA1c) and diet quality as well as the use of the HFSSM to measure household FI of children with diabetes. Participants were youth ages 7-19 recruited from the University of North Carolina Hospitals’ Pediatric Endocrinology clinic (N=30, mean age 13.9, mean HbA1c 9.0%). Data were collected through
an electronic questionnaire and through individual interviews. HbA1c was collected from the
medical record. No significant differences were found between FI status and HbA1c or diet
quality. Interviews were conducted using a semi-structured interview guide and discussions were
audio-taped, transcribed, and analyzed using standard inductive qualitative methods. Interview
data indicated that parents from food insecure households made efforts to shield their children
from the effects of FI by reducing or altering their own food intake and indicated that parents had
worry or anxiety about and prior difficulty with FI negatively impacting their child’s diabetes
management. Interpretation of some of the questions of the HFSSM also differed between
parents from food insecure households and parents from food secure households. Given the small
sample size of this study, more research is needed in the future to test associations between FI
status and diabetes management and diet quality in children as well as investigate the use of the
ACKNOWLEDGEMENTS
This original research involved that analysis of data obtained from patients and their
parents from the UNC Hospitals’ Pediatric Endocrinology clinic. I would like to thank my
advisor and mentors Elizabeth J. Mayer-Davis, PhD, Nina Jain, MD, and Daria Igudesman at the
University of North Carolina Chapel Hill and Angela Liese, PhD at the University of South
Carolina, whose constructive advice, support, and statistical analysis assistance made this
TABLE OF CONTENTS
LIST OF TABLES………....iv
CHAPTERS I. INTRODUCTION AND STUDY AIMS………..………1
II. LITERATURE REVIEW...4
Diabetes Description………...……….4
T1D and T2D Incidence………...4
T1D and T2D Prevalence……….4
Complications………..5
Microvascular Complications………..5
Macrovascular Complications……….7
Management……….7
Food Insecurity………8
Food Insecurity Prevalence………..9
Food Insecurity and Food Assistance Programs………..9
Food Insecurity and Diet Quality………...10
Food Insecurity and Management of Diabetes………..12
Assessment of Food Insecurity: Household Food Security Survey Module………….…13
Assessment in Children with Diabetes………..14
III. MANUSCRIPT………...15
Abstract………..16
Introduction………17
Methods………..19
Results………22
Discussion………..27
Strengths and Limitations………..30
Conclusions………32
LIST OF TABLES
Table 1 – Recruitment Outcomes………..23
Table 2 – Demographic Characteristics of All Participants………...…23
Table 3 – Clinical Characteristics………..24
Table 4 –Mean HbA1c and p-value for food secure and food insecure groups………24
Table 5 – Participation in Food Assistance Programs………...24
Table 6 – Mean Dietary Intakes for All Participants……….24
Chapter I
INTRODUCTION AND STUDY AIMS
Diabetes mellitus is a chronic disease characterized by the inability of the body to
produce sufficient insulin or respond properly to insulin.1 Insulin is crucial for proper regulation
of glucose in the blood. Glucose levels that are above normal can result in long-term damage,
dysfunction, and failure of several organs including the eyes, kidneys, nerves, heart, and blood
vessels.1 Proper self-management of diabetes is critical to preventing chronic complications,
especially for children who are at an increased risk of suffering from long-term complications
due to longer average duration of disease.2
One of the key components to diabetes self-management is diet. Food insecurity, which is
defined as “limited or uncertain availability of nutritionally adequate and safe foods or limited or
uncertain ability to acquire acceptable foods in socially acceptable ways”, may impact one’s
ability to adhere to a diabetic diet.3 Food-insecure individuals may shift their dietary intake
towards less expensive but more calorie-dense foods that make glycemic control more difficult
to achieve, such as refined carbohydrates, added sugars or added fats, and away from more
expensive foods such as fruits and vegetables.4 Thus food-insecurity may make diabetes
self-management more difficult.
While food insecurity has been associated with poorer diet quality and poorer glycemic
control among adults with diabetes, these associations have been less consistent among children.5
The effects of food insecurity on diet quality and glycemic control may not be as intense for
children with diabetes as they are for adults because food insecure-households may prioritize
chronic illness may receive even greater priority in food-insecure households. The relationship of
food security to diet quality and glycemic control may be further influenced by free and
reduced-price school meals, which could potentially provide food-insecure children with access to
nutritious meals that they may otherwise not have. Little to no research has been conducted on
the association between food security status and receipt of free and reduced-price school meals.
Thus this study aims to investigate the potential relationship of food security to HbA1c and to
diet quality among children with diabetes as well as to explore the relationship between food
security and receipt of free and reduced-price meals to inform future larger studies.
Furthermore, this project aims to investigate the use of the Household Food Security
Survey Module (HFSSM), the most commonly used tool to assess food security, in children with
diabetes. The HFSSM has been shown to be an adequate measure of food security at both the
population and the individual level, but little to no research exists on the use of this survey tool
in subgroups of the population, including pediatric patients with diabetes.6 The HFSSM consists
of questions regarding anxiety about household food supply, perceptions of food supply being
inadequate, adjustments to food intake, and the experience of running out of food.7 These
questions, however, do not take into account additional concerns that may be experienced
regarding diabetes management. Thus the proposed project aims to investigate how parents of
children with diabetes are interpreting and understanding the questions of the HFSSM and if
SPECIFIC AIMS
Aim 1. To investigate the relationship of food security status to hemoglobin A1c (HbA1c), receipt of free and reduced-price meals, and diet quality among children with diabetes. I hypothesize that youth from food insecure households will have higher HbA1c and poorer diet quality than youth who are food secure.
Aim 2. To receive qualitative feedback from parents of children with diabetes regarding the questions of the HFSSM and experiences with food shortages as they relate to diabetes management.
Chapter II
LITERATURE REVIEW Diabetes description
There are two major types of diabetes, Type 1 Diabetes (T1D) and Type 2 Diabetes (T2D), although diabetes can also develop during pregnancy or as a result of drug or chemical toxicity, genetic disorders, insulin receptor disorders, and diseases of the pancreas or endocrine glands.8 T1D is an autoimmune disorder in which the beta cells of the pancreas are destroyed.1 The beta cells of the pancreas release insulin, and thus when these cells are destroyed, insulin secretion is significantly impaired. T2D is characterized by both impaired insulin secretion by the pancreatic beta cells and resistance to the action of insulin.9
T1D and T2D Incidence
According to the most recent research, the incidence of both T1D and T2D among youths from 10 to 19 years of age in the United States has increased significantly from 2002-2012.10 The unadjusted estimated incidence rates of T1D increased by 1.4% annually, while T2D increased by 7.1%. The annual increase in T1D was greater among Hispanics than among non-Hispanic whites (4.2% vs. 1.2%, P<0.001) and the relative annual increase in T2D was lower among non-Hispanic whites than among non-Hispanic blacks, Asians or Pacific Islanders, and Native Americans (P<0.05 for all comparisons).10
T1D and T2D prevalence
per 1000 (95% CI, 1.88–1.97) in 2009. Prevalence of T2D increased 35.0% (95% CI, 21.4%– 50.0%) from 0.34 per 1000 (95% CI, 0.31–0.37) in 2001 to 0.46 per 1000 (95% CI, 0.43–0.49) in 2009. The increase in prevalence was significant in both males and females, all age-groups, and in white, Hispanic and black youth, but was not significant among Asian Pacific Islanders and American Indians.11
Complications
Diabetes mellitus can result in a number of both acute and long-term complications. Acute complications of diabetes include diabetic ketoacidosis from hyperglycemia and coma as the result of hypoglycemia (mechanisms of diabetes complications).12 Long-term complications can be separated into microvascular and macrovascular complications. Microvascular
complications of diabetes include diabetic retinopathy, nephropathy, and neuropathy.
Marcovascular complications include coronary artery disease, peripheral artery disease, and stroke.12
Microvascular complications
is very low among children, the American Academy of Pediatrics recommends that screening begin 3 to 5 years after diagnosis in children who are 9 years of age or older.2
Diabetic nephropathy is the leading cause of end-stage renal failure in the United States.12 For individuals with diabetes, nephropathy is defined as a loss of greater than 500 mg of albumin in 24 hours. Nephropathy is preceded by microalbuminuria, which is characterized by lower levels of loss of albumin at 30-299 mg excreted in 24 hours.12 Microalbuminuria develops shortly after diabetes onset in 25 to 50% of pediatric patients and gross proteinuria develops in one-fifth of patients 7 to 10 years after diagnosis.2 Furthermore, nephropathy is a major risk factor for the development of heart attacks and strokes. In children with T1D, initial screening for nephropathy is recommended at 2 years after diagnosis and then annually thereafter. However, if T1D
diagnosis occurs before the onset of puberty, screening is recommended 5 years after disease onset and not before the age of 9 years. In T2D, screening begins upon diagnosis and annually thereafter.2
Marcovascular complications
The central pathological mechanism in macrovascular disease is atherosclerosis, which is characterized by narrowing of arterial walls throughout the body as a result of chronic
inflammation and injury to the arterial walls.12 Diabetes increases the risk for cardiovascular disease, and recent studies have found that the risk of myocardial infarction (MI) in individuals with diabetes is equivalent to the risk in nondiabetic individuals with a previous history of MI.12 While macrovascular complications are rare in children and young adults, one study involving youth with T1D, T2D, and nondiabetic youth found that youth with T2D had a significantly higher risk of macrovascular complications compared to youth with T1D and nondiabetic youth.16
Management
Both macrovascular and microvascular complications of diabetes are strongly associated with magnitude and duration of hyperglycemia.12 Therefore, good control of blood glucose is essential for preventing and managing complications. Since carbohydrate is the primary
While the quantity of dietary carbohydrate primarily influences postprandial glucose levels, the type of carbohydrate also influences glucose levels. The glycemic index of a
carbohydrate-containing food measures the postprandial glucose response to that food.17 Foods with low glycemic indexes contain dietary constituents such as fiber, fructose, lactose, and fat, including oats, barley, bulgur, beans, lentils, legumes, pasta, pumpernickel bread, apples,
oranges, milk, yogurt, and ice cream. For individuals consuming a high-glycemic index diet, the ADA reports that a low-glycemic index diet can be beneficial for producing a modest decrease in HbA1c.17
In addition to recommendations regarding dietary carbohydrate, the ADA also recommends managing dietary fat and cholesterol intake. These recommendations include limiting saturated fat to less than 7% of total caloric intake, limiting dietary cholesterol to less than 200 mg per day, avoiding trans fats, and consuming at least two servings of fish per week to obtain omega-3 polyunsaturated fatty acids.17 The primary objective behind these
recommendations is to reduce the risk for cardiovascular disease. Food Insecurity
The USDA defines food insecurity as a lack of access to enough food for an active, healthy life style, at all times and for all household members.18 Household food security status is measured along a continuum consisting of four different categories: high food security, marginal food security, low food security, and very low food security. Food secure households have no problems, or anxiety about, accessing food. Marginally food secure households experience a few instances of problems or anxiety about accessing adequate food, but food intake is not
Households with very low food security experience multiple instances of disrupted eating patterns and reduced food intake.18
Food Insecurity Prevalence
According to the USDA, 12.3% (15.6 million) of U.S. households classified as food insecure in 2016.19 Of these food insecure households, 7.4% (9.4 million) had low food security and 4.9% (6.1 million) had very low food security. The prevalence of food security in North Carolina is above the national average at 15.1 %, almost 4 million households in North Carolina. The prevalence of very low food insecurity is also higher in North Carolina at 5.7%. The rate of food insecurity is substantially higher among households with children (16.5 percent) compared to households without children (10.5 percent). Of the 16.5% of food insecure households with children, only adults were food insecure in 8.5% of households, while both children and adults were food insecure in 8% of households.19
Prevalence of food insecurity has fluctuated over the past decade. Food insecurity significantly increased from 2007 to 2008 and remained unchanged until 2011 when food insecurity began to decline. There has been an overall downward trend in food insecurity since 2011. Most recently, food insecurity significantly declined from 2014 to 2015, but the decline was not statistically significant from 2015 to 2016.19
Food Insecurity and Food Assistance Programs
significantly reduce food insecurity. In one study conducted by the USDA, SNAP, which provides a monthly supplement for food purchasing to low-income individuals and families in the U.S., was associated with a 5-10% decrease in food insecurity.21 Other research sponsored by the USDA found that children receiving free or reduced-price lunches though NSLP consume fewer empty calories and more fiber, milk, fruit, and vegetables than children who were eligible but did not participate.22 Participants were also more likely than eligible nonparticipants to have adequate intakes of calcium, vitamin A, and zinc.22 Various studies have also found that
participation in the NSLP is associated with significantly lower rates of food insecurity for households with children.22
Food Insecurity and Diet Quality
intake and positively associated with refined grain consumption.25 Another study involving 92 low-income fourth-grade student-parent pairs in Maryland found that children with low food security status reported higher fruit intake than those with marginal or high food security status (1.6 ± 1.3 vs 0.9 ± 1.0, respectively; P < .01), but when stratified by participation in school nutrition programs, children with low food security status reported lower daily vegetables intakes compared with other children (0.3 ± 0.4 vs 0.6 ± 0.8, P = .04).26
Perhaps most noteworthy to the associations between food insecurity and diet quality observed in both children and adults in the U.S. is a systematic review that found that food insecurity is adversely associated with diet quality in adults, but this association may not be as strong among children.5 The review found 170 associations between food insecurity and diet quality in adults and found substantial evidence that food insecure adults consumed fewer vegetables, fruit and dairy products and had lower intake of vitamins A and B6, calcium, magnesium, and zinc when compared to food secure adults. However, the 130 associations between food insecurity and diet quality in children only revealed one consistent association, an adverse association between fruit consumption and food insecurity. There was limited evidence of an adverse association between food insecurity and consumption of dairy in boys aged 8-11 years and young children aged 3-6 years. There was also limited evidence of adverse
Food Insecurity and Management of Diabetes
Disruptions to food quality and quantity that occur in food insecurity can have major implications for those with diet-sensitive chronic diseases such as hypertension, hyperlipidemia, and diabetes.27 For an individual with diabetes, eating a set amount of carbohydrate per day is crucial for keeping blood glucose under good control. Those who are food-insecure may have more difficulty consuming a consistent amount of carbohydrates. When money for food is limited, purchasing cost-efficient foods may become a priority in order to meet caloric needs.28 The most cost-efficient foods are ones that are high in carbohydrates, such as bread, pasta, sweets and rice, while the least-cost efficient are fruits and vegetables.28 Individuals with food insecurity and diabetes may also struggle to obtain the supplies and medications needed to manage their diabetes due to limited financial resources.29 Many are faced with the difficult decision of choosing between purchasing healthy food or purchasing diabetes medications and supplies.30
A cross-sectional survey conducted as part of the Immigration, Culture, and Healthcare Study consisting of 711 participants concluded that food insecurity is an independent risk factor for poor glycemic control among individuals receiving care for diabetes in safety net clinics, finding that food insecure individuals with diabetes were significantly more likely than food-secure individuals to have an HbA1c ≥ 8.5% (42 vs. 33%; adjusted odds ratio 1.48 [95% CI 1.07–2.04]).28 Food-insecure individuals were also more likely to report difficulty following a diabetic diet (64 vs. 49%, P < 0.001).
(95% CI 1.10, 5.09) of HbA1c ≥9.0% compared to youth from food-secure households.29 Youth from food-insecure households also had a higher prevalence rate of hospitalizations (PR = 2.95; 95% CI [1.17, 7.45], p = 0.02).29 In another study conducted in Canada that interviewed 183 families, the mean HbA1c and rate of hospitalization (30% vs 10.5%, P=0.02) were both also higher among children from food-insecure households than among children from food-secure households.31
Assessment of Food Insecurity: Household Food Security Survey Module
Many tools have been developed for measuring food insecurity in the United States, including the Household Food Insecurity Access Scale (HFIAS), the Household Hunger Scale (HHS), and the Radimer/Cornell Hunger Scale, but the most common measure that has been used in the U.S. since 1995 is the Household Food Security Survey Module (HFSSM).32 The HFSSM measures the levels of food insecurity experienced within the last 12 months and
consists of 10 questions for households without children and an additional 8 questions for a total of 18 questions for households with children. These questions encompass four domains of food insecurity, including anxiety about food supplies, perceptions that the quality or quantity of accessible food is not adequate, reduced food intake of adults, and reduced food intake of children.7 The HFSSM has been shown to be an adequate measure of food security at both the population and the individual level and has also been shown to have good reliability with a
reliability coefficient of .81 for households with children and .74 for all households.32 However, there are limitations to using the HFSSM to measure food security, as surveys may
Assessment in Children with Diabetes
Measuring the food security status of children with diabetes presents unique challenges. Children’s food insecurity is complicated by the fact that children are often protected from the effects of food insecurity, with adults in the household altering or reducing food intake before children.4 Data collected from 1995-1999 consisting of responses to the children’s food security scale and the household scale components of the HFSSM found that the household scale
overestimates the prevalence of children’s hunger in households with no children over the age of 5 by 48% and underestimates by 33% and 20% the prevalence of hunger in children of 6-14 and 15-17 years of age respectively.33 This problem arises from the fact that the HFSSM measures both adult food insecurity and children’s food insecurity, which are correlated but not collinear.33 The use of a separate children’s food security scale, which consists of just the 8 child-specific questions of the HFSSM, has been proposed to overcome this limitation.33
ABSTRACT
Food insecurity (FI) and diabetes are common in youth in the United States. FI has been consistently associated with poorer glycemic control and poorer diet quality among adults with diabetes, but there is limited research on these associations in children. Furthermore, the
Household Food Security Survey Module (HFSSM), the most commonly used tool to assess FI,
has been shown to be an adequate measure of FI at both the population and the individual level,
but little to no research exists on the use of this survey tool in pediatric patients with diabetes.
This study aimed to investigate FI in relationship to hemoglobin A1c (HbA1c) and diet quality as well as the use of the HFSSM to measure household FI of children with diabetes. Participants were youth ages 7-19 recruited from the University of North Carolina Hospitals’ Pediatric Endocrinology clinic (N=30, mean age 13.9, mean HbA1c 9.0%). Data were collected through
an electronic questionnaire and through individual interviews. HbA1c was collected from the
medical record. No significant differences were found between FI status and HbA1c or diet
quality. Interviews were conducted using a semi-structured interview guide and discussions were
audio-taped, transcribed, and analyzed using standard inductive qualitative methods. Interview
data indicated that parents from food insecure households made efforts to shield their children
from the effects of FI by reducing or altering their own food intake and indicated that parents had
worry or anxiety about and prior difficulty with FI negatively impacting their child’s diabetes
management. Interpretation of some of the questions of the HFSSM also differed between
parents from food insecure households and parents from food secure households. Given the small
sample size of this study, more research is needed in the future to test associations between FI
status and diabetes management and diet quality in children as well as investigate the use of the
INTRODUCTION
In the United States, the incidence and prevalence of both T1D and T2D in youth have been increasing in the past years.10,11 The prevalence of household food insecurity has been fluctuating over the past decade, but remains significant at 12.3% of U.S. households as of 2016.19 Previous research has demonstrated that food insecurity is adversely associated with glycemic control and its determinants, including diet quality and medication
self-management/glucose monitoring. While consistent among adults, these associations have been less consistent among children, as existing research on food insecurity and diabetes management in children is limited. It has also been hypothesized that the effects of food insecurity on diet quality and glycemic control may not be as intense for children with diabetes as they are for adults because adults in food-insecure households may children may make efforts to shield children from the effects of food insecurity. Furthermore, the HFSSM, while an adequate and reliable measure of household food insecurity, has only been used to measure household food insecurity of children with diabetes in a handful of studies.29,31 Given the careful nutritional management and self-management that diabetes requires, the burden of diabetes adds an additional complexity to the situation of household food insecurity, and thus may impact how food-insecure individuals interpret and think about questions relating to food-insecurity.
METHODS Study Overview
This study involved cross-sectional data collection in the form of an anonymous,
one-time, electronic questionnaire as well as the collection of qualitative data through individual
interviews. The questionnaire was used to collect demographic variables and information about
food and nutrient intake as well as assess participation in food assistance programs and
household food security status. The individual interviews were guided by a semi-structured
interview guide in which each question of the HFSSM was read out loud to the participant
followed by several probes to determine how the participant interpreted the question and how
they came to their answer. Participants were also asked questions to determine how their
experiences with food shortages related to caring for their child’s diabetes. In addition, the most
recent HbA1c was collected from the medical record.
Participant Inclusion Criteria and Recruitment
This study was conducted with parents of youth between the ages of 5-17. The PI
recruited all participants while they were in the waiting room of UNC Hospitals’ Pediatric
Endocrinology clinic. After being informed of the study, interested participants completed a
statement of informed consent. The statement of informed consent provided participants an
opportunity to indicate whether they would like to be contacted for an interview. Participants
were also asked to complete a HIPAA authorization form in order to authorize study personnel to
obtain their child’s HbA1c from the medical record.
Data Collection
After completion of the consent form, each participant was given an iPad on which they
could access the questionnaire via a Qualtrics link. The questionnaire consisted of five
demographic questions, four questions regarding participation in food assistance programs, the
questions of the Dietary Screener Questionnaire (DSQ), and the questions of the HFSSM. The
Dietary Screener Questionnaire (DSQ) is a 26-item assessment tool of health and nutritional
status of adults and children in the U.S.34 The DSQ captures intakes of fruits and vegetables,
dairy/calcium, added sugars, whole grains/fibers, red meat, and processed meat. At the end of the
survey participants had the option to provide their name, email address, and telephone number so
that they could be contacted for an interview.
Aim 2
After completion of the questionnaire, the PI contacted participants interested in
participating in an interview. Interviews were conducted using a semi-structured interview guide.
The interview guide was developed in collaboration with Dr. Angela Liese, Dr. Sonya Jones, Dr.
Rachel Davis, and Lauren Reid, all of the University of South Carolina. All interviews were
conducted by the by PI via telephone. A total of six interviews were completed, ranging in length
from ~9-32 minutes. Three of the interview subjects had some experience of food insecurity,
while the other three interview subjects were food secure.
Data Analysis
Aim 1
The outcome variables for aim 1 are HbA1c, estimated intake of fruits and vegetables
(cup equivalents), dairy (cup equivalents), added sugars (teaspoon equivalents), whole grains
(ounce equivalents), fiber (g), and calcium (mg), and participation in food assistance programs
kitchen programs. T-tests were used to compare the means of these variables among children
who are food secure to those among children who are food insecure. Analysis of variance
(ANOVA) was used to assess associations of interest. Descriptive statistics were performed on
demographic characteristics.
SAS program was used to convert screener responses to estimates of individual dietary intake based on the DSQ scoring algorithms developed by the National Cancer Institute research
team. Responses to each question of the HFSSM were coded as either “affirmative” or
“negative” using coding procedures established by the USDA. The number of affirmative
answers the respondent gave was then converted to a continuous scale value ranging from 0 to
10. A household that had not experienced any of the conditions of food insecurity covered by the
module questions was assigned a scale value of 0, while a household that had experienced all of
the conditions was assigned a scale value close to 10. These scale values were then used to
determine food security status classification using a table of standard values estimated for the
U.S population by the ERS of the USDA.
Aim 2
Interviews were digitally recorded with participants’ consent and subsequently
RESULTS Recruitment and demographics
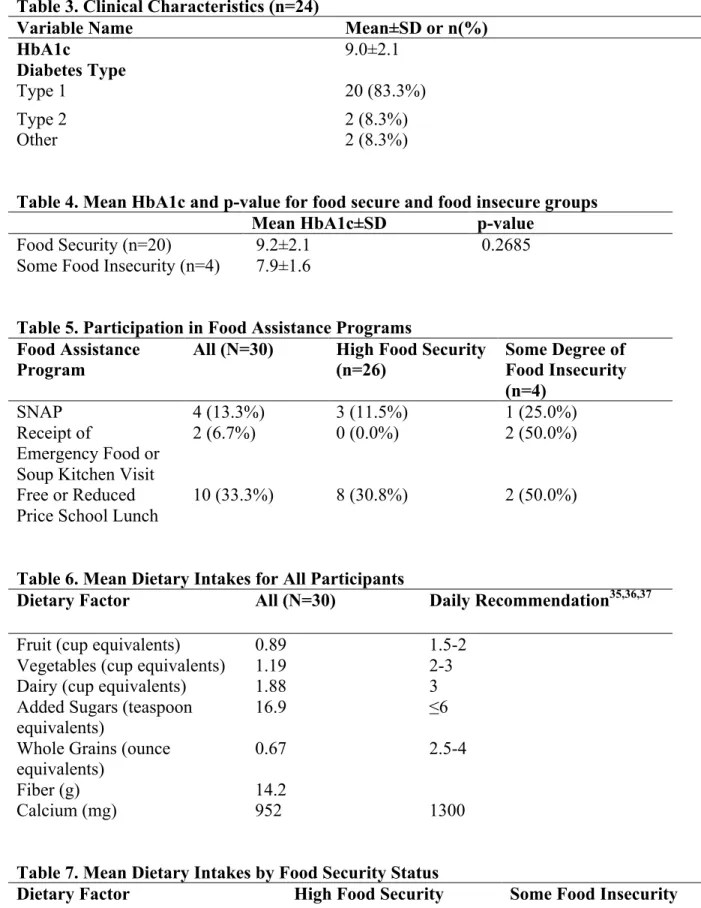
A total of 30 youth were included in the study, most of whom had T1D, but two youth with T2D, one with Cystic Fibrosis-related diabetes, and one with prediabetes were also included in the study. A parent or guardian of each participant completed the questionnaire, and in some cases the child assisted the parent in filling out the questionnaire. Diabetes diagnosis and HbA1c was only obtained for 24 participants, with 6 parents opting not to give study personnel access to this information from the medical record. Participants had an average age of 13.9 (±3.3) (Table 2), an average HbA1c of 9.0 (±2.1) (Table 3), an average of 3.9 (±1.2) (Table 2) individuals living in their household, and were majority white, non-Hispanic females (Table 2). Three participants classified as having marginal food security and one classified as having low food security, while all other participants classified as having high food security (Table 2).
Questionnaire data
The mean HbA1c was higher among food secure participants (9.2±2.1) compared to food insecure participants (7.9±1.6). However, the p-value was much larger than significance when using α=0.05. Free or reduced price school lunch programs was the most commonly used food assistance program, with one-third of parents reporting that their child received these meals at school. This program was commonly used among both food secure and food insecure
Overall, there were no significant differences in dietary factors between food secure participants and food insecure participants, with p-values for all factors greater than 0.18. Participants who had some degree of food insecurity had slightly higher daily intakes of fruit, vegetables, added sugars, and whole grains compared to food secure participants (Table 7), but again these differences were insignificant. Daily intakes of fruit, vegetables, dairy, whole grains and calcium amongst both food secure and food insecure participants all fell short of
recommended daily intakes. Daily intake of added sugars was significantly higher than the recommended daily limit for added sugars across all participants.
Table 1. Recruitment Outcomes
N (%)
Contacted 52
Completed survey (% of contacted) 30 (57.7%)
Expressed willingness to participate in interview (% of participants) 15 (50.0%) Participated in interview (% of those willing to participate) 6 (40.0%)
Table 2. Demographic Characteristics of All Participants (N=30)
Variable Name Mean±SD or n(%)
Gender
Male 10 (33.3%)
Female 20 (66.7%)
Age 13.9±3.3
Ethnicity
White, Non-Hispanic 17 (56.7%)
Non-White, Non-Hispanic 10 (33.3%)
Hispanic 3 (10.0%)
N of Individuals Residing in the Household 3.9±1.2
Food Security
High 26 (86.7%)
Marginal 3 (10.0%)
Low Food Security 1 (3.3%)
Table 3. Clinical Characteristics (n=24)
Variable Name Mean±SD or n(%)
HbA1c 9.0±2.1
Diabetes Type
Type 1 20 (83.3%)
Type 2 2 (8.3%)
Other 2 (8.3%)
Table 4. Mean HbA1c and p-value for food secure and food insecure groups
Mean HbA1c±SD p-value
Food Security (n=20) 9.2±2.1 0.2685
Some Food Insecurity (n=4) 7.9±1.6
Table 5. Participation in Food Assistance Programs Food Assistance
Program
All (N=30) High Food Security (n=26)
Some Degree of Food Insecurity (n=4)
SNAP 4 (13.3%) 3 (11.5%) 1 (25.0%)
Receipt of
Emergency Food or Soup Kitchen Visit
2 (6.7%) 0 (0.0%) 2 (50.0%)
Free or Reduced Price School Lunch
10 (33.3%) 8 (30.8%) 2 (50.0%)
Table 6. Mean Dietary Intakes for All Participants
Dietary Factor All (N=30) Daily Recommendation35,36,37 Fruit (cup equivalents) 0.89 1.5-2
Vegetables (cup equivalents) 1.19 2-3
Dairy (cup equivalents) 1.88 3
Added Sugars (teaspoon
equivalents) 16.9 ≤6
Whole Grains (ounce equivalents)
0.67 2.5-4
Fiber (g) 14.2
Calcium (mg) 952 1300
Table 7. Mean Dietary Intakes by Food Security Status
Dietary Factor High Food Security
Dairy (cup equivalents) 1.87±0.53 1.97±0.51 Added Sugars (teaspoon
equivalents)
16.5±5.2 19.8±11.3
Whole Grains (ounce equivalents) 0.64±0.30 0.86±0.27
Fiber (g) 14.3±2.7 14.0±3.3
Calcium (mg) 955±160 937±208
Interview data
Of the 30 parents and guardians who completed the questionnaire, 21 consented to being contact for an interview and the PI contacted 15 of these participants by telephone and/or email. Six interviews were conducted in total, three with individuals from food secure households and three with individuals from households with some degree of food insecurity.
One theme that was evident across all 3 interviews with marginally food secure and low food security participants was shielding of children by parents from the effects of food
insecurity. All 3 food-insecure participants expressed that they had cut the size of their own meals and/or skipped meals at some point in the last 12 months, but had never altered their children’s meals during times when food was short. One participant shared that she often goes a whole day without eating or only eating one meal a day so that her children do not have to cut the size of their meals or skip meals. Another commonly mentioned strategy for coping with food shortages was turning to others outside of the household. One participant stated,
“sometimes I have to call on other people you know to help us with getting something to eat”, while another participant mentioned “I have a lot of family if I needed something then I could reach them”, and thus they were able to avoid altering the size or frequency of their children’s meals by getting food from others.
interviewees seemed to surround having to rely on “junk” or “processed foods” and less of the “fresher” or “healthier” foods during these times and how these foods affected or could
potentially affect their child’s diabetes management. One participant stated “it’s tricky because they have to watch their carbs but then I have to make sure also that she has enough to eat…if she’s eating the wrong things like she could be high she could go into the highs and also she can go into the lows so it depends”, while another participant commented “sometimes it may be something in my house that she can’t eat but she got to eat it”. Thus these participants viewed the foods they had to rely on during times when food money was short as foods their child shouldn’t be eating but had to eat due to lack of other options.
When comparing responses of individuals from households with some food insecurity to responses from individuals from food secure households, participants had similar definitions regarding what a whole day meant to them, what a meal was to them, and what a balanced meal consisted of. Almost all participants defined a whole day as the time from waking up in the morning to the time of going to bed at night. The majority of participants described a meal as a “main course” or a “protein” with sides, and in their definition of a balanced meal, all
While in some instances interview participants from food secure households gave similar answers and interpreted the questions of the HFSSM in a similar manner compared to
participants from households with some degree of food insecurity, there were also differences in the responses of the two groups. One small difference was in how participants defined running out of food. Running out of food was defined by food insecure as having absolutely nothing physically left to eat, and participants referenced their previous experiences when giving their definitions. One participant gave the following definition: “absolutely nothing (to eat) like down to the last can of food.” Food secure participants gave a less literal definition, referring to the inability to have enough money to make it to the next month or next paycheck. Food secure participants also differed from food insecure participants when asked what “eating less than they felt they should” and what “cutting the size of your meals” meant to them. Food secure
participants referred to “eating less than they felt they should” as “not eating what you would normally eat” or “skipping a meal”, while food insecure participants described this term as meaning that they ate less in order for their children to have more food. When asked what cutting the size of their meals meant to them, food secure participants mentioned taking away an item from the meal or eating smaller portions. While food insecure participants also mentioned these things, they gave more detailed responses, describing how this would impact them personally by making the food last longer from day to day.
DISCUSSION
significant differences were found between diet quality and food security status. There were also no consistent patterns in participation in food security programs across the two groups.
Although the difference in HbA1c among food secure participants and food insecure participants was insignificant, this difference is opposite of what was expected given that food insecurity has been associated with higher HbA1c.30 However, food insecurity has also been associated with increased risk of hypoglycemia, and higher rates of hypoglycemia have been associated with lower HbA1c values.30,38 Thus the lower average HbA1c among food-insecure participants could be explained by episodes of hypoglycemia.
Children from households with some degree of food insecurity had slightly higher average intakes of fruit, vegetables, dairy, added sugars, and whole grains and slightly lower intake of calcium when compared to children from food secure households. Several of these outcomes were unexpected, including higher intakes of fruit, vegetables, dairy, and whole grains given that individuals from food insecure households are more likely to have inadequate food budgets and thus are more likely to experience difficulty purchasing these higher-cost items than individuals from food secure households. On the other hand, the higher average intake of added sugars and lower intake of calcium among food insecure children are consistent with the
expectation that limited food budgets will result in a diet that relies more on lower-cost items that are likely contain a higher proportion of added sugars and less on higher-cost items such as dairy products which greatly contribute to calcium intake. However, the lack of significant differences between dietary factors and food security status seen in this study is unsurprising given the lack of evidence of associations between food insecurity and diet quality in the literature.
slightly higher among participants with some level of food insecurity (25% and 50%
respectively) compared to food secure participants (11.5% and 30.8%). However, given the small sample size of this study, is it difficult to conclude that these differences are significant. It is also important to note that eligibility for programs such as SNAP and school lunch programs is not based on food security status but rather income, and thus some food secure households receive assistance from these programs. There is significant evidence that these programs reduce food insecurity and that free or reduced-price school lunches have positive effects on the nutrition of children, and thus it is possible that these programs help to mitigate the effects of food insecurity on diabetes management in children. However, the evidence of the positive effects of public food programs such as SNAP on the health and nutrition of recipients is less extensive.20
Both participants who reported receiving emergency food from a church, food pantry, food bank or eating in a soup kitchen in the past 12 months classified as having some degree of food insecurity. While a larger sample size likely would have included some food secure individuals who received emergency food or ate in a soup kitchen, it is worth noting that food insecure individuals are more likely to utilize these programs than individuals who are food secure.
During the interviews, food insecure participants gave longer and more detailed
experiences and concerns impacted how food insecure participants interpreted the questions of the HFSSM. Food secure and insecure participants gave similar responses when defining more concrete concepts, such as a whole day, a meal, and a balanced meal. However, when asked about phrases in the questions of the HFSSM that have less clear cut definitions, including “running out of food”, “eat less than you felt you should”, and “cutting the size of your meals”, food secure participants gave more detailed responses on how these events impacted them personally and described certain actions they have taken that allowed themselves and/or their children to have more food in the long run.
Additionally, it was evident that all food insecure interview participants made efforts to shield their children from the effects of food insecurity, which supports the hypothesis that parents will prioritize their children over themselves in terms of who receives which food and in what amount, and thus children will be less negatively impacted by food insecurity than adults.
Furthermore, food insecure participants also expressed concerns regarding the impact of food insecurity on their child’s diabetes management, indicating that parents of children with diabetes may be thinking about these concerns when answering questions of the HFSSM. Thus additional constructs may be necessary to adequately assess and capture the concerns and experiences of food insecure individuals with diabetes.
STRENGTHS AND LIMITATIONS
hypothesis-generation for future research involving food security assessment in the context of diabetes as well as other diseases.
A major limitation of this study was the small sample size, which impacts the ability to find significant relationships from the data and to generalize the findings from this study to a larger population. Another limitation to this study is the reporting of food-security status and dietary intakes of the children involved in this study by their parents. Both quantitative and qualitative research has demonstrated a tendency for parents to underreport their child’s food insecurity, with differences between adolescents’ self-reported food insecurity and their parents’ reports of their food insecurity and some instances in which parents are unaware of the extent to which their children reduced their food intake during periods of food insecurity.40,41 Furthermore, the reported dietary intakes in this study are subject to inaccuracy since parents may not be reliable reporters of their child’s consumption. Parents have been found to be reliable reporters of their child’s intake while at home, but are not as accurate at reporting intakes when their child eats outside of the home.42 Other potential limitations to the self-reporting used in this study include literacy barriers or intentional misreporting due to shame that may be associated with food insecurity and/or diet quality.
CONCLUSIONS
This study suggests that further research on the effects of food security on diabetes management is needed. Future studies involving larger, more representative sample sizes should not only examine diet quality and food assistance programs in relation to diabetes management, but should also examine other possible means through which food insecurity may adversely affect children’s health. Food security status should also be routinely assessed in clinical settings so that families who are food insecure can be referred to food assistance programs. Short 2-item or 6-item food insecurity screeners have been successfully implemented in clinic settings, and one study demonstrated significant improvements in A1c levels of adults with T2D following screening and referral to community resources during clinic visits.43,44 Further research should also be conducted on the instruments used to assess food security of children with diabetes to determine if interpretation of the questions of the instrument differs between people who are food secure and insecure and if concerns about diabetes management impacts these
REFERENCES
1. American Diabetes Association. Diagnosis and Classification of Diabetes Mellitus. Diabetes Care. 2010;33(Suppl 1):S62-S69. doi:10.2337/dc10-S062.
Accessed February 13, 2017.
2. Moore DJ, Gregory JM, Kumah-Crystal YA, Simmons JH. Mitigating micro-and macro-vascular complications of diabetes beginning in adolescence. Vascular Health and Risk Management. 2009;5:1015-1031.
3. Bickel, G, Nord M, Price C, Hamilton W, Cook J. Guide to Measuring Household Food Security.
https://fns-prod.azureedge.net/sites/default/files/FSGuide_0.pdf. Updated March 2000. Accessed February
13, 2017.
4. Lyles CR, Wolf MS, Schillinger D, et al. Food Insecurity in Relation to Changes in Hemoglobin A1c, Self-Efficacy, and Fruit/Vegetable Intake During a Diabetes Educational
Intervention. Diabetes Care. 2013;36(6):1448-1453. doi:10.2337/dc12-1961.
5. Hanson, KL, Connor LM. Food Insecurity and Dietary Quality in US Adults and Children: A Systematic Review. The American Journal of Clinical
Nutrition. 2014;100(2):684-692. doi:10.3945/ajcn.114.084525. Published June 18, 2014. Accessed February 13, 2017.
6. Frongillo, EA. Validation of Measures of Food Insecurity and Hunger.
The Journal of Nutrition. 1999;129(2):506S-509S. doi:10.1093/jn/129.2.506S. Published February 1, 1999. Accessed February 13, 2017.
7. Jones A, Ngure F, Pelto G, Young S. What Are We Assessing When We Measure Food Security? A Compendium and Review of Current Metrics. Advances in Nutrition: An International Review Journal. 2013;4(5):481-505. doi:10.3945/an.113.004119.
8. Forbes J, Cooper M. Mechanisms of Diabetic Complications. Physiological Reviews. 2013;93(1):137-188. doi:10.1152/physrev.00045.2011.
9. Reinehr T. Type 2 diabetes mellitus in children and adolescents. World Journal of Diabetes. 2013;4(6):270-281. doi:10.4239/wjd.v4.i6.270.
10. Mayer-Davis, E. J., Lawrence, J. M., Dabelea, D., Divers, J., Isom, S., Dolan, L., … for the SEARCH for Diabetes in Youth Study. (2017). Incidence Trends of Type 1 and Type 2 Diabetes among Youths, 2002–2012. The New England Journal of Medicine, 376(15), 1419–1429.
http://doi.org/10.1056/NEJMoa1610187
12. Fowler M. Microvascular and Macrovascular Complications of Diabetes. Clinical Diabetes. 2008;26(2):77-82. doi:10.2337/diaclin.26.2.77.
13. Jaiswal M, Divers J, Dabelea D et al. Prevalence of and Risk Factors for Diabetic Peripheral Neuropathy in Youth With Type 1 and Type 2 Diabetes: SEARCH for Diabetes in Youth Study. Diabetes Care. 2017;40(9):1226-1232. doi:10.2337/dc17-0179.
14. Mah J, Pacaud D. Diabetic neuropathy in children. Diabetes and the Nervous System. 2014;126:123-143. doi:10.1016/b978-0-444-53480-4.00010-2.
15. Hirschfeld G, von Glischinski M, Blankenburg M, Zernikow B. Screening for Peripheral Neuropathies in Children With Diabetes: A Systematic Review. PEDIATRICS.
2014;133(5):e1324-e1330. doi:10.1542/peds.2013-3645.
16. Dart A, Martens P, Rigatto C, Brownell M, Dean H, Sellers E. Earlier Onset of Complications in Youth With Type 2 Diabetes. Diabetes Care. 2013;37(2):436-443. doi:10.2337/dc13-0954.
17. Nutrition Recommendations and Interventions for Diabetes: A position statement of the American Diabetes Association. Diabetes Care. 2007;31(Supplement 1):S61-S78.
doi:10.2337/dc08-s061.
18. USDA ERS - Definitions of Food Security. Ersusdagov. 2017. Available at:
https://www.ers.usda.gov/topics/food-nutrition-assistance/food-security-in-the-us/definitions-of-food-security/.
19. Coleman-Jensen A, Rabbitt M, Gregory C, Singh A. Household Food Security In The United States In 2016. USDA; 2017. Available at:
https://www.ers.usda.gov/webdocs/publications/84973/err-237.pdf?v=42979.
20. Kirkpatrick SI, Dodd KW, Parsons R, Ng C, Garriguet D, Tarasuk V. Household Food Insecurity Is a Stronger Marker of Adequacy of Nutrient Intakes among Canadian Compared to American Youth and Adults. The Journal of Nutrition. 2015;145(7):1596-1603.
doi:10.3945/jn.114.208579.
21. Measuring the effect of supplemental nutritional assistance program (SNAP) participation on food security (summary). USDA.gov.
https://www.fns.usda.gov/measuring-effect-snap-participation-food-security-0. Published August 2013. Accessed February 1, 2018.
22. Ralston K, Coleman-Jensen A. USDA’s national school lunch program reduces food insecurity. USDA.gov.
https://www.ers.usda.gov/amber-waves/2017/august/usda-s-national-school-lunch-program-reduces-food-insecurity/. Published August 7, 2017. Accessed February 1,
23. Leung C, Epel E, Ritchie L, Crawford P, Laraia B. Food Insecurity Is Inversely Associated with Diet Quality of Lower-Income Adults. Journal of the Academy of Nutrition and Dietetics. 2014;114(12):1943-1953.e2. doi:10.1016/j.jand.2014.06.353.
24. Mello JA, Gans KM, Risica PM, Kirtania U, Strolla LO, Fournier L. How is food insecurity associated with dietary behaviors? An analysis with low income, ethnically diverse participants in a nutrition intervention study. Journal of the American Dietetic Association.
2010;110(12):1906-1911. doi:10.1016/j.jada.2010.09.011.
25. Rodríguez L, Mundo-Rosas V, Méndez-Gómez-Humarán I, Pérez-Escamilla R, Shamah-Levy T. Dietary quality and household food insecurity among Mexican children and
adolescents. Maternal & Child Nutrition. 2016;13(4):e12372. doi:10.1111/mcn.12372. 26. Grutzmacher S, Gross S. Household Food Security and Fruit and Vegetable Intake among Low-income Fourth-Graders. Journal of Nutrition Education and Behavior. 2011;43(6):455-463. doi:10.1016/j.jneb.2010.10.004.
27. Seligman HK, Laraia BA, Kushel MB. Food Insecurity Is Associated with Chronic Disease among Low-Income NHANES Participants. The Journal of Nutrition. 2010;140(2):304-310. doi:10.3945/jn.109.112573.
28. Seligman H, Jacobs E, Lopez A, Tschann J, Fernandez A. Food Insecurity and Glycemic Control Among Low-Income Patients With Type 2 Diabetes. Diabetes Care. 2011;35(2):233-238. doi:10.2337/dc11-1627.
29. Mendoza JA, Haaland W, D’Agostino RB, Martini L, Pihoker C, Frongillo EA, Mayer-Davis EJ, Liu LL, Dabelea D, Lawrence JM, Liese AD. Food insecurity is associated with high risk glycemic control and higher health care utilization among youth and young adults with type 1 diabetes. Diabetes Research and Clinical Practice. 2018;138:128-137.
doi:10.1016/j.diabres.2018.01.035.
30. Gucciardi E, Vahabi M, Norris N, Del Monte JP, Farnum C. The Intersection between Food Insecurity and Diabetes: A Review. Current Nutrition Reports. 2014;3(4):324-332.
doi:10.1007/s13668-014-0104-4.
31. Marjerrison S, Cummings E, Glanville N, Kirk S, Ledwell M. Prevalence and Associations of Food Insecurity in Children with Diabetes Mellitus. The Journal of Pediatrics.
2011;158(4):607-611. doi:10.1016/j.jpeds.2010.10.003.
32. Keenan DP, Olson C, Hersey JC, Parmer SM. Measures of food insecurity/security. J Nutr Educ. 2001;33:S49-S58.
http://libproxy.lib.unc.edu/login?url=https://search-proquest-com.libproxy.lib.unc.edu/docview/229760492?accountid=14244.
34. National Cancer Institute. Dietary Screener Questionnaire in the NHANES 2009-10: Background. epi.grants.cancer.gov. https://epi.grants.cancer.gov/nhanes/dietscreen/. Updated February 13, 2018. Accessed March 30, 2018.
35. USDA. MyPlate. choosemyplate.gov. https://www.choosemyplate.gov/MyPlate. Updated January 26, 2018. Accessed March 5, 2018.
36. Harvard T.H. Chan School of Public Health. The Nutrition Source: Added Sugar in the Diet. hsph.harvard.edu.
https://www.hsph.harvard.edu/nutritionsource/carbohydrates/added-sugar-in-the-diet/. Accessed March 5, 2018.
37. NIH Eunice Kennedy Shriver National Institute of Child Health and Human Development. How much calcium do children & teens need? nichd.nih.gov.
https://www.nichd.nih.gov/health/topics/bonehealth/conditioninfo/children. Updated December
1, 2016. Accessed March 5, 2018.
38. Yu S, Fu AZ, Engel SS, Shankar RR, Radican L. Association between hypoglycemia risk and hemoglobin A1c in patients with type 2 diabetes mellitus. Current Medical Research and Opinion. 2016;32(8):1409-16. doi:10.1080/03007995.2016.1176017.
39. Chan J, DeMelo M, Gingras J, Gucciardi E. Challenges of Diabetes Self-Management in Adults Affected by Food Insecurity in a Large Urban Centre of Ontario, Canada. International Journal of Endocrinology. 2015;2015:903468. doi:10.1155/2015/903468.
40. Fram M, Frongillo E, Fishbein E, Burke M. Roles for schools and school social workers in improving child food security. Children & Schools. 2014;36(4): 231-239.
41. Nord M, Hanson K. Adult caregiver reports of adolescents’ food security do not agree well with adolescents’ own reports. Journal of Hunger and Environmental Nutrition. 2012;7(4):363-80.
42. Livingstone MB, Robson P. Measurement of dietary intake in children. Proc Nutr Soc 2000;59:279-93.
43. Soba, F. Implementation of food insecurity screening in clinical setting. Doctor of Nursing Practice (DNP) Projects. 48.
https://repository.usfca.edu/cgi/viewcontent.cgi?article=1058&context=dnp. Published
December 12, 2014. Accessed February 20, 2018.