DISCOVERY AND CHARACTERIZATION OF MOLECULAR SUBTYPES IN HIGH-GRADE UROTHELIAL CARCINOMA
Jeffrey Stuart Damrauer
A dissertation submitted to the faculty at the University of North Carolina at Chapel Hill in partial fulfillment of the requirements for the degree of Doctor of Philosophy in the
Curriculum of Genetics and Molecular Biology in the School of Medicine.
Approved by: William Y. Kim Ian J. Davis Carol A. Otey Joel S. Parker
©2014
ABSTRACT
Jeffrey Stuart Damrauer: Discovery and characterization of molecular subtypes in high-grade urothelial carcinoma
(Under the direction of William Y. Kim)
Bladder Cancer is the 4th most commonly diagnosed cancer in men and the 8th most deadly. While non-muscle invasive bladder cancer has a relatively high 5 year survival rate, muscle invasive bladder cancer (≥T2) has a 5 year survival rate of ~50% with the number decreasing to 15% for non-organ confined disease. Multiple groups have performed molecular characterization of bladder tumors in an effort to identify bladder cancer subtypes. These groups have been able to effectively differentiate non-muscle invasive disease (low-grade) from non-muscle invasive (high-grade); since
pathologists can reliably identify LG and HG tumors, molecular signatures of these two groups are not clinically useful. We sought to define whether there are intrinsic
molecular subtypes of high-grade bladder cancer. Consensus Clustering performed on gene expression data from a meta-dataset of high-grade, muscle invasive bladder tumors identified two intrinsic, molecular subsets of high-grade bladder cancer: “luminal” and “basal-like” that have characteristics of different stages of urothelial differentiation, reflect the luminal and basal-like molecular subtypes of breast cancer, and have
at least two molecularly and clinically distinct subtypes of high-grade bladder
ACKNOWLEDGMENTS
First, thank you to everyone who has played a role in this project and more generally in my graduate career, this long journey would not have been as rewarding or enjoyable without all of you.
I would like to thank my thesis advisor, Billy Kim. Billy provided me with a
wonderful lab environment and surrounded me with all of the tools needed to become a successful scientist. Additionally his mentoring, encouragement and patience with me throughout my graduated studies and numerous projects has allowed me to grow and thrive over the past 6 years and will stay with me as I continue my career in science.
Additionally, I would like to thank my committee, Drs. Ned Sharpless, Ian Davis, Carol Otey, Joel Parker and former member Derek Chiang, for their support and critical analysis over the course of my project.
None of this would have been possible without the support of the members of the Kim Lab, both current and former. Their help both scientifically and otherwise, have made the past 6 years fly by.
Additionally, I would like to acknowledge my past mentors, Drs. Denis Guttridge and Susan Kandarian. Both of whom gave me a strong foundation in which I was able to build on during my time at UNC.
Finally, I would like to thank my entire family. You have been there through
TABLE OF CONTENTS
LIST OF FIGURES ... ix
LIST OF TABLES ... xi
LIST OF ABBREVIATIONS ... xii
Chapter 1: Bladder Cancer Pathology and Histologic Subtypes ... 1
1.1 Epidemiology ... 1
3.2 Risk Factors ... 3
1.3 Bladder Histology, Staging and Pathologic Subtypes ... 6
1.4 Bladder Cancer Treatment ... 10
1.5 Summary ... 12
Chapter 2: Bladder Cancer Genetics and Molecular Subtyping ... 13
2.1 Bladder Cancer Genetics ... 13
2.2 Molecular Signatures of Bladder Cancer ... 19
Summary ... 24
Chapter 3: Intrinsic subtypes of high-grade bladder cancer reflect the hallmarks of breast cancer biology ... 25
3.3 Results ... 28
3.4 Discussion ... 36
3.5 Materials and Methods ... 39
3.6 Figures ... 42
3.7 Supplemental Figures ... 55
Chapter 4: Future Directions ... 64
4.1 BASE47 as a prognostic tool ... 64
4.2 BASE47 as a predictive tool ... 66
APPENDIX A: SAM GENE LIST ... 70
APPENDIX B: PAM GENE LIST ... 105
APPENDIX C: GENE SET ENRICHEMENT ANALYSIS ... 108
LIST OF FIGURES
FIGURE 1: BLADDER HISTOLOGY ... 7 FIGURE 2: BLADDER CANCER STAGING ... 9
FIGURE 3: GENOMIC ALTERATION IN BLADDER CANCER ... 17
FIGURE 5: DISCOVERY OF TWO DISTINCT SUBTYPES
OF BLADDER CANCER ... 44 FIGURE 6: GENERATION OF THE BASE47 SUBTYPE
PREDICTOR ... 45
FIGURE 7: COMPARISON OF BASE47 CALLS TO PREVIOUSLY PUBLISHED SUBTYPES CALLS ON
THE TCGA DATASET ... 47
FIGURE 8: LUMINAL AND BASAL BLADDER CANCER HAVE DIFFERENTIAL SURVIVAL AND ARE
ASSOCIATED WITH DISTINCT GENOMIC ALTERATIONS ... 48
FIGURE 9: BASAL AND LUMINAL BLADDER CANCER
HAVE DISTINCT CLINICAL FEATURES. ... 49
FIGURE 10: BASAL-LIKE AND LUMINAL BLADDER CANCER CORRELATE TO THE INTRINSIC
MOLECULAR SUBTYPES OF BREAST CANCER ... 50
FIGURE 11: A SUBSET OF BASAL-LIKE BLADDER
TUMORS ARE CLAUDIN-LOW ... 52 FIGURE 12: PROPOSED MODEL OF UROTHELIAL
TUMORGENESIS AND RELATIONSHIPS TO
INTRINSIC SUBTYPES OF BREAST CANCER ... 53
SUPPLEMENTAL FIGURE 1: CONSENSUS CLUSTERING DEFINES TWO DISTINCT MOLECULAR SUBTYPES OF
INVASIVE BLADDER CANCER ... 56
SUPPLEMENTAL FIGURE 2: CLINICAL VARIABLES ARE NOT SIGNIFICANTLY ASSOCIATED WITH DISEASE SPECIFIC OR OVERALL SURVIVAL AND PREVIOUS
MUSCLE INVASIVE SIGNATURES ARE NOT PROGNOSTIC
SUPPLEMENTAL FIGURE 3: MAKERS OF LUMINAL BREAST CANCER ARE CO-EXPRESSED WITH MARKERS OF
UROTHELIAL DIFFERENTIATION ... 60
SUPPLEMENTAL FIGURE 4: BASAL-LIKE BLADDER CANCER POSSESSES TUMOR INITIATING CELL TRAITS AND IS
MOLECULAR SIMILAR TO BASAL BREAST CANCER. ... 62
SUPPLEMENTAL FIGURE 5: BASAL, LUMINAL, CALUDIN LOW AND ONCOGENIC BREAST CANCER SIGNATURES ARE ASSOCIATED WITH INTRINSIC MOLECULAR
SUBTYPES OF BLADDER CANCER ... 63
FIGURE 13: SENSITIVE TO CDK4/6 INHIBITION BY
LIST OF TABLES
TABLE 1: COMPARISON OF MUSCLE INVASIVE SUBTYPES ... 23
TABLE 2: DATASET CHARACTERISTICS ... 42
TABLE 3: MSKCC - UNIVARIABLE COX REGRESSION
LIST OF ABBREVIATIONS
BCG Bacillus Calmette-Guerin CCND1 cyclin D1
CCNE1 cyclin E1
CDK1A cyclin-dependent kinase inhibitor 1A CDK2A cyclin-dependent kinase inhibitor 2A CIS carcinoma in situ
EMT epithelial-mesenchymal transition FGFR3 fibroblast growth factor receptor 3 GSEA Gene Set Enrichment Analysis HG high grade
HMWK High Molecular Weight Keratin
HRAS Harvey rat sarcoma viral oncogene homolog IPA Ingenuity Pathway Analysis
KDM6A lysine (K)-specific demethylase 6A LG low grade
LMWK Low Molecular Weight Keratin MAD Mean Absolute Deviation
MSKCC Memorial Sloan Kettering Cancer Center PAM Prediction Analysis for Microarrays PTEN phosphatase and tensin homolog RB1 retinoblastoma 1
TCGA The Cancer Genome Atlas TP53 tumor protein p53
Chapter 1: Bladder Cancer Pathology and Histologic Subtypes
1.1 Epidemiology
Bladder cancer is the 4th most commonly diagnosed caner in men and 8th deadliest in the United States with an estimated 74,690 (56,390 in men and 18,300 in women) new cases and 15,580 (11,170 in men and 4,410 in women) deaths for the year 2014 (1). Bladder cancer has the highest per patient treatment cost of any cancer, costing the US healthcare industry 3.7 billion dollars annually (2). This is of note since bladder cancer is predominately a disease of the elderly, specifically elderly men; the average age at diagnosis is 65-70 years with an incidence rate of 36.9 for men and 9.1 for women (per 100,000 people) (1). Although women are diagnosed at a lower
frequency than men, they have a worse overall prognosis. Studies suggest that gender may be an independent risk factor for poor prognosis, with women having a poorer outcome (3, 4). However, other reports suggest that when corrected for demographics and clinical factors, women had equal survival outcomes to men (5).
of the most different as compared to other tumor types This could partially be explained by white patients having a higher incidence of low grade tumors as compared to African Americans. (9). Additionally, the difference in survival has previously been attributed to difference in access to health care and late stage diagnosis. However, multiple studies have shown that poor outcome is not fully due to the aforementioned factors, and other, yet to be determined factors contribute to race specific survival differences (5, 7, 10,
3.2 Risk Factors
There are multiple known risk factors for bladder cancer including smoking, occupational exposures, environmental exposures and infection. Smoking is the single largest risk factor for bladder cancer, increasing a person’s risk 2-4 fold (9). Additionally, it has been estimated that 30%-50% of all bladder cancer cases are caused by cigarette smoking (9, 12). While the risk of smoking related bladder cancer has been correlated to the duration and intensity of smoking, there is also a correlation between the variety of tobacco used in the cigarettes and cancer risk; black tobacco has a 2-3 times high risk than Virginia or brightleaf tobacco (12). Currently, there is no defined mechanism of smoking related carcinogenesis in bladder cancer. It has been hypothesized that the absorption of carcinogens such as 2-naphthylamine and 4-aminobiphenyl, which are filtered through the urine via the bladder, could act as the causal agents. However, the risk of bladder cancer is only increased by inhaled tobacco and not other products such as cigar and chewing tobacco, suggesting a more complicated mechanism of
carcinogen metabolism (13). In addition to the carcinogens from cigarettes,
carcinogenic exposure at the workplace is also a contributing risk factor to bladder cancer.
bladder cancer (15). This has been followed up over the past decades by numerous studies demonstrating the link between occupational exposure to carcinogens and bladder cancer (12, 16). Aromatic amines such as, benzidine; benzidine;
4-aminobiphenyl; 2-naphthylamine; 4-chloro-o-toluidine have been shown to be the main contributors to occupational related carcinogenesis (12, 14).
In addition to occupational exposures, environmental exposure to arsenic is a significant contributor to the risk of development of bladder cancer. It was first noted that high levels of arsenic in drinking water was statistically associated with cancer in the 1960s by Tseng et. al. as part of a large population based study in Taiwan. The original intent of the project was to investigate the high rate of Blackfoot disease, a peripheral vascular disease, in association with arsenic levels, however incidental findings revealed a high rate of skin cancer among people with high exposure to arsenic. Arsenic concentration in the affect area’s well water was measured at 1.097ppm, 100x greater then surrounding villages with arsenic free water (17). In additional follow up studies numerous groups identified multiple arsenic associated cancers, including bladder cancer (17-20). Currently analysis of bladder cancer risk associated with arsenic exposure suggests that a 10ug/L lifetime exposure would increase bladder cancer risk to 2 in 1,000, compared to the EPA risk range of 1 in 10,000 (21). Although epidemiologic data concerning high-dose exposure is consistent with increased bladder cancer risk, recent data suggests that using previously established predictive risk
models may not be accurate for low-dose exposure (21).
Schistosomiasis is endemic in Egypt and the more generally the Middle East.
Schistosomiasis spreads through infected drinking water and can lead to weakness, diarrhea. There are four schistosomes that infect humans; S. haematobium, S.
Mansoni, S. Japonicum, and S. Mekongi, of these, S. Haematobium is associated with increased risk of malignancy. Carcinomas of the intestine, liver and bladder have been linked to S. Haematobium infection (22). It is estimated that ~27% of all bladder cancer diagnosis in Egypt are associated with S. Haematobium infection (23). Bladder cancers associated with infection are more likely to be of the squamous cell carcinoma histologic subtype, whereas transitional cell carcinomas are more commonly diagnosed in the western world (23, 24). Although the mechanism of cancer initiation is unknown,
multiple groups have shown that chronic infection, including urinary tract infections, may be a contributing risk factor to bladder cancer (25-27)
1.3 Bladder Histology, Staging and Pathologic Subtypes
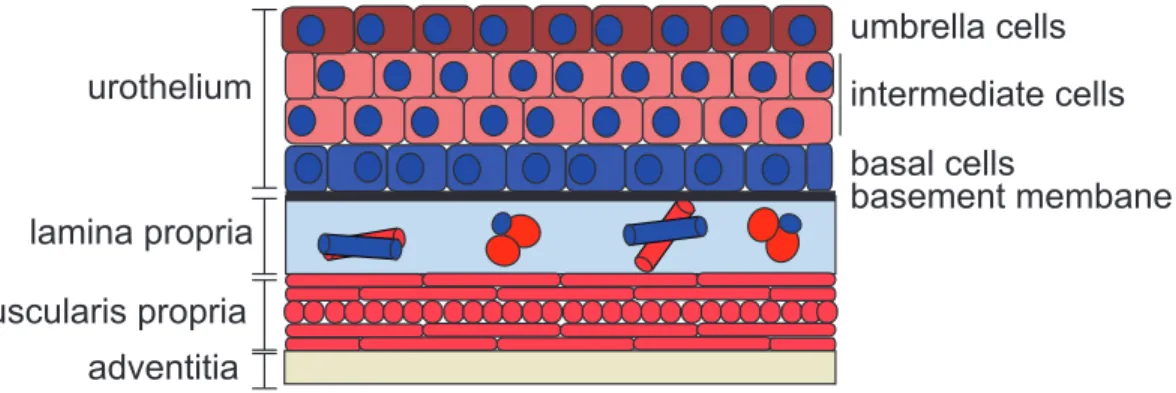
The urinary bladder has a multi-layered transitional epithelium (urothelium), of which the luminal most layer consists of umbrella cells. This specialized epithelium allows for a water-tight barrier and resistance to mechanical stress associated
expansion and contraction of the bladder when filling and voiding urine. These unique features of the epithelium are in part conferred by the presence of urothelial plaques on the apical surface of cell. The plaques are protein complexes composed of two
heterodimers bound to a heterotetramer of uroplakins (UP1a/UPK2 and UPK1b/UPK3) (28). Hu et. al. demonstrated that lost of the UPK3 significantly increased the cell’s membrane permeability to both urea and water (29). Additionally, uroplakin loss is associated with decreased umbrella cell size and defects in the urinary tract (30).
Beneath the umbrella layer are the intermediate and basal layers. The basal cells has been proposed to be the progenitor cell for the urothelium and the potential cell of origin for bladder cancer (31-33). The basement membrane is a specialized
Figure 1: Bladder histology
A layer of transitional epithelial cells sits on top of a basement membrane, that separates the urothelium from the lamina propria. It is followed by a muscular layer (muscularis propria) and the adventitia.
urothelium
lamina propria
muscularis propria adventitia
basal cells umbrella cells
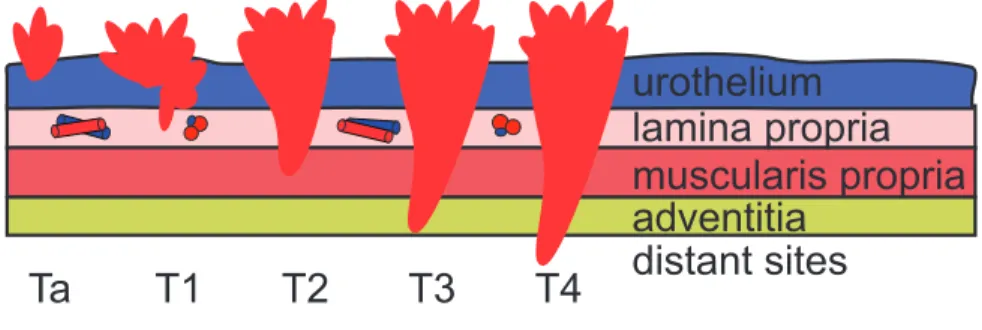
Bladder cancer, which arises from the transformation of urothelial cells, is staged based on the degree of invasion into the underlying tissue (Figure 2). Pathologic stage is the most important prognostic factor for bladder cancer survival and is critical for informing treatment (9). Tumors diagnosed as Ta are tumors that are confined to the urothelium and do not invade into the lamina propria. These tumors can exist as either be low-grade (LG), papillary tumors, or high-grade (HG), carcinomas in situ (CIS). LG papillary tumors account for approximately 70% of tumors at diagnosis with HG tumors make up the remaining 30%. LG tumors have a good prognosis with a >95% five year survival, however need to be regularly monitored as reoccurrence is common in up to 80% of patients. Although high grade CIS are confined to the urothelium they are aggressive and may progresses to invasive disease (1, 34).
Muscle invasive tumors (≥T2) are almost exclusively HG and have a poor
prognosis as compared to LG non-muscle invasive disease. Patients that are diagnosed with T2 tumors have a 63% five-survival rate, which drops to 15% for patients
Figure 2: Bladder cancer staging
A diagram represents the degree of invasion as it relates to stage. Superficial tumors do not extent past the lamina propria (T0,T1). Once the tumor invades the muscularis propria they are considered invasive (≥T2), tumors that have invaded neighboring organs or metastasized are classified as T4.
urothelium
lamina propria
muscularis propria
adventitia
1.4 Bladder Cancer Treatment
As previously mentioned, the stage at diagnosis plays a critical role in
determining the course of treatment. Currently the gold standard of care for non-muscle invasive bladder cancer is excision of the tumor via Transurethral Resection of Bladder Tumor (TURBT). During the procedure, the tumor is removed using a cystoscope inserted into the bladder through the urethra. Patients may, additionally, receive a one-time treatment with intravesical chemotherapy at the one-time of resection or a series treatments over a period of multiple weeks. Patients that are deemed intermediate or high risk may also receive Bacillus Calmette-Guerin(BCG) treatment in combination with intravesical chemotherapy (35) (36). BCG is a live attenuated form of the bacterium
Mycobacterium bovis. When the bacterium is instilled into the bladder it elicits an inflammatory response as well as triggers activation of the adaptive immune system (37, 38). It is proposed that this stimulation of the immune system helps to clear residual cancer cells after TURBT.
Whereas TURBT and surveillance is the preferred approach for LG disease, first line therapy for HG muscle invasive disease is radical cystectomy, often in combination with cisplatin based chemotherapy. Currently the combination treatment of GC
(gemcitabine and cisplatin) is currently the most widely used, however the 4 drug
1.5 Summary
Bladder cancer is a heterogeneous disease with two main histologic subtypes, which have differing histology, treatment and prognosis. Bladder cancer represents a major health concern in the geriatric population and a burden on the healthcare
industry. The main risk factors for bladder cancer: smoking and occupational exposures to aromatic amines, are preventable and hopefully with the decrease in smoking rates over the past decade there will be a commensurate decrease in bladder cancer
Chapter 2: Bladder Cancer Genetics and Molecular Subtyping
2.1 Bladder Cancer Genetics
As there is a dichotomy in pathologic/histologic subtypes between LG papillary and HG muscle invasive disease, these subtypes also have distinct genomic features (Figure 3).LG papillary tumors are characterized by activating mutations in the
oncogenes fibroblast growth factor 3 (FGFR3) and Harvey rat sarcoma viral oncogene homolog (HRAS), whereas HG muscle invasive tumors more typically have mutations causing the inactivation of the Retinoblastoma (RB) and p53 pathways (34, 41, 42). Additionally, with the advent of next generation sequencing, new highly prevalent mutations have been discovered, most notably the alterations in genes involved in chromatin modification and remodeling (43, 44).
FGFR3 is a receptor tyrosine kinase (RTK) that when activated, dimerizes and regulates cellular processes involved in proliferation, migration and survival (45). It has been observed that FGFR3 activating mutations occur in up to 80% of LG tumors, making it the most frequent alteration in bladder cancer (34). The most frequent FGFR3
mutation found in bladder cancer is S249C, which occurs within the extracellular domain, allowing for its constitutive dimerization and activation (46). Although FGFR3
mutations do exist in HG tumors they do so at much less lower frequency, 5 -12% (43,
Ras-MAPK pathway. Evidence for this is that RAS mutations are frequent in bladder occurring in 11-15%% of tumors, however they are mutually exclusive with FGFR3
mutations (34).
In addition to FGFR3 and HRAS, activation of the phosphatidylinositol 3-kinase (PI3K) pathway through mutations and copy number alteration of phosphatidylinositol-4,5-bisphosphate 3-kinase, catalytic subunit alpha (PIK3CA)
has also been correlated with LG tumors (47-49). Interestingly, loss of phosphatase and tensin homolog (PTEN), which activates the PI3K pathway, is more associated in
muscle invasive disease. This implicates the PI3K pathway in both LG and HG tumorigenesis, however each subtype has distinct pathway alterations, which are not mutually exclusive (48, 50).
Recently it has been noted that a significant number of chromatin modifying genes are mutated in bladder cancer, of which lysine (K)-specific demethylase 6A
(KDM6A), also know as UTX, has been associated with LG tumors (44). Gui et. al. observed KDM6A mutations in ~30% of non-muscle invasive cases, where as the rate was only 15% in muscle invasive cases. Taken as a whole, LG bladder cancer has distinct genomic features, of which are a number that are potentially targetable.
As with LG bladder cancer, HG disease is associated with a unique set of genomic alterations. HG bladder tumors are enriched for mutations in the tumor suppressor gene Tumor Protein p65 (TP53) and inactivation of the RB pathway (34,
43). TP53 is the most commonly mutated gene in HG bladder cancer with recent
control in response to DNA damage (51). Additionally, bladder cancer is the first known tumor type to have mutations in the cyclin-dependant kinase inhibitor 1A (CDKN1A),
p21, (14%).
HG bladder cancer also has a high rate of RB pathway alterations with multiple genes within the pathway either mutated of having copy number alteration (Figure 4).
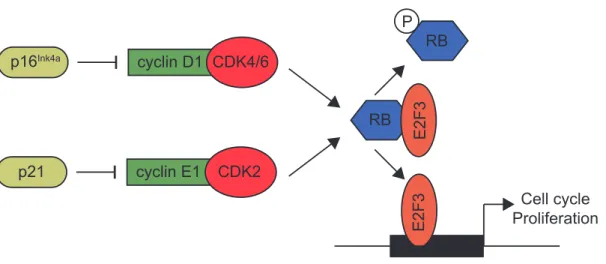
RB1 is mutated in 13% of tumors sequenced by the TCGA and had copy number loss in an additional 14% of tumors. Immediately upstream of RB are the cyclin dependent kinases CDK4/6 and CDK2, and their regulators cyclin D1 and cyclin E1, which are encoded by CCDN1 and CCNE1 respectively. Therefore, in bladder cancer, the focal amplification of CCND1 (10%) and CCNE1 (12%) allow for increases in activity of
CDK4/6 and CDK2 respectively. Unphosphorylated RB normally binds the E2F family of transcription factors and prevents them from interacting with DNA. Cyclin / CDK
complexes work to phosphorylate RB and this phosphorylation promotes its dissociation from E2Fs allowing them to translocate to the nucleus and bind to the promoters of target genes inducing cell cycle progression and proliferation (52).
Another mechanism by which the RB pathway can become inactivated is through loss of cyclin-dependent kinase inhibitor 2A (CDKN2A), which encodes the proteins p16/INK4A and p14/ARF. CDKN2A in only mutated in 5% of bladder tumors, however, it is the most frequently altered gene by copy number alteration, with 47% of tumors in the TCGA have some degree of copy number loss. Loss CDKN2A removes the inhibition of CyclinD1/CDK4/6 complex and allows for the phosphorylation of RB.
expression is associated with HG/invasive disease, additionally in the TCGA dataset E2F3 is amplified in 20% of the tumors (43, 53).
As with LG disease, next generation sequencing efforts have identified chromatin modifying genes that are significantly mutated in HG disease. In the TCGA data, after
TP53, the next 3 most significantly mutated genes were Histone-lysine
N-methyltransferase (MLL2), AT-rich interactive domain-containing protein 1A (ARID1A),
and KDM6A. Gui et. al. has previously reported that ARID1A mutations are present in both HG and LG disease in roughly equal numbers, additionally KDM6A were present in both HG and LG, however it was significantly enriched within the LG tumors (44).
Figure 3: Genomic alteration in bladder cancer
Schematic of pathologic subtypes and predominate genomic alterations in each group. Percentages represent proportion of tumors at diagnosis, followed by
recurrence/progression rate.
Normal
Urothelium
Low Grade
High Grade
FGFR3
HRAS
RB pathway
TP53
70%
30%
80%
20%
RB pathway
Figure 4: RB signaling pathway
Diagram of the RB signaling pathway. p21 and p16 inhibit CDK4/6 and CDK2 activity, respectively. Upon activation, the CDKs phosphorylate RB causing its disassociation with E2F3 allowing for E2F3 translocation to the nucleolus. E2F3 is then able to bind the promoter of its target genes inducing cell cycle progression and proliferation.
cyclin D1 CDK4/6 p16Ink4a
RB
RB
E2F3
E2F3
P
Cell cycle Proliferation cyclin E1 CDK2
2.2 Molecular Signatures of Bladder Cancer
As previously discussed, LG non-invasive, and HG invasive, tumors have distinct genomic alterations. In addition to genomic alterations, numerous group have reported on distinct gene expression patterns (54-60). In 2005, Blaveri et. al. reported that, using hierarchical clustering, muscle invasive and superficial tumors could be distinguished based on gene expression pattern. They then went on to identify a gene signature that can discriminate between superficial and muscle invasive disease, as well as signatures for prognosis and the classification of tumors as transitional cell carcinoma or squamous cell carcinoma (58). Similar approaches used by Sanchez-Carbayo et. al. resulted in gene profiles for the same two groups, superficial and invasive; however, they
additionally reported generation of a signature of progression and metastasis by using patients with lymph node metastases and poor survival outcomes (56).
The Höglund group over the past 5 years has published a series of papers in which they have performed DNA and RNA analysis on a cohort of muscle invasive and superficial tumors. These papers initially identified two subtypes that they termed MS1 and MS2 which correlated highly with LG and HG histology respectively. The MS1 group contained increased FGFR3 mutations and was relatively genomically stable, whereas the MS2 group was enriched for TP53 mutations and high numbers of focal genomic amplifications (61). The group then went on to integrate the copy number, mutation and RNA data to identify five molecular clusters, of which three were primarily composed of invasive tumors (62). This was followed up using microarray data to
Unstable, Infiltrate, Urobasal B, and SSC-like) . One of these subtypes encompassed the MS1 group previously described in Lindgren et. al., however the MS2 group was divided into 4 additional subtypes (63). Overall, Urobasal B and SCC-like have similar gene expression patterns, differing in the Urobasal B subtype having an increase in an FGFR3 signature. The increase in FGFR3 signature in the Urobasal B subtype may be the result of the Urobasal B subtype having a higher number of non-invasive tumors, whereas the SCC-like subtype has a majority invasive tumors (63). While the subtypes appear to be prognostic, it is important to note that the poor performing subtypes, SCC-like and Urobasal B, have the highest percentage of muscle invasive tumors. In 2013, Sjödahl developed an immunohistological staining strategy using 20 markers to identify the aforementioned subtypes. This IHC based strategy was only able to accurately separate the Urobasal A, SCC-like, and genomically unstable tumors, the authors noted that the Urobasal B tumors were unable to be reproducibly identified.
To this point gene expression profiling efforts have focused on the utilization of a combination of LG and HG tumors, however, since pathologists can reliably identify LG and HG tumors, molecular signatures of these two groups are not clinically useful.
Multiple groups have recently addressed the identification of clinically relevant subtypes within HG tumors (43, 65, 66). These studies used cohorts of only HG tumors to identify multiple subtypes within HG bladder tumors. Choi et. al. identified three subtypes, basal, luminal and p53-like. The basal subtype was associated with decreased overall survival and high expression of high molecular weight keratins, similar to the SCC-like and Urobasal B subtypes reported by Sjödahl, whereas the luminal subtype had improved survival and enrichment for FGFR3 mutations. The third subtype, p53-like, was chemoresistant and had expression patterns related to wild type p53 expression (66).
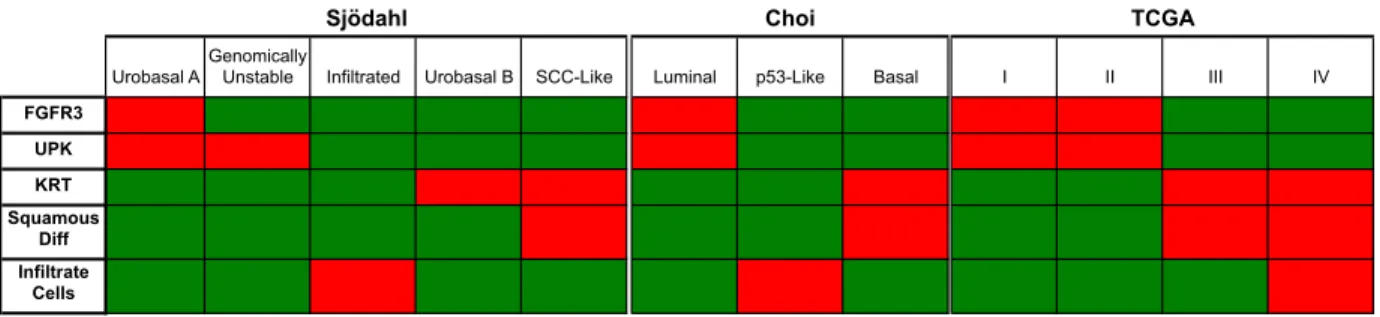
When comparing common features between these three studies, a picture emerges of 2-3 unique subtypes; 1) FGFR3 high, UPK high; 2) KRT high with
squamous differentiation; 3) samples with increased tumor infiltrating cells. While these subtypes seem to be reproducible and have been suggested to be prognostic, there still remains a need to derive a clinically useful tool for discriminating the subtypes based on a minimal set of differentially expressed genes.
Table 1: Comparison of muscle invasive subtypes
Urobasal AGenomically Unstable Infiltrated Urobasal B SCC-Like Luminal p53-Like Basal I II III IV
FGFR3 UPK KRT Squamous
Diff Infiltrate
Cells
Summary
Taken together, evidence supports the notion that distinct genomic and
transcriptional profiles characterize LG and HG disease. LG disease is characterized by alterations of FGFR3, PIK3CA, andRAS as well as decreased levels of markers of differentiation and proliferation as compared to HG disease. HG bladder tumors are genomically unstable as compared to LG tumors and have alterations in DNA-damage response and cell cycle control. Additionally, HG bladder cancer is heterogeneous with varying degrees in expression of ERBB2, FGFR3 and genes involved in urothelial differentiation. While previous studies have identified molecular subtypes with some success, none have created a gene expression based predictor to differentiate molecular subtypes within HG muscle invasive bladder cancer.
Chapter 3: Intrinsic subtypes of high-grade bladder cancer reflect the hallmarks
of breast cancer biology1
3.1 Overview
We sought to define whether there are intrinsic molecular subtypes of high-grade bladder cancer. Consensus Clustering performed on gene expression data from a meta-dataset of high-grade, muscle invasive bladder tumors identified two intrinsic, molecular subsets of high-grade bladder cancer: “luminal” and “basal-like” that have characteristics of different stages of urothelial differentiation, reflect the luminal and basal-like molecular subtypes of breast cancer, and have clinically meaningful
differences in outcome. A gene set predictor: Bladder cancer Analysis of Subtypes by Expression (BASE47) was defined by Prediction analysis of microarrays (PAM) and accurately classifies the subtypes. Our data demonstrate that there are at least two molecularly and clinically distinct subtypes of high-grade bladder cancer and validate the BASE47 as a subtype predictor. Future studies exploring the predictive value of the BASE47 subtypes for standard of care bladder cancer therapies as well as novel
subtype-specific therapy is warranted.
1
3.2 Introduction
In the United States, urothelial carcinoma (UC) of the bladder is the fourth most common malignancy in men and eight most common in women with 74,690 new cases and 15,580 deaths expected in 2014 (1). Bladder cancer is heterogeneous and can be histologically divided into low-grade and high-grade disease. While low-grade tumors are almost invariably non-invasive (Ta), high-grade tumors can be classified based on whether tumors have invaded into the muscularis propria of the bladder: non-muscle invasive bladder cancer (NMIBC, Tis, Ta, T1) and muscle invasive bladder cancer (MIBC, ≥T2). Low-grade tumors are associated with a high rate of recurrence, yet an
excellent overall prognosis with a 5-year survival in the range of 90%. In contrast, high-grade, muscle-invasive bladder cancer has a relatively poor 5-year overall survival: 68% when T2 and decreasing to 15% for non-organ confined disease (pT3 and pT4) (1, 34).
Along with divergent pathologies and prognosis, low-grade and high-grade UCs are associated with distinct genetic alterations. For example, low-grade UC is enriched for activating mutations in FGFR3, PIK3CA and inactivating UTX mutations, whereas high-grade, muscle-invasive tumors are enriched for TP53 and RB1 pathway alterations (41, 42, 44, 47, 62, 67-69).
Several reports have examined the gene expression profiles of primary bladder tumors. From these studies, it is apparent that low-grade, non-invasive and high-grade, muscle-invasive tumors harbor distinct gene expression patterns and that further
molecular subsets can be found within low-grade and high-grade tumors (56-58, 61,
tumor stage, lymph node metastases, or bladder cancer progression (54-60). Taken together, there are established gene expression patterns that differentiate low-grade and high-grade tumors, however there is little data identifying intrinsic subtypes specifically within high-grade disease. We have identified two intrinsic, molecular subsets of high-grade bladder cancer: “luminal” and “basal-like” with differences in clinical outcome. In addition, we have developed a 47-gene predictor, “BASE47”, which can accurately classify high-grade UC into luminal and basal-like tumors. The
3.3 Results
Consensus Cluster reveals two distinct molecular subtypes of high-grade bladder
cancer.
Previous studies examining the gene expression changes associated with
bladder cancer have assessed both low and high grade tumors in aggregate (56-58, 63,
67, 71). We therefore looked exclusively for intrinsic subtypes of high-grade disease agnostic to clinical stage or outcome. We first created a meta-dataset of 262 high grade, muscle-invasive tumors, curated from four publically available datasets (57, 63, 71, 72)) (Table 2).In parallel, two independent sets of high-grade tumors from MSKCC and the TCGA were used as validation (MSKCC n=49, TCGA n=129) (69). In both the meta and MSKCC datasets, Consensus Cluster identified two groups (K=2) as the optimal number of molecular subtypes as defined by the criterion of subclass stability (Figure 5A, 5B 5C and Supplemental Figure 1A, 1B).
The intrinsic molecular subtypes of bladder cancer differentially express markers
of urothelial differentiation.
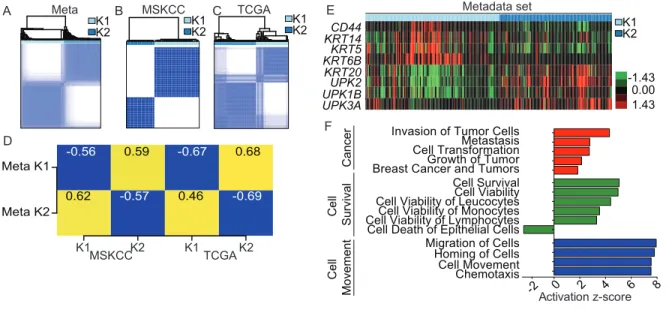
To understand the gene expression patterns that differentiate the intrinsic subtypes of high-grade bladder cancer, we performed 2-class significance analysis of microarrays (SAM) comparing Cluster 1 and Cluster 2 from the meta-dataset. 2,393 genes were found to be differentially expressed (FDR cut off of 0) (Apendix A). The intrinsic molecular subtypes were characterized by gene expression patterns
representative of urothelial differentiation. Cluster 1 (K1) of the meta-dataset, expressed high levels of the high molecular weight keratins [HMWK] (KRT14, KRT5, KRT6B) and
CD44, which are expressed in urothelial basal cells (33, 73). In contrast, Cluster 2 (K2) expressed high levels of uroplakins (UPK1B, UPK2, UPK3A) as well as the low
molecular weight keratin (LMWK), KRT20 (Figure 5E), characteristic of urothelial umbrella cells (73). Moreover, the gene expression of KRT5 was inversely correlated with both UPK2 and KRT20 across all tumors (Supplemental Figure S1D and S1E). Similar findings were seen in the MSKCC dataset (Supplemental Figure S1F-S1G). Ingenuity Pathway Analysis (IPA) was used to understand if processes other than urothelial differentiation were associated with the intrinsic subtypes. IPA revealed that Cluster 1 (K1) tumors were enriched in gene pathways involving cancer, cell survival, as well as cell movement (Figure 5F). In aggregate, these findings
Bladder Cancer Analysis of Subtypes by Expression of 47 genes (BASE47)
accurately predicts basal-like and luminal subtypes.
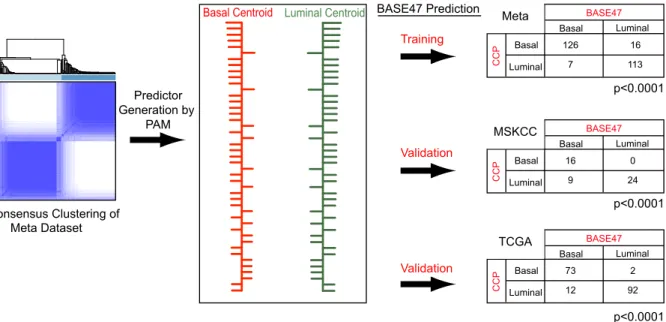
We next sought to define a minimal set of genes that could accurately classify bladder tumors into the luminal and basal-like bladder intrinsic subtypes. To this end, we applied prediction analysis of microarrays (PAM) to our meta-dataset and derived a 47-gene signature (Appendix B) that could accurately classify basal-like and luminal tumors relative to Consensus Cluster calls (Figure 6). A pairwise comparison of the subtype classification by Consensus Cluster relative to classification by BASE47,
showed a strong correlation in the Meta Dataset, MSKCC and TCGA datasets (both chi square p < 0.001).
BASE47 Subtypes correlate to previously published tumor subtypes
Two papers published concurrently with Damrauer et. al. reported multiple
Intrinsic bladder subtypes have differential survival.
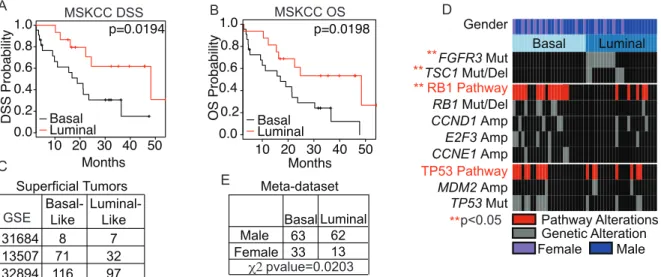
We next asked whether the intrinsic bladder subtypes, had prognostic significance. Basal-like tumors (as determined by BASE47) had a significantly
decreased disease-specific and overall survival (p=0.0194 and p=0.0198 respectively) (Figure 8A). Moreover, of the clinicopathologic features available to us in the MSKCC dataset (TNM Stage, mixed histology, and gender), only BASE47 subtype was found to be significant for disease specific survival by univariate analysis (Table 3, and
Supplemental Figure S2A). Furthermore, to assess the prognostic value of the BASE47 relative to published prognostic signatures derived from muscle-invasive, high-grade tumors, we generated “Good” and “Poor” prognosis calls on the MSKCC tumors using the published gene lists (56, 58) (Supplemental Figure S2B and S3C). However, neither gene signature held prognostic value (Supplemental Figure S2D and S2E). Therefore, the BASE47 intrinsic bladder subtypes not only reflect bladder cancer biology but have prognostic value.
Interestingly, while the BASE47 predictor was developed on muscle-invasive tumors, we also noted that when applied to a meta-dataset of superficial tumors, it classified a significant proportion them as basal-like (Figure 8C), suggesting that the intrinsic subtypes may exist in non-muscle invasive bladder cancer and that the
BASE47 might serve as a prognostic marker of recurrence and / or progression in non-muscle invasive bladder cancer.
The MSKCC tumors have been previously characterized for bladder cancer relevant genetic alterations (69). We examined the relative enrichment of these
molecular events in the bladder subtypes (Figure 8D). Notably, FGFR3 (p<0.001) and
TSC1 (p=0.02) mutations were significantly enriched in the luminal subtype while RB1 pathway alterations were significantly enriched in basal-like bladder cancer (p = 0.009).
Multiple studies have shown that females have a poorer bladder cancer specific outcome than males (74). There was a trend towards enrichment of basal-like tumors in female patients in the MSKCC dataset (Figure 8D, p = 0.1137), and a significantly higher incidence of basal-like bladder cancer in female patients in the meta-dataset with annotated gender and TCGA (Figure 8E and Figure 9). This enrichment of basal-like bladder cancer may in part explain the decreased cancer specific outcomes in women.
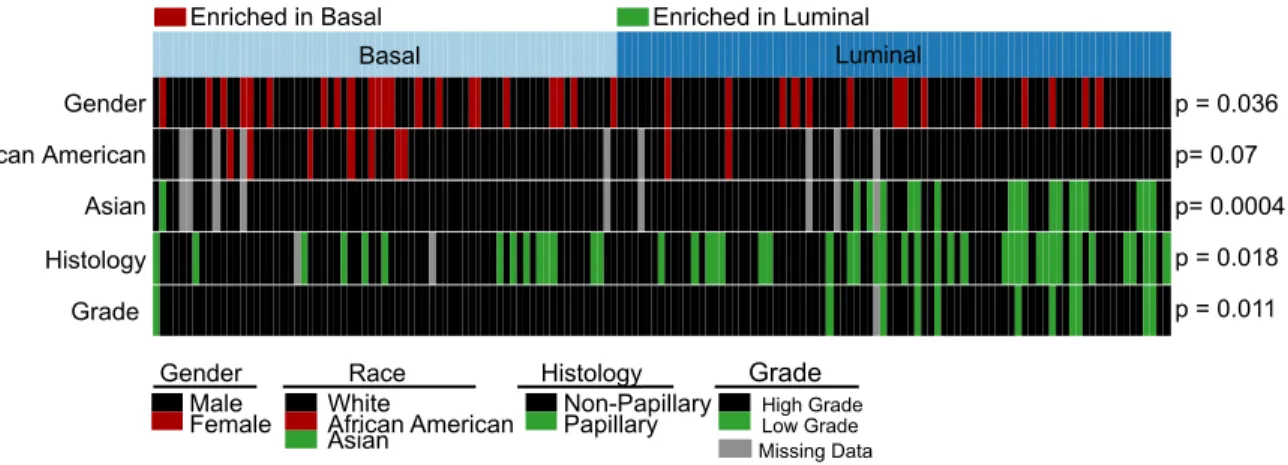
Additionally, the TCGA provided clinical data associated with race, grade and histology. Interestingly, the papillary histology that is classically associated with LG tumors, is enriched in the luminal subtype (p=0.018). The luminal subtype was also enriched for low-grade tumors, muscle invasive tumors (p=0.011). Basal tumors, as previously noted, were enriched for female patients as well as trended toward
enrichment in African Americans (p=0.07), where as luminal tumors were enriched for Asian patients (p=0.0004) (Figure 9).
Basal-like bladder cancer is enriched for the signatures of basal-like breast
cancer and tumor initiating cells (TIC).
breast cancer related genes: red, urothelial related genes: blue). Moreover, when Gene Set Enrichment Analysis (GSEA) was performed on the meta-dataset to identify gene sets enriched in the intrinsic subtypes, multiple breast cancer-related gene signatures were enriched in the basal-like bladder subtype as well as signatures related to
mammary stem cells (Appendix C). Conversely, multiple breast cancer derived luminal gene signatures were enriched in the luminal bladder cancer subtype. In keeping with these findings, we saw that a previously published bladder TIC signature (33) was enriched in the basal-like subtype by both hierarchical clustering (chi squared p= 2x10 -16) (Supplemental Figure S4A) as well as by GSEA (Supplemental Figure S4B)
suggesting that basal-like bladder cancer possesses a more “stem-like” phenotype, similar to previous observations described in basal-like breast cancer (75).
The intrinsic bladder subtypes reflect the attributes of breast cancer subtypes
We next asked whether the basal-like and luminal bladder cancer subtypes correlated with any of the previously defined molecular subtypes of breast cancer (76,
well as normal-like breast whereas luminal bladder cancer had positive correlations to both lum A and lum B breast subtypes. A similar comparison using published gene expression data from The Cancer Genome Atlas (TCGA) showed that while there were other cross-cancer similarities, the molecular association between breast and bladder cancer was relatively strong (Supplemental Figure S4C). Finally, strikingly, when the PAM50 was applied to our meta-dataset of bladder tumors, there were positive correlations between basal-like bladder tumors and the basal centroid and luminal bladder tumors and the luminal A centroid (Supplemental Figures 4D and 4E).
To better visualize this association, we hierarchically clustered the bladder tumors using a comprehensive list of 1906 genes (1,426 were present in the meta-dataset) that have been previously shown to define the intrinsic subtypes of breast cancer (80). The breast specific gene list clustered the bladder tumors along the lines of basal-like and luminal bladder subtypes (chi squared p=2.2e-16) (Supplemental Figure 4F). Furthermore, gene signatures representative of basal-like and luminal breast cancer as well as well-defined breast cancer related oncogenic pathway signatures faithfully clustered basal-like and luminal bladder tumors in both datasets (Figure 10B and Supplemental Figure 5A). Basal-like bladder tumors displayed enhanced MYC and E2F3 pathway signatures while luminal tumors appeared enriched in the set of genes characteristic of the HER2 amplicon. These data in aggregate strongly demonstrate that the gene expression patterns that distinguish basal-like and luminal bladder cancer reflect the RNA expression patterns that define the intrinsic subtypes of breast cancer.
The recently described claudin-low molecular subtype of breast cancer is
characterized by low expression of the claudin tight junction proteins (claudins 3, 4, and 7) and upregulation of markers of EMT as well as stem cell-like features (79). Tumors from the meta-dataset were classified based on an 807 gene signature, which
accurately defines claudin-low breast cancer (79). Overall, 16% of the meta-dataset tumors (Figure 5A) and 26% of the MSKCC tumors (Supplemental Figure S8) were identified as claudin-low. When clustered based on genes that define key molecular pathways in claudin-low breast tumors (Breast cancer subtype markers, EMT markers, and TIC markers) (Figure 11A and Supplemental Figure 5B), the claudin-low bladder tumors displayed expression patterns indicative of claudin-low breast tumors.
3.4 Discussion
Using independent discovery in distinct datasets, we have defined two molecular subsets of high-grade urothelial carcinoma. The subtypes harbor molecular features that reflect different stages of urothelial differentiation. Luminal bladder cancers express markers of terminal urothelial differentiation such as those seen in umbrella cells (UPK1B, UPK2, UPK3A, and KRT20) while basal-like tumors express high levels of genes that typically mark urothelial basal cells (KRT14, KRT5, and KRT6B). The basal cell compartment is a common feature of most organs with stratified or
pseudostratified epithelium. It is characterized by its proximity to the basal lamina and is thought to harbor multipotent tissue stem cells important for normal tissue homeostasis and orderly regeneration after injury. Because basal cells are a long-lived population, they are potentially more likely to incur multiple genomic alterations including changes in their chromatin landscape. In this regard it is interesting to note that there appears to be a relatively high prevalence of mutations in histone and chromatin modifying genes in urothelial carcinoma (44).
basal-like breast cancer. These similarities may reflect the presence of urothelial basal cells and their corollary, the basal/myoepithelial cells of the breast. In both tissues, these basal cells represent a multipotent “stem/progenitor cell” population (81, 82) and their similar functional roles may explain their similar molecular profile.
There were differences between the breast and bladder cancer intrinsic subtypes as well. For example, while we identify a claudin-low subtype of bladder cancer. In contrast to breast cancer in which claudin-low tumors arise from multiple intrinsic subtypes, all of the claudin-low bladder tumors were a subpopulation of the basal-like subtype. Furthermore, despite a subset of luminal bladder tumors having elevated expression of the HER2 amplicon, we did not see any significant correlation to the Her2-enriched breast subtype by our correlation matrix (Figure 10A).
Our study has created a gene signature, the BASE47, which accurately discriminates intrinsic bladder subtypes. Interestingly, even in superficial bladder tumors, there appears to be a significant number of basal-like tumors. While the characteristics of our meta-dataset did not allow us to determine whether the subtypes were prognostic or predicted the progression to muscle-invasive disease in superficial bladder tumors, these will be important questions to answer and have important clinical implications such as early cystectomy for patients with high-grade T1 disease. The ability to accurately classify basal-like and luminal bladder subtypes with only 47 genes (BASE47) should allow the adoption of the BASE47 to formalin-fixed, paraffin
embedded (FFPE) tissues allowing its widespread use.
found that females have an increased incidence of basal-like bladder cancer, which is associated with a worse outcome. To what extent this increased prevalence of basal-like bladder tumors in women contributes to their poorer outcome remains unclear. Moreover, whether this association suggests that the pathogenesis of bladder cancer in females (i.e. chronic inflammation) is different should be of future interest.
In summary, the basal-like and luminal intrinsic subtypes of bladder cancer reflect many aspects of physiologic urothelial development as well as breast cancer biology. These findings underscore the notion that there are common themes underlying the development and maintenance of solid tumors that extend beyond overlapping mutational spectra. An appreciation of subtype heterogeneity has
3.5 Materials and Methods
Training Dataset Analysis – A meta-dataset was generated by combining the muscle invasive (≥T2) UC samples from four publically available data sets (GSE13507,
GSE31684, GSE32894, GSE5287) with clinical annotation provided by the Michor Lab (Dana-Farber Cancer Institute, Boston MA). The data were normalized, median
centered by gene, and merged into a single dataset consisting of n=262 tumors. The Mean Absolute Deviation (MAD) was computed across samples by gene. Genes with a MAD score of >0.10 were selected for clustering analysis (7303 genes). Consensus hierarchical clustering was performed as described previously (83) with 90% resampling and 1000 iterations. Two Class significance analysis of microarrays (SAM; FDR=0) was performed to generate subtype-specific gene lists (84). The significant genes and
corresponding fold changes as determined by SAM were analyzed by Ingenuity IPA (Ingenuity Systems, Redwood City, CA) for predicted pathway activation. Gene set enrichment analysis (GSEA) was performed comparing basal and luminal tumors against MSigDBv4.0c2 (85, 86).
Validation Datasets – Gene expression data were derived from 49 high-grade tumors from Memorial Sloan-Kettering Cancer Center (MSKCC) using Human HT-12
Expression BeadChip arrays (Illumina) as previously described
(69). The MSKCC and TCGA datasets were normalized, median centered and the MAD was computed across samples by gene. Genes with a MAD score of >0.10 were
meta-dataset (83). The resulting subtypes assignments for K=2 using consensus cluster plus were used to validate the training dataset. Centroids were generated for both the Meta and MSKCC datasets using all common genes and correlations were calculated by 1-Pearson correlation. Copy number alterations and hotspot mutation analyses were determined as previously described(69).
Subtype Predictor – Prediction Analysis of Microarrays (PAM) was used to determine the minimal number of genes that could accurately predict subtype classification on the meta-dataset using the consensus clustering calls as the reference (87). The resulting 47-gene predictor (delta=6.3) was then used to classify the MSKCC samples (87). Tumors were then analyzed for enrichment of mutations or copy number alteration (69) by chi square or fisher’s exact test when appropriate. Categoric survival analyses were performed using a log-rank test and visualized with Kaplan-Meier plots.The BASE47 was then applied to superficial tumors, which were excluded from the Meta dataset. The superficial were normalized and median centered as previously described and BASE47 calls were made using PAM.
3.6 Figures
Table 2: Dataset Characteristics
Training Datasets (Meta) Validation Dataset
Als Kim Riester Sjödahl Iyer
GEO ID GSE5287 GSE13507 GSE31684 GSE32894 cBioPortal
Clinical Characteristic No. No. No. No. No.
Sex
Male NA NA 57 68 35
Female NA NA 21 25 14
Stage
pT0 0 23 5 116 4
pT1 0 80 10 97 6
pT2 0 31 17 85 5
pT3 0 19 42 7 17
pT4 30 11 19 1 16
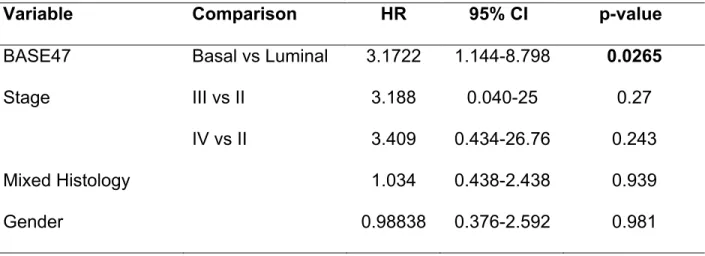
Table 3: MSKCC - Univariable Cox Regression Analysis of Disease Specific Survival
Variable Comparison HR 95% CI p-value
BASE47 Basal vs Luminal 3.1722 1.144-8.798 0.0265
Stage III vs II 3.188 0.040-25 0.27
IV vs II 3.409 0.434-26.76 0.243
Mixed Histology 1.034 0.438-2.438 0.939
Figure 5: Discovery of two distinct subtypes of bladder cancer
(A) Consensus Clustering was performed on 262 muscle-invasive tumors, curated from four publically available datasets (Meta dataset), yielding two subtypes. (B) Consensus Clustering was independently performed on a dataset of high-grade bladder tumors obtained from MSKCC (n=49) as well as the (D) TCGA dataset (n=129). (C) The median gene expression of all common genes between the datasets were compared and the Pearson correlation was plotted (yellow=correlation, blue=anti-correlation). Numerical values represent the Pearson correlation. (E) Gene expression of epithelial and urothelial markers were visualized by heatmap, supervised by consensus cluster plus calls in the meta-dataset. KRT5 mRNA expression was plotted (F) Significantly differentially expressed genes between K1 and K2 from the meta-dataset and their respective fold change, as determined by 2-class SAM (3,374 genes, FDR=0) were analyzed for predicted pathway enrichment by Ingenuity Pathway Analysis (IPA). Selected significant pathways enriched in K1 are represented.
K1
K2 KRT14CD44
KRT5 KRT6B KRT20 UPK2 UPK1B UPK3A -1.43 0.00 1.43 Meta MSKCC
A B C E
F K1 K2 Metadata set K1 K2
-2 0 2 4 6 8
Chemotaxis Cell Movement Homing of Cells Migration of Cells Cell Death of Epithelial Cells Cell Viability of LymphocytesCell Viability of Monocytes Cell Viability of LeucocytesCell Viability Cell Survival Breast Cancer and TumorsGrowth of Tumor Cell TransformationMetastasis Invasion of Tumor Cells
Activation z-score Cancer Cell Survival Cell Movement K1 K2 D Meta K2 Meta K1 -0.56 -0.67 -0.57 -0.69 0.59 0.68 0.62 0.46
K1 K2 K1 K2
MSKCC TCGA
Figure 6: Generation of the BASE47 subtype predictor
(A) Prediction Analysis of Microarrays (PAM) was performed using the basal-like and luminal subtype calls generated by consensus cluster plus. A predictor consisting of 47 genes was generated that accurately predict the subtypes from the meta-dataset training set (p<0.001) as well as a MSKCC validation dataset (45/47 gens
present)(p<0.001). (B) The BASE47 gene list was used to cluster the MSKCC dataset, showing two distinct expression profiles. BASE47 genes are listed along the right.
Consensus Clustering of
Basal Luminal Basal Luminal BASE47 CCP 16 24 0 9 Basal Luminal Basal Luminal BASE47 CCP 126 113 16 7 BASE47 Prediction Predictor Generation by PAM Meta Dataset
Basal Centroid Luminal Centroid
CDK6 AHNAK2 CHST15 EMP3 ALOX5AP CD14 GLIPR1 FAP PRRX1 PALLD PDGFC PRKCDBP MSN MT1X MT2A TUBB6 FAM59A CYP2J2 BHMT PLEKHG6 GATA3 GPD1L CYP4B1 FAM174B C10orf116 HMGCS2 RAB15 FBP1 PPARG CAPN5 PPFIBP2 SCNN1B SCNN1G TMPRSS2 SLC9A2 GDPD3 UPK2 VGLL1 UPK1A TRAK1 SPINK1 TOX3 TBX2 TMEM97 RNF128 SEMA5A SLC27A2
BASE47 Choi et. al. TCGA Basal Basal Luminal p53-like Luminal I II III
IV -3.00 -2.00 -1.00
0.00 1.00 2.00 3.00
BASE47 Choi et. al. TCGA
BASE47 Calls vs. TCGA Calls
I II III IV
0 10 20 30 40 Basal Luminal TCGA Subtypes Tu m or N um be r
BASE47 Calls vs. Choi Calls
Basal Luminal p53-like 0 10 20 30 40 50 Basal Luminal
Choi et. al. Subtypes
Figure 7: BASE47 calls are similar to previously published calls for the TCGA
Figure 8: Luminal and basal bladder cancer have differential survival and are
associated with distinct genomic alterations
AKaplan-Meier plot for muscle-invasive tumors from the MSKCC set (≥pT2) was
generated for (A) disease specific and (B) overall survival. Basal-like tumors (n=22) had a significantly decreased disease free and overall survival as compared to luminal tumors (n=16) (p=0.0194 and p=0.0081 respectively). (C) Superficial tumors, which were not included in the generation of BASE47, were subjected to BASE47 subtype prediction. (D) Sequencing was performed on common mutations in bladder cancer.
FGFR3 and TSC1 alterations were significantly enriched in luminal bladder cancer whereas alterations of the RB1 pathway were enriched in basal-like bladder cancer.
TP53 alterations were distributed evenly in both subtypes. (D) Basal-like and luminal tumors from the meta-dataset were annotated for gender (2/4 datasets). Basal-like bladder cancer was significantly enriched in female patients (chi square p
value=0.0203).
Months 10 20 30 40 50
0.0 0.2 0.4 0.6 0.8 1.0
DSS Probability Basal Luminal
p=0.0194
Months
MSKCC DSS MSKCC OS
Female Male
Pathway Alterations Genetic Alteration Gender
FGFR3 Mut
TSC1 Mut/Del
RB1 Pathway
RB1 Mut/Del
CCND1 Amp
E2F3 Amp
CCNE1 Amp
TP53 Pathway
MDM2 Amp
TP53 Mut
Basal Luminal
A B D
OS Probability ** ** ** **p<0.05 Basal-Like Luminal-Like
31684 8 7
13507 71 32 32894 116 97 Superficial Tumors
GSE Basal Luminal
Male 63 62
Female 33 13
Meta-dataset
pvalue=0.0203
E C
Figure 9: Basal and luminal bladder cancer have distinct clinical features.
Clinical data for the TCGA tumors were correlated to the basal and luminal subtype calls. Basal bladder cancer was enriched for female patients (p=0.036) trended toward enrichment in African American patients (p=0.07) Luminal bladder cancer was enriched for Asian patients p=0.0004), as well as papillary histology (p=0.018) and low grade tumors (p=0.011).
Gender
African American
Histology
Grade
Basal Luminal
p = 0.011 p = 0.018 p= 0.07
p= 0.0004 p = 0.036
Gender Race Histology Grade
Male
Female African AmericanWhite Non-PapillaryPapillary Asian
High Grade Low Grade
Enriched in Luminal Enriched in Basal
Figure 10: Basal-like and luminal bladder cancer correlate to the intrinsic
molecular subtypes of breast cancer
(A) Median gene expression of genes present in the breast cancer specific intrinsic gene list were determined for each bladder and breast subtype and 1-pearson correlation was calculated comparing bladder subtypes (bladder tumors) to breast subtypes (breast tumors) in both the Breast TCGA and UNC337 datasets. (B) Waterfall plots representing the correlation of basal-like (black) and luminal (red) bladder tumors to the Basal and (C) Luminal A breast cancer centroid as determined by the PAM50. (D)
The meta-dataset of bladder tumors were clustered by genes that defined the intrinsic subtypes of breast cancer. Tracks indicated bladder cancer subtypes as well as
Basal LumA Normal
Luminal Basal LumB Her2 TCGA UNC 337 TCGA UNC 337 0.7 1.0 1.3
1-Pearson Correlation
Meta Bladder LuminalBasal
Breast
A
Luminal Basal
MSKCC Bladder Luminal
Basal
Basal LumA NormalHer2 LumB
Breast
Luminal Cluster| PMID: 21214954 GATA3| PMID:16505416
GATA3| PMID:15361840 Estrogen Reg.| PMID:16505416
Basal Cluster| PMID: 21214954 Mature Luminal Down| PMID:19648928 Luminal Progenitor| PMID:20346151
MaSC| PMID:20346151
Myc Targets| PMID:18443585 Oncogenic E2F3| PMID:16273092 Her2 Amplicon| PMID: 21214954 Metaplastic| PMID:19435916
Luminal Breast
Basal Breast
Figure 11: A subset of basal-like bladder tumors are claudin-low
(A) The meta dataset was hierarchically clustered using representative genes known to define claudin-low breast tumors. Claudin low subtype designation was performed using a previously defined 807 gene signature. (B) A Kaplan-Meier plot was generated
comparing disease specific survival and (C) overall survivalof the basal, luminal and claudin low subtypes.
KRT5 KRT14 KRT17 KRT18 KRT19 ESR1 PGR GATA3 ERBB2 CLDN3 CLDN7 CLDN4 CDH1 VIM SNAI2 TWIST1 ZEB1 ZEB2 CD44 EPCAM MUC1 THY1 ALDH1A
Breast Cancer Subtype Markers
EMT
Markers
TIC
Markers
Claudin Low Other
Figure 12: Proposed model of urothelial tumorgenesis and relationships to
intrinsic subtypes of breast cancer
(A) Low-grade (LG) and high-grade (HG) urothelial carcinoma are associated with specific genetic alterations. Low-grade papillary tumors often incur FGFR3, RAS, and receptor tyrosine kinase alterations, while high-grade tumors are characterized by loss of tumor suppressor genes such as PTEN, TP53, and RB1 pathway alterations. While most LG tumors recur as LG, a small proportion will progress to HG tumors in
3.7 Supplemental Figures
0.0 0.2 0.4 0.6 0.8 1.0 0.0 0.2 0.4 0.6 0.8 1.0
MSKCC consensus CDF
consensus index CDF CD44 KRT14 KRT5 KRT6B UPK1A KRT20 UPK2 UPK3A K1 K2 -2 0 2
0.0 0.2 0.4 0.6 0.8 1.0 0.0 0.2 0.4 0.6 0.8 1.0
Meta Dataset consensus CDF
consensus index 2 3 4 5 6 7 8 9 10 MSKCC A B C
0.0 0.2 0.4 0.6 0.8
0.0
0.2
0.4
0.6
KRT5 vs. KRT20 (MSKCC)
KRT5 Expression
KRT20 Expression
K1 K2 p=0.0122
0.0 0.2 0.4 0.6 0.8
0.0
0.2
0.4
0.6
KRT5 vs. UPK2 (MSKCC)
KRT5 Expression
UPK2 Expression
K1 K2 p=3.07e-5
-2 0 2 4 6
-3 -2 -1 0 1 2 3 4 KRT5 Expression UPK2 Expression K1 K2 p = 2.2e-16 KRT5 vs. UPK2 (Meta)
-2 0 2 4 6
-2 -1 0 1 2 3 KRT5 Expression KRT20 Expression K1 K2 p = 2.1e-11 KRT5 vs. UPK2 (Meta)
D E
F
Supplemental Figure 1: Consensus Clustering defines two distinct molecular
Supplemental Figure 2: Clinical variables are not significantly associated with
disease specific or overall survival and previous muscle invasive signatures are
not prognostic in the MSKCC dataset. (A) Kaplan-Meier plots for disease specific
10 20 30 40 50
0.0 0.2 0.4 0.6 0.8 1.0
Disease Specific Survival Stage IIStage III Stage IV
Log Rank p=0.463
Months
10 20 30 40 50
0.0 0.2 0.4 0.6 0.8 1.0
Disease Specific Survival
Basal Luminal
Log Rank p=0.0194
Months
10 20 30 40 50
0.0 0.2 0.4 0.6 0.8 1.0
Disease Specific Survival
Months Female Male
Log Rank p=0.981
10 20 30 40 50
0.0 0.2 0.4 0.6 0.8 1.0
Disease Specific Survival
Log Rank p=0.939
TCC
Divergent Differentiation
Months
MSKCC Disease Specific Survival BASE47
Gender
Stage
Histology A
Blaveri et. al.
MSKCC
Basal Luminal BASE47
Sanchez-Carbayo et. al.
MSKCC
Basal Luminal BASE47
10 20 30 40 50
0.0 0.2 0.4 0.6 0.8 1.0
MSKCC by Blaveri et. al.
OS Probability
Cluster 1 Cluster 2
Log Rank p=0.236
Months 10 20 30 40 50
0.0 0.2 0.4 0.6 0.8 1.0
MSKCC by Sanchez-Carbayo et. al.
OS Probability
Cluster 1 Cluster 2
Log Rank p=0.414
Months
B C
survival were generated based on gender, stage and whether a tumor was pure urothelial or of mixed differentiation. (B) The MSKCC dataset was hierarchically
clustered by prognostic signatures from Blaveri et. al. and (C) Sanchez-Carbayo et. al.
(D,E) The tumors were then classified based on the two major clusters (black and red) and Kaplan-Meier plots were made to determine the prognostic value of these
CYP2J2 DHRS2 FXYD3 CROT GPX2 MECOM MAOA RAPGEFL1 S100P MGST2 ICA1 CNGA1 MCCC1 IFNA14 ATP8B1 ACSF2 CYP4F12 TJP3 CYP4B1 ELF3 FOXA1 HMGCS2 FAM174B BCAS1 CYB5A GPD1L GATA3 EPN3 ERBB3 EVPL BCAT2 ADIRF CAPN5 PPFIBP2 UPK1A PLCE1 UPK2 TRAK1 SCNN1B SCNN1G TMPRSS2 TLE2 TBX2 TMEM97 ZBTB7C TOP2B RAB15 NR2F6 TM7SF2 PIK3C2B PLEKHG6 SUOX SNCG RAB11A VIPR1 VGLL1 SH3GLB2 ZNF443 TBX3 SLC9A2 SPINK1 SLC29A3 PSCA PPARG -0.97 -0.65 -0.32 0.00 0.32 0.65 0.97 K1 K2 Urothelial Related
Breast Cancer Related
Supplemental Figure 3: Makers of luminal breast cancer are co-expressed with
-0.88 -0.59 -0.29 0.00 0.29 0.59 0.88 Basal Luminal
Chan et. al.
TIC Signature
Activated Repressed
0 50 100 150 200 250
0.0
0.5
1.0
Samples
Correlation to Basal Centroid
Basal Luminal
0 50 100 150 200 250
0.0
0.5
1.0
Samples
Correlation to LumA Centroid
Basal Luminal
Basal Luminal KIRC LUAD GBM COAD OV READ UCEC
LumB LuminA Her2 Basal TCG A Breast 0.9 1.0 1.1 1.2
1 - Pearson
Meta Dataset TCGA Basal Luminal Bladder Subtypes PAM50 Calls Basal LumA LumB Her2 Normal -0.56 -0.37 -0.19 0.00 0.19 0.37 0.56
Parker et. al.
Intrinsic Breast Cancer Subtype Gene List
Supplemental Figure 4: Basal-like bladder cancer possesses tumor initiating cell
traits and is molecular similar to basal breast cancer. (A) A 467-gene signature of bladder TIC expression (330/467 genes present in the meta-dataset) was used to hierarchically cluster the tumors from the meta-dataset. (B) GSEA was performed using the bladder TIC gene set. The basal subtype was significantly enriched for the TIC signature (nominal p value=0.006). (C) The intrinsic breast cancer gene list was used to correlate basal, her2, Lum A and Lum B breast tumors from the TCGA to the basal and luminal bladder cancer subtypes from the Meta-datasettumors as well as 7 additional tumors from The Caner Genome Atlas (TCGA). (D) Waterfall plots representing the correlation of basal-like (black) and luminal (red) bladder tumors to the Basal and (E)
Supplemental Figure 5: Basal, luminal, Caludin Low and oncogenic breast cancer
signatures are associated with intrinsic molecular subtypes of bladder cancer. (A)
The MSKCC datasets tumors were run against previously published breast cancer related gene sets (88) and the resulting pathway scores were clustered by hierarchical clustering and heatmaps were generated for visualization. (B) The MSKCC dataset was hierarchically clustered using representative genes known to define claudin-low breast tumors. Claudin low subtype designation was performed using an 807 gene signature.
Luminal Cluster| PMID: 21214954 GATA3| PMID:16505416 GATA3| PMID:15361840 Estrogen Reg.| PMID:16505416 Basal Cluster| PMID: 21214954 Mature Luminal Down| PMID:19648928 Luminal Progenitor| PMID:20346151
MaSC| PMID:20346151 Myc Targets| PMID:18443585 Oncogenic E2F3| PMID:16273092 Her2 Amplicon| PMID: 21214954 Metaplastic| PMID:19435916 Luminal Breast Signatures
Basal Breast Signatures
Chapter 4: Future Directions
4.1 BASE47 as a prognostic tool
Bladder cancer is a heterogeneous disease, histologically and molecularly. We have shown, using multiple independent datasets, that there are at least two molecular subtypes within HG, muscle invasive bladder cancer that are associated with distinct transcriptional and genomic patterns, clinical factors and survival. Additionally, these subtypes, basal and luminal bladder cancer, share molecular feature with basal and luminal breast cancer, respectively. However, two critical questions remain that need to be addressed in order for these subtypes to become clinically valuable: can the
BASE47 be adapted to a clinically relevant platform and are there expression
differences between the subtypes that can be exploited for the development of targeted therapies.
The prognostic ability of the BASE47 creates the potential for it to be a clinically relevant tool. Our current study allowed us to assess the BASE47’s prognostic ability on muscle invasive disease; however, future work to determine its ability to predict