Does a stepped approach using mixed-mode data
collection reduce attrition problems in a longitudinal
mental health study?
Adriaan W Hoogendoorn
1[email protected]
Femke Lamers
1Brenda W J H Penninx
1, 2, 3Johannes H Smit
11 Department of Psychiatry and the EMGO Institute for Health and Care Research, VU University Medical
Center Amsterdam, The Netherlands
2 Department of Psychiatry, Leiden University Medical Center, The Netherlands
3 Department of Psychiatry, University Medical Center Groningen, University of Groningen, The Netherlands
(Received January 2013 Revised August 2013) doi:10.14301/llcs.v4i3.240
Abstract
According to epidemiological standards for longitudinal studies, any appropriate attempt should be made to reach a high response rate. This also concerns re-contacting respondents in follow-up waves. In the Netherlands Study of Depression and Anxiety (NESDA), respondents, who refused to visit the study site for a follow-up interview and would have been lost in a single step approach, were offered an interview at their home (in a second step) or an interview by telephone (in a third step). The stepped approach intended to increase response rates, but as a by-product, the switching of the interview response setting introduced effects due to the three different modes for obtaining data. This study aimed to evaluate the benefits and detriments of the introduction of a stepped approach using mixed-mode data collection. The attained attrition in the stepped approach was compared to the attrition rate that would have been achieved if the design would have remained in a single mode. Logistic regression models were used to study if the attrition was related to patient characteristics, i.e. the attrition was selective. Propensity score matching was used to study if similar respondents reacted differently to different modes. The stepped approach using mixed-mode collection reduced the attrition from 22% to 13%, while the selectivity of the attrition was reduced on almost all socio-demographic variables, although the selectivity increased in variables that reflect the respondents’ mental health. Propensity score matching demonstrated no evidence of mode effects. Although the introduction of the stepped approach using mixed mode data collection did not completely solve the problem of attrition, we conclude that adding different modes was worthwhile.
1. Background
In health sciences, longitudinal research designs are used to follow samples of persons over a period of time. Such designs permit researchers to study the progression of diseases or other changes in health, wellbeing and illness at the individual level. For example, in the mental health setting, an important research topic is the course of anxiety and depression. In the Netherlands, approximately one out of four persons will be faced with these disorders at some time during their lives (Bijl, Ravelli & Van Zessen, 1998). It is still not clear why some persons are more susceptible to these disorders than others, or why some persons recover quickly while others suffer for long periods of time. A longitudinal (panel) design will provide data that allow researchers to investigate these kinds of questions.
One of the major problems in the analysis of longitudinal data is attrition. Attrition refers to the phenomenon that respondents drop out of a longitudinal study. There are several reasons why respondents drop out of the study. Some respondents cannot be traced after they have moved, some respondents can be traced but are hard to contact and other respondents refuse to cooperate when contacted. The occurrence of attrition is problematic, since it not only reduces sample size, but may also lead to biased estimates where the drop-out is non-random (Goldstein, 2009). For example, in a longitudinal study on the effect of smoking on cognitive decline, it appeared that attrition was associated both with smoking and with cognitive functioning. A relatively high attrition of smokers was found (due to mortality) in combination with a relatively low attrition of respondents with high cognitive scores. In this case, ignoring attrition resulted in an underestimation of the negative effect: weighting to account for attrition yielded estimates that were up to 86% higher (Weuve et al., 2012).
Similar problems occur in longitudinal mental health studies or in cohort studies in psychiatric epidemiology, where researchers found that mental status is predictive for attrition. In an epidemiological follow-up study (NHANES I), the researchers found that depressed respondents had a higher attrition rate even after adjustment for socio-demographic variables, health status variables and smoking behaviour, and suggested that depressive symptoms be measured at the baseline
interview in order to predict attrition, or to use the information to correct for potential bias (Farmer, Locke, Liu, & Moscicki, 1994). Similar results that mental status is predictive for attrition were found in other studies (de Graaf, Bijl, Smit, Ravelli, & Vollebergh, 2000; Fischer, Dornelas, & Goethe, 2001).
In order to deal with attrition, the standard practice is trying to keep it as low as possible. Low attrition can best be realized by putting effort into: reducing the different sources of panel attrition (Watson & Wooden, 2009), locating the sample members (Couper & Ofstedal, 2009): contacting the sample members (Groves & Couper, 1998), and getting cooperation from sample members by using incentives, stressing topic saliency and taking previous interview experiences into account (Groves & Couper, 1998; Lepkowski & Couper, 2002; Laurie & Lynn, 2009). In mental health settings, some researchers recommend intensive strategies to limit attrition by maintaining a continuous personal relationship between researcher and study participants (Susser, Schwartz, Morabia, & Bromet, 2012). In the general survey context, a modern tool to improve response rates is the use of mixed-mode surveys (de Leeuw, 2005; Dillman, Smyth, & Christian, 2009). Offering participants a certain mode initially, and - in case of non-response - offering participants a second or even third mode, can improve response rates and reduce non-response errors by getting responses from participants who refused the initial mode of data collection. This method, that we describe as a stepped approach using mixed-mode data collection, is also known as “offering multiple modes in a specific sequence” or a Type III of mixed mode survey (Dillman et al., 2009).
collection attractive for the purpose of attrition reduction, because respondents who were missed by a first mode can be reached by a second mode (Voogt & Saris, 2005). In the context of the present study, mode effects are delineated in the narrow sense of measurement errors, since differences in measurement errors are undesirable. Such effects on measurement errors can occur even if modes are comparable with respect to non-measurement error differences, e.g. if an interviewer is present or not, or if an interview is computer-assisted. From a meta-study on several studies that compared data collected in face-to-face and telephone interviews, the authors conclude that compared to face-to-face interviewing, telephone interviewing is associated with respondents who have a lower level of engagement in the interview, present themselves in more socially desirable ways and show more satisficing behaviour (Holbrook, Green, & Krosnick, 2003; Jackle, Roberts, & Lynn, 2006). An experimental study in the context of the European Social Survey confirmed the finding that telephone respondents were more likely to give socially desirable responses across a range of indicators, while no evidence was found for the hypothesis that telephone respondents were more likely to satisfice (Jackle et al., 2006).
A switch in survey mode in a longitudinal survey makes it problematic to determine if an observed change is a result from actual changes or from a change in survey mode (Dillman et al., 2009). Therefore, introducing a mixed-mode approach in a longitudinal survey may give us mixed results: on the one hand we expect a reduction of attrition as a favourable outcome, but on the other hand we may end up with mode effects that could complicate analyses.
This study aims to analyze the results of the introduction of a mixed-mode design, into a 2-year follow-up wave in a longitudinal naturalistic cohort study (n = 2,981), looking at the course of depressive and anxiety disorders. We will begin by describing the effect of introducing the mixed-mode survey design on the attrition rate. Recent literature points out that higher response rates (or lower attrition) do not guarantee lower non-response error. Therefore, we will also study the degree to which the stepped approach using mixed-mode data collection, prevents the attrition being dependent on respondent characteristics, i.e. to what extent we are faced with selective attrition.
Next, we will give attention to disentangling measurement errors from non-measurement errors (Van der Laan & Van Nunspeet, 2009; Vannieuwenhuyze, Loosveldt, & Molenberghs, 2010). Finally, we will consider the positive and negative effects of the introduction of the mixed-mode effects, and will evaluate whether the introduction of the mixed-mode design was worthwhile in a mental health setting.
2. Method
2.1. NESDA Sample
The Netherlands Study of Depression and Anxiety (NESDA) is a longitudinal naturalistic cohort study, consisting of 2,981 persons that included individuals aged between 18 and 65 year, the majority of which (2,329; 78%) had anxiety or depressive disorders and a smaller group of healthy controls (n = 652; 22%). Specification of the sampling and recruitment procedures is discussed in detail elsewhere (Penninx et al., 2008). Participants were recruited from several settings: from primary health care (general practitioners), from specialized mental health care and from the community, i.e. outside any health care, in order to increase the generalizability of results and to cover the full range of psychopathology. The participants in the study were recruited from September 2004 to the end of February 2007 at three study sites (Amsterdam, Groningen and Leiden). Approval of the study protocol was granted by the ethical review boards of all participating centres, and all participants gave written informed consent.
2.2. Switching from a single mode to a
mixed-mode design
The baseline measurement involved a four hour interview combined with two self-administered questionnaires, in which information was gathered on demographic variables, physical and social functioning, psychopathology, a medical examination, a cognitive computer task and collection of blood and saliva samples. All participants were interviewed in a face-to-face setting at the study site, and received travel expenses and a 15 euro gift certificate.
least eight attempts were made, at several times and days. If no contact could be made, the contact information was checked with care providers or with the contact persons reported by the participants at the baseline measurement. Then five further attempts were made. If the contact attempts were not successful, the contacting procedure was terminated. When contacted, participants who were unable or unwilling to visit the study site were offered an interview at their home, or subsequently, an interview by telephone. This strategy resulted in a mixed-mode design at follow-up, with respondents interviewed in a face-to-face setting at the study site, respondents interviewed in a face-to-face setting at home and respondents interviewed by telephone. Outside these three groups, a remaining proportion of those contacted still refused to participate, as described in the next section.
2.3. Measurements
2.3.1. Attrition
The main outcome variable is the indicator that a follow-up measurement took place. Since the attained response was achieved by combining different modes, we will refer to this indicator as ‘response in the mixed-mode design’ and its complement as ‘attrition in the mixed-mode design’. In case of attrition in the mixed-mode design, the given reason for attrition was coded as ‘non-contact’, ‘unable to participate’, ‘refusal’ or ‘deceased’.
Next to ‘response in the mixed-mode design’ we studied ‘response in the single mode design’ which we call the ‘on-site response’ and which would have been the response in the hypothetical situation that no interviews were held at respondents’ homes, and no telephone interviews were held, and only the on-site respondents responded. For reasons of clarity, we used the response behaviour at the follow-up wave to partition the total group of baseline responders into four groups: the ‘on-site response’, the ‘at home response’, the ‘telephone response’ and the ‘non-response in the mixed-mode design’. The last three groups correspond to the ‘non-response in the single mode design’, while the first group corresponds to the ‘response in the single mode design’ and the first three groups correspond to the ‘response in the mixed-mode design’.
2.3.2. Mode effects
As described above, in the follow-up measurement of the NESDA study, for some respondents the interview mode changed from a face interview at the study site to a face-to-face interview at the respondents’ home or to a telephone interview (at the respondents’ home). Introducing different survey modes in a survey design introduces different measurement errors if respondents provide different answers to the same questions depending on the mode being used to answer the question (Dillman et al., 2009). The amount of mode effect differs between questions due to differences in required cognitive efforts, or to differences in their susceptibleness to social desirability. Mode effects have been found in several studies comparing different interview modes. For example, differences in response behaviour have been assessed between telephone interviews and web-based self-interview, on questions related to experiences with environmental hindrance (Lugtig, Lensvelt-Mulders, Frerichs, & Greven, 2011), between telephone interviews and face to face interviews with respect to income related questions (Fessler, Kasy, & Lindner, 2012) and between face to face interview, mail (postal) mode and web mode, with respect to questions in a public health survey (Tipping, Hope, Pickering, Erens, Roth, & Mindell, 2010; Lorenc, 2010).
In this study, we examined if mode effects occurred with respect to two carefully selected variables: the number of depression symptoms measured by the Composite Interview Diagnostic Instrument (CIDI) – lifetime version 2.1 – to diagnose depressive and anxiety disorders according to Diagnostic and Statistical Manual of Mental Disorders – Fourth Edition (DSM-IV) algorithms and the score on self-rated health. Reasons to select these specific variables to investigate mode effects included the fact that these variables came from the interview - not from the self-administered paper questionnaire that accompanied the interview - the relatively high measurement level compared to other (mostly dichotomous) variables in the interview, their susceptibility to social desirability, and the key role these variables play in the NESDA study.
groups ‘onsite’, ‘at home’ and ‘telephone’. In fact, as a result of respondents’ preferences, we expected the three response groups to differ with respect to many variables. For example, we expected that the respondents who were interviewed in their homes would suffer more from psychiatric distress, but we also expected that they would prefer an at home interview because, at the baseline interview, they were older, and already suffering from psychiatric distress. Therefore we had to find out if the differences in the key variables were a result of different modes or a result of selection: the fact that the respondents differ between response groups.
In disentangling mode effects from selection effects, the choice of background variables is crucial, since these background variables determine the aspects in which the matched samples will be similar. We used background variables that were strongly related to the interview mode and strongly related to the two key variables. For the set of variables that related strongly to the interview mode, we used the set that Lamers et al. (2012) used to study determinants of attrition. For the set of variables that related strongly to the two key outcome variables, we used their equivalents measured at the baseline interview, since for these variables the scores on baseline and follow-up were highly correlated. The idea is that after controlling for both sets of variables, the observed differences in the key variables can be ascribed to mode effects.
2.3.3. Socio-demographic characteristics
Socio-demographic variables include age, gender, number of years of education, non-Northern European ancestry (yes/no), sampling site (Amsterdam, Groningen, Leiden), urbanization (high/low), distance to interview site (km), employment status (yes/no), partner status (yes/no) and number of chronic diseases. Urbanization was defined as high if the number of addresses was larger than 1500 per square kilometer. Because individuals who have previously participated in longitudinal research may be more motivated and therefore less likely to drop out of the NESDA study, previous participation in research (yes/no) was considered as a determinant of attrition. Distance to the interview site was determined by converting digit postal codes of respondents and interview sites to geographical positions (latitude and longitude) and by computing
the geographical distance between these positions. The distance to the interview site was not incorporated in the Lamers et al. (2012) study, but was added to the analysis here, since this variable can be expected to play an important role in comparing attrition in the case where respondents have to visit the on-site location for their interview, with the case where interviews are carried out at the respondents’ home or by telephone. The number of chronic diseases is not usually taken as a socio-demographic variable, but it was added as an indicator of general health status, being a count of self-reported presence of chronic diseases for which the respondent received treatment.
2.3.4. Psychiatric characteristics
Psychiatric characteristics included the 1-year diagnosis of depressive disorders (major depressive disorder (MDD) and dysthymia), anxiety disorders (social phobia, panic disorder with agoraphobia, panic disorder without agoraphobia, agoraphobia, general anxiety disorder (GAD)), and alcohol use disorders: alcohol dependence and alcohol abuse. All characteristics were obtained from the Composite International Diagnostic Interview (CIDI, lifetime version 2.1, (World Health Organization, 1997) to diagnose disorders according to the criteria of Diagnostics and Statistical Manual of Mental Disorders, Fourth Edition (DSM-IV). The number of DSM-IV depression symptoms (lifetime) was assessed using the depression section of the CIDI. Based on the items of the CIDI, the number of MDD symptoms ranged from 0 to 9 as stated by DSM-IV. Self-rated health was assessed by asking respondents to rate their own health on a scale from 0 to 100 after they rated the health of a person with a broken leg, a person with severe arthritis, a person with terminal cancer. Participants rated their own physical and mental health on the same scale, similar to the items in the ’30-day function’ section of the Collaborative Psychiatric Epidemiology Surveys (Alegria, Jackson, Kessler, & Takeuchi, 2008).
2.4. Statistical analyses
mode and the mixed-mode – three logistic regression models will provide analyses of determinants of attrition, where all other potentially confounding variables are taken into account: one model using socio-demographic variables only, one using psychiatric variables only and a comprehensive model that combines these sets of variables. These logistic regression models allowed us to determine the R-indicator (Schouten, Cobben, & Bethlehem, 2009), a measure for representativeness which assesses the similarity of the response and the sample of the survey with respect to a certain set of auxiliary variables. Instead of comparing the response with the sample, we will apply the R-indicator to compare the response at the follow-up wave to the response at the baseline wave. The representativeness of the response at the follow-up wave provides us with a measure of the selectivity of the attrition. The R -indicator with respect to the auxiliary variable vector X is defined as R(X) = 1 – 2S(X), where X is
the propensity to respond given background X and where S(X) is the standard deviation of these
propensities. Ideally, X contains all relevant characteristics. In practice, one has to make a reasonable choice of available background variables and, since the response propensities X are
unknown, one has to estimate the response propensities using a logit or probit model. The indicator takes values between 0, representing maximal selectivity, and 1, representing no selectivity at all, and can be translated into upper bounds for the non-response bias of the response mean. In the context of attrition, the R-indicator measures the similarity of the response at the follow-up wave and the response at baseline.
To study mode effects we considered that these were confounded by self-selection (de Leeuw, 2005). Propensity score methods have been used in several studies to investigate mode effects in mixed mode (Tipping et al., 2010; Lorenc, 2010; Lugtig et al., 2011; Fessler et al., 2012). Similar to (Lugtig et al., 2011) we used a method called ‘coarsened exact matching’ (CEM) (Iacus, King, & Porro, 2012) to eliminate differences in sample composition using a set of covariates. CEM is a form of propensity score matching that allows the researcher to “coarsen” data by groups for which the matches are made. The degree of coarseness is determined by the researcher. For example: for education, based on
the number of years of education, we created three meaningful groups: a group with zero to seven years of education, corresponding to primary school level, a group with more than seven but less or equal to twelve years of education, corresponding to secondary school level, and a group with more than twelve years of education, corresponding to tertiary school level. Also, the matching is not one to one, but respondents are matched if they fall within the same stratum of “coarsening”. After matching, the groups of respondents are similar with respect to all the covariates used in the matching procedure, so that the remaining differences can be attributed to mode effects, not to selection effects. Since there are two different response groups that use face-to-face interviewing – the onsite group and the at home group – we performed two matches. We statistically matched the onsite group to the telephone group, and the at home group to the telephone group, and compared these two pairs of groups to evaluate if there were mode effects. To compensate for the differential strata sizes, weights were computed and used in subsequent analyses.
3. Results
3.1. The amount of attrition
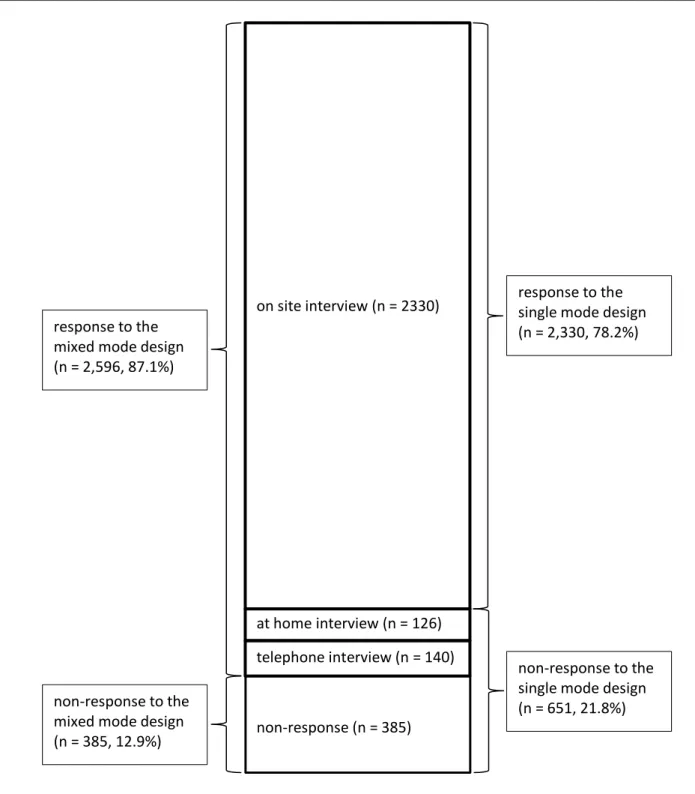
Figure 1. Response and non-response to the follow-up interview of the base line sample of 2,981
respondents in NESDA, according to the (realized) mixed mode design and to the (hypothetical)
single mode design
Notes. Mixed mode design = on site interview, at home interview and telephone interview. Single mode design = on site interview only.
telephone interview (n = 140) on site interview (n = 2330)
at home interview (n = 126)
non-response (n = 385) response to the
mixed mode design (n = 2,596, 87.1%)
non-response to the mixed mode design (n = 385, 12.9%)
response to the single mode design (n = 2,330, 78.2%)
Table 1. Baseline socio-demographic and psychopathological characteristics (means and
percentages) of response on non-response groups for single and mixed-mode design
Single mode Mixed-mode
response
non-response
p-value response
non-response p-value
n=2330 n=651 n=2596 n=385
Socio-demographic variables
Age – in years (SD) 42.2 (13.2) 40.7 (12.5) .009 42.0 (13.1) 41.0 (12.9) .144
Female vs Male 65.2 70.5 .012 66.1 68.3 .392
Education – in years (SD) 12.3 (3.2) 11.5 (3.3) .000 12.3 (3.3) 11.2 (3.1) .000 Non-Northern European descent
vs Northern European descent 4.2 9.1 .000 4.5 10.1 .000 Sampling Site
Amsterdam 36.7 56.8 .000 39.6 50.6 .000
Leiden 32.0 23.2 .000 30.2 28.8 .574
Groningen 31.4 20.0 .000 30.1 20.5 .000
High vs low urbanization 70.8 68.0 .179 69.6 73.8 .099 Distance in km to interview site (SD) 17.7 (37.6) 26.1 (45.0) .000 20.4 (40.5) 13.9 (31.2) .000 Previous participation in research 17.8 23.0 .002 20.1 10.6 .000 Not employed vs employed 35.4 37.5 .330 34.9 42.6 .003 No partner vs partner 30.9 29.8 .576 30.7 30.6 .984 Number of chronic diseases 0.9 1.0 .031 0.9 1.0 .058
Psychopathology
Depressive disorders
MDD 39.1 49.3 .000 38.8 58.4 .000
Dysthymia 9.5 15.8 .000 9.9 17.9 .000
Anxiety disorders
Social phobia 22.1 28.0 .002 22.2 31.2 .000
Panic disorder with agoraphobia 13.4 19.0 .000 13.6 21.6 .000 Panic disorder without agoraphobia 8.6 11.2 .040 8.7 12.2 .026
Agoraphobia 6.5 6.3 .836 6.2 8.1 .178
General anxiety disorder 15.2 21.7 .000 15.3 25.2 .000 Alcohol use disorders
Alcohol dependence 15.2 16.3 .479 14.9 18.4 .076
Alcohol abuse 11.7 12.3 .690 11.6 13.2 .361
Note. p-values are obtained from independent samples t-tests.
3.2. Attrition selectivity
Table 1 shows mean baseline characteristics for the response and non-response groups, both for the single and the mixed-mode design. For the
mixed-mode design the comparison was published previously by our group (Lamers et al., 2012). We concluded that respondents who dropped out were less well educated, more often of non-Northern European descent, were more often (by comparison with Leiden) recruited in Amsterdam and less often in Groningen, lived in very urbanized areas, had not
previously participated in a psychiatric study, were less often employed, and more often suffered, at baseline, from MDD, dysthmia, social phobia, panic disorders and general anxiety disorders. For the
significant at the p = 0.05 level. In other words: for these variables the amount of selectivity was reduced. On the other hand, for urbanization, employment status and for most of the psychopathological variables, moving from single to mixed-mode design made the selectivity worse.
We estimated multiple logistic regression models to explain the attrition in both designs (the single mode design and the mixed-mode design) from socio-demographic and psychopathology characteristics. Table 2 shows that in the mixed-mode design, younger age, fewer years of education, not being of Northern European descent, and having been recruited in Amsterdam were determinants of attrition. Of the psychiatric diagnoses, MDD and dysthymia were determinants of attrition. For the single mode design, Table 2 indicates roughly the same determinants, but with generally stronger effects (odds ratios that are generally more distant from 1). A remarkable exception is the selectivity with respect to the depressive disorder MDD: the odds ratio increased from 1.27 to 1.60. We will discuss the selectivity with respect to this variable in more detail later in this section. Note that the odds ratio from ‘distance to site’ drops from 1.58 in the single mode design to 0.73 in the mixed-mode design, indicating that adding the additional modes reduced distance from the study site as a risk factor for attrition.
Table 2 also shows values of R-indicators (representativity indicators) based on the logistic regression models. Note that the value of the R -indicator of the comprehensive model of the mixed-mode design (0.84) was higher than the corresponding value for the single mode design
(0.75). The increase in R-indicator indicates that the selectivity – with respect to the socio-demographic and psychopathological variables in the model – was reduced. If we focus on the models using socio-demographic and psychopathology characteristics separately, we see that there was a gain in representativity in socio-demographic variables (from 0.77 to 0.87), but not in psychopathology (from 0.90 to 0.89), so that we may conclude that the reduction in selectivity is mainly obtained by the demographic variables.
Table 2. Odds ratios of attrition after 2 years according to baseline socio-demographic and
psychopathology variables
Single Mode Mixed-mode
model 1
model 2
model 3
model 1
model 2
model 3 Socio-demographic variables
Age (per y increase) 0.98*** 0.99*** 0.98*** 0.99**
Female (versus male) 1.21+ 1.23* 1.04 1.08
Education (per y increase) 0.90*** 0.91*** 0.90*** 0.91*** Non-Northern European descent
vs Northern European descent 1.91*** 1.85*** 1.82** 1.71** Sampling Site
Amsterdam
Leiden 0.40*** 0.39*** 0.62*** 0.61***
Groningen 0.29*** 0.28*** 0.53*** 0.53***
High vs low urbanization 0.80* 0.84 0.93 1.00
Previous participation in Research 1.46** 1.45** 0.75 0.72 Distance to site (per 100 km) 1.25 1.58** 0.53** 0.73
Not employed vs employed 1.00 0.93 1.25+ 1.14
No partner vs partner 0.88 0.83+ 0.9 0.83
No. of chronic diseases 1.11* 1.08 1.08 1.04
Psychopathology
Depressive disorders
MDD 1.25* 1.27* 1.78*** 1.60***
Dysthymia 1.42* 1.56** 1.29 1.31+
Anxiety disorders
Social phobia 1.09 1.07 1.11 1.08
Panic disorder with agoraphobia 1.32* 1.27+ 1.43* 1.23 Panic disorder without agoraphobia 1.27 1.26 1.31 1.22
Agoraphobia 0.96 0.88 1.31 1.16
General anxiety disorder 1.21 1.18 1.25 1.14
Alcohol use disorders
Alcohol dependence 0.96 1.08 1.09 1.14
Alcohol abuse 1.06 1.11 1.23 1.19
n 2981 2981 2981 2981 2981 2981
Pseudo R2 0.07 0.01 0.08 0.05 0.03 0.06
R-indicator 0.77 0.90 0.75 0.87 0.89 0.84
Table 3. Baseline socio-demographic and psychopathological characteristics (means and
percentages) of response on non-response groups for single and mixed-mode design
on-site at home telephone p-value
n=2330 n=126 n=140
Socio-demographic variables
Age – in years (SD) 42.2 (13.2) 43.7 (11.5) 37.2 (11.3) .000
Female vs Male 65.2 73.8 73.6 .022
Education – in years (SD) 12.3 (3.2) 11.7 (3.3) 11.8 (3.6) .024 Non-Northern European descent
vs Northern European descent 4.2 4.0 10.7 .001
Sampling Site
Amsterdam 36.7 69.8 62.1 .000
Leiden 32.0 13.5 16.4 .000
Groningen 31.4 16.7 21.4 .000
High vs low urbanization 70.8 40.5 77.1 .000
Distance in km to interview site (SD) 16.2 (31.8) 66.5 (53.7) 19.5 (36.9) .000
Previous participation in research 17.8 69.0 15.7 .000
Not employed vs employed 35.4 34.9 25.7 .065
No partner vs partner 30.9 21.4 35.0 .041
Number of chronic diseases 0.9 1.0 0.9 .470
Psychopathology
Depressive disorders
MDD 39.1 30.2 41.4 .109
Dysthymia 9.5 10.3 15.0 .106
Anxiety disorders
Social phobia 22.1 23.0 23.6 .899
Panic disorder with agoraphobia 13.4 14.3 16.4 .591
Panic disorder without agoraphobia 8.6 10.3 9.3 .773
Agoraphobia 6.5 4.8 2.9 .171
General anxiety disorder 15.2 12.7 20.0 .214
Alcohol use disorders
Alcohol dependence 15.2 8.7 17.1 .109
Alcohol abuse 11.7 8.7 12.9 .535
Note. The p-values were obtained from ONEWAY ANOVAs.
We mentioned earlier that the change from single mode to mixed-mode increased the selectivity with respect to depressive disorder MDD, both in a bivariate sense (see Table 1) and in a multivariate sense (see Table 2). The percentage of MDD sufferers measured at baseline differed for the four response groups. We found that 58% of the non-responders (in the mixed-mode design) had MDD at baseline, while the equivalent percentages for the responding groups were 39%, 30% and 41% for the on-site, at home and telephone group respectively, with a combined mean of 39%. The
3.3. Survey mode
To find out if mode effects occurred, we studied differences between response groups (on-site interviewing, at home interviewing and telephone interviewing) with respect to two key variables: the number of DSM-IV depression symptoms, and self-rated health. As a result of selection – the fact that specific respondents preferred a certain mode – we expected that mean scores of these variables would differ for different groups. If there were no mode effects, we would expect that controlling for selection by using statistical matching would make these differences disappear. If on the other hand, controlling for selection did not (entirely) resolve these differences, we would conclude that mode effects existed.
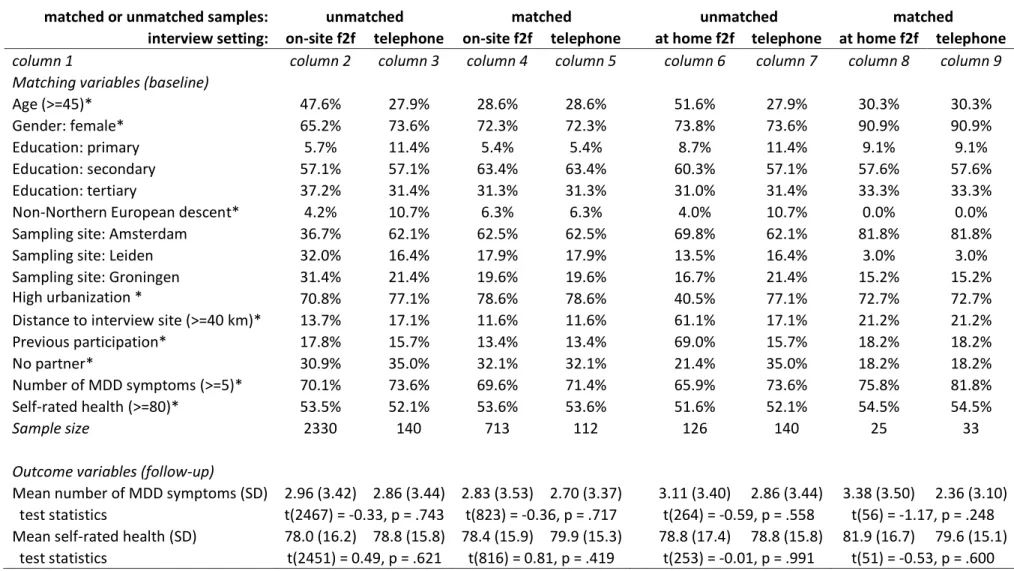
Table 4 shows mean scores of the two variables for the three response groups (see the results in the bottom part of Table 4 in the columns for the unmatched samples, i.e. columns 2, 3 and 6; notice that columns 3 and 7 are identical). Since we expected selection effects, it was unexpected that the differences of the mean scores between the response groups hardly differed at all, both for the number of MDD symptoms and for self-rated health. As a result, the differences in means scores in the unmatched samples were statistically insignificant, as demonstrated by the test statistics at the bottom part of Table 4, for the comparison between unmatched samples for on-site face-to-face interviews and telephone interviews (columns 2 and 3), and for the comparison between unmatched samples for at home face-to-face interviews and telephone interviews (columns 6 and 7).
To separate selection effects from mode effects, we applied the method of Coarsened Exact Matching (CEM). As matching variables, we selected all variables that were significantly related to the response groups (see Table 3): age, gender, education, Northern European descent, sampling
Table 4. Propensity score matching results, showing percentages of coarsened matching variables for unmatched and matched differences
between face-to-face and telephone interviewing and showing unmatched and matched mean scores of the outcome variables ‘number of
MDD symptoms’ and ‘self-rated health’ at follow-up wave and corresponding test statistics
matched or unmatched samples: unmatched matched unmatched matched
interview setting: on-site f2f telephone on-site f2f telephone at home f2f telephone at home f2f telephone
column 1 column 2 column 3 column 4 column 5 column 6 column 7 column 8 column 9
Matching variables (baseline)
Age (>=45)* 47.6% 27.9% 28.6% 28.6% 51.6% 27.9% 30.3% 30.3%
Gender: female* 65.2% 73.6% 72.3% 72.3% 73.8% 73.6% 90.9% 90.9%
Education: primary 5.7% 11.4% 5.4% 5.4% 8.7% 11.4% 9.1% 9.1%
Education: secondary 57.1% 57.1% 63.4% 63.4% 60.3% 57.1% 57.6% 57.6%
Education: tertiary 37.2% 31.4% 31.3% 31.3% 31.0% 31.4% 33.3% 33.3%
Non-Northern European descent* 4.2% 10.7% 6.3% 6.3% 4.0% 10.7% 0.0% 0.0%
Sampling site: Amsterdam 36.7% 62.1% 62.5% 62.5% 69.8% 62.1% 81.8% 81.8%
Sampling site: Leiden 32.0% 16.4% 17.9% 17.9% 13.5% 16.4% 3.0% 3.0%
Sampling site: Groningen 31.4% 21.4% 19.6% 19.6% 16.7% 21.4% 15.2% 15.2%
High urbanization * 70.8% 77.1% 78.6% 78.6% 40.5% 77.1% 72.7% 72.7%
Distance to interview site (>=40 km)* 13.7% 17.1% 11.6% 11.6% 61.1% 17.1% 21.2% 21.2%
Previous participation* 17.8% 15.7% 13.4% 13.4% 69.0% 15.7% 18.2% 18.2%
No partner* 30.9% 35.0% 32.1% 32.1% 21.4% 35.0% 18.2% 18.2%
Number of MDD symptoms (>=5)* 70.1% 73.6% 69.6% 71.4% 65.9% 73.6% 75.8% 81.8% Self-rated health (>=80)* 53.5% 52.1% 53.6% 53.6% 51.6% 52.1% 54.5% 54.5%
Sample size 2330 140 713 112 126 140 25 33
Outcome variables (follow-up)
4. Discussion
This study evaluated the introduction of a mixed-mode survey design in the NESDA follow-up study in order to reduce the problem of attrition. Introducing a mixed-mode design adds channels to reach respondents, and can consequently only lower the attrition rate if we compare this new situation to a single mode design. We found that if no at home interviews and no telephone interviews had been held, the attrition rate would have been 22%, instead of 13% which we obtained in the mixed-mode design. From this observation, we concluded that the mixed-mode design reduced the attrition level by 9%. Studying the selectivity of attrition, we found that the introduction of the mixed-mode design decreased selectivity with respect to combined socio-demographic and psychiatric variables as measured by the R -indicator. However, the decrease in selectivity is not the same for all (sets of) variables. There appears to be a drastic decrease in selectivity with respect to socio-demographic variables, while a (small) increase in selectivity appears for psychiatric variables. This suggests that the introduction of the mixed-mode survey made the sample more representative with respect to demographic variables, and at the same time, slightly less representative with respect to psychiatric variables. Another aspect that we considered was the fact that the introduction of mixed-mode design may also introduce problems related to mode effects. However, in our sample we fortunately did not find any evidence for mode effects. This finding is in line with those of Sobin et al. (1993), who found no differences between face-to-face methods for the diagnosis of lifetime psychiatric disorders. Our results are also in line with those of Voogt & Saris (2005), who introduced a mixed-mode design together with the use of a so-called central question, in a cross-sectional election survey. They concluded that the mixed-mode survey design led to larger response rates and less non-response bias. The positive effects appeared to be larger than the negative effects from the increase in response bias (or measurement error).
Our study dealt with the direct consequences of the introduction of a mixed-mode design only, and so far, we have not taken long term consequences into account. The reduction in attrition from 22% to
13% may not be considered large, but if the same attrition were maintained over the total of four waves, then the attrition would accumulate to 1 – (1 – 0.22)4 = 63% for the single mode design, while it would be 1 – (1 – 0.13)4 = 43% for the mixed-mode design. Keeping attrition low is important for longitudinal surveys, as sample members, once lost, are irreplaceable. Lynn (2011) discusses an experiment where mixed-mode survey design was introduced to reduce cost, and found that the lower attrition rate implied by the mixed-mode survey persisted in a subsequent wave. It is not yet clear what the long-term consequences of the introduction of the mixed-mode design would be for the level and selectivity of the attrition. This may be a topic for future research.
In our study the survey modes that were added to the single mode design were “interviews at the respondents’ home” and “telephone interviews”. The addition of other survey modes to reduce attrition should be studied: web-based methods for self-interviewing, interviews by on-line video and audio conversation methodology such as Skype or FaceTime (Loftis, Zelko, Jewett, & Meyer, 2012) or web-based methods using avatar interviewers (Bell, Castronova, & Wagner, 2009; Malakhoff & Jans, 2011).
Acknowledgements
The infrastructure for the NESDA study (www.nesda.nl) is funded through the Geestkracht program of the Netherlands Organisation for Health Research and Development (Zon-Mw, grant number 10-000-1002) and is supported by participating universities and mental health care organizations (VU University Medical Center, GGZ inGeest, Arkin, Leiden University Medical Center, GGZ Rivierduinen, University Medical Center Groningen, Lentis, GGZ Friesland, GGZ Drenthe, Scientific Institute for Quality of Healthcare (IQ healthcare), Netherlands Institute for Health Services Research (NIVEL) and Netherlands Institute of Mental Health and Addiction (Trimbos Institute).
References
Alegria, M., Jackson, J. S., Kessler, R. C., & Takeuchi, D. (2008). Collaborative Psychiatric Epidemiology Surveys (CPES), 2001-2003. (Rep. No. ICPSR20240-v6). Ann Arbor, MI: Inter-university Consortium for
Political and Social Research.
Bell, M. W., Castronova, E., & Wagner, G. G. (2009). An expansion of survey data collection methods to the virtual worlds by means of VDCI. (Rep. No. Research Notes of the German Council for Social and Economic Data 39). German Council for Social and Economic Data (RatSWD).
Bijl, R. V., Ravelli, A., & van Zessen, G. (1998). Prevalence of psychiatric disorder in the general population: results of The Netherlands Mental Health Survey and Incidence Study (NEMESIS). Social Psychiatry and Psychiatric Epidemiology, 33, 587-595.
Bowling, A. (2005). Mode of Questionnaire Administration Can Have Serious Effects on Data Quality. Journal of Public Health, 27, 281-291.
Couper, M. P. & Ofstedal, M. B. (2009). Keeping in Contact with Mobile Sample Members. In P.Lynn (Ed.),
Methodology of Longitudinal Surveys (pp. 183-203). Chichester: John Wiley & Sons, Inc.
de Graaf R., Bijl, R. V., Smit, F., Ravelli, A., & Vollebergh, W. A. (2000). Psychiatric and sociodemographic predictors of attrition in a longitudinal study: The Netherlands Mental Health Survey and Incidence Study (NEMESIS). American Journal of Epidemiology, 152, 1039-1047.
de Leeuw, E. D. (1992). Data Quality in Mail, Telephone, and Face-to-face Surveys. Amsterdam: TT-Publicaties.
de Leeuw, E. D. (2005). To Mix or Not to Mix Data Collection Modes in Surveys. Journal of Official Statistics, 21, 233-255.
Dillman, D. A., Smyth, J. D., & Christian, L. M. (2009). Internet, mail, and mixed-mode surveys: The tailored design method, Third Edition. Hoboken, NJ: John Wiley & Sons Inc.
Farmer, M. E., Locke, B. Z., Liu, I. Y., & Moscicki, E. K. (1994). Depressive symptoms and attrition: the NHANES I epidemiologic follow-up study. International Journal of Methods in Psychiatric Research, 4, 19-27. Fessler, P., Kasy, M., & Lindner, P. (2012). Survey mode effects on income inequality measurement.
http://scholar.harvard.edu/files/kasy/files/fesslerkasylindner-nov2012_0.pdf [On-line]. Available:
http://scholar.harvard.edu/files/kasy/files/fesslerkasylindner-nov2012_0.pdf
Fischer, E. H., Dornelas, E. A., & Goethe, J. W. (2001). Characteristics of people lost to attrition in psychiatric follow-up studies. Journal of Nervous and Mental Disease, 189, 49-55.
Goldstein, H. (2009). Handling attrition and non-response in longitudinal data. Longitudinal and Life Course Studies, 1, 63-72.
Groves, R. M. (1989). Survey Errors and Survey Costs. New York: Wiley-Interscience.
Groves, R. M. & Couper, M. P. (1998). Nonresponse in Household Interview Surveys. New York: Wiley. Holbrook, A. L., Green, M. C., & Krosnick, J. A. (2003). Telephone vs. Face-to-Face Interviewing of National
Probability Samples With Long Questionnaires: Comparisons of Respondent Satisficing and Social Desirability Response Bias. Public Opinion Quarterly, 67, 79-125.
Iacus, S. M., King, G., & Porro, G. (2012). Causal Inference without Balance Checking: Coarsened Exact Matching. Political Analysis, 20, 1-24.
Jackle, A., Roberts, C., & Lynn, P. (2006). Telephone versus Face-to-Face Interviewing: Mode Effects on Data Quality and Likely Causes (Rep. No. ISER Working Paper 2006-41). Colchester: Institute for Social and Economic Research, University of Essex.
Lamers, F., Hoogendoorn, A. W., Smit, J. H., van Dyck, R., Zitman, F. G., Nolen, W. A., & Penninx, B.W. (2012). Sociodemographic and psychiatric determinants of attrition in the Netherlands Study of Depression and Anxiety (NESDA). Comprehensive Psychiatry, 53, 63-70.
Lorenc, B. (2010). Item Nonresponse Analysis for a Mixed-Mode Survey. In M.Carlson, H. Nyquist, & M. Villani (Eds.), Official Statistics - Methodology and Applications in Honour of Daniel Thorburn (pp. 117-136). Stockholm: Department of Statistics, Stockholm University.
Lugtig, P., Lensvelt-Mulders, G. J. L. M., Frerichs, R., & Greven, A. (2011). Estimating nonresponse bias and mode effects in a mixed-mode survey. International Journal of Market Research, 53, 669-686. Lynn, P. (2011). The Effect of a Mixed-mode Wave on Subsequent Attrition in a Panel Survey: Evidence from
the Understanding Society Innovation Panel (Rep. No. Understanding Society Working Paper 2011-06). Colchester: ISER, University of Essex.
Malakhoff, L. & Jans, M. (2011). Towards usage of avatar interviewers in surveys. Survey Practice [On-line]. Available: http://surveypractice.wordpress.com/2011/06/20/usage-of-avatar/
Penninx, B. W., Beekman, A. T., Smit, J. H., Zitman, F. G., Nolen, W. A., Spinhoven, P., Cuijpers, P., De Jong, P.J., Van Marwijk, H.W.J., Assendelft, W.J.J., Van Der Meer, K., Verhaak, P., Wensing, M., De Graaf, R., Hoogendijk, W.J., Ormel, J., Van Dyck. R. (2008). The Netherlands Study of Depression and Anxiety (NESDA): rationale, objectives and methods. International Journal Methods Psychiatric Research, 17, 121-140.
Schouten, B., Cobben, F., & Bethlehem, J. G. (2009). Indicators for the representativeness of survey response. Survey Methodology, 35, 101-113.
Sobin, C., Weissman, M. M., Goldstein, R. B., Adams, P. B., Wickramaratne, P. J., Warner, V. Lish, J. (1993). Comparing telephone and face-to-face interview methods for the diagnosis of lifetime psychiatric disorders in a family study. Psychiatric Genetics, 3, 227-233.
Susser, E., Schwartz, S., Morabia, A., & Bromet, E. J. (2006). Psychiatric Epidemiology: Searching for the Causes of Mental Disorders. Oxford: Oxford University Press.
Tipping, S., Hope, S., Pickering, K., Erens, B., Roth, M. A., & Mindell, J. S. (2010). The effect of mode and context on survey results: analysis of data from the Health Survey for England 2006 and the Boost Survey for London. BMC Medical Research Methodology, 10:84, 1-8.
Van der Laan, P., & Van Nunspeet, W. (2009). Modernising household surveys in the Netherlands: Design, Efficiency Gains and Perspectives (Rep. No. Discussion paper 09044). Statistics Netherlands. Vannieuwenhuyze, J., Loosveldt, G., & Molenberghs, G. (2010). A Method For Evaluating Mode Effects In
Mixed-Mode Surveys. Public Opinion Quarterly, 74, 1027-1045.
Voogt, R. J. J., & Saris, W. E. (2005). Mixed-mode Designs: Finding the Balance Between Nonresponse Bias and Mode Effects. Journal of Official Statistics, 21, 367-387.
Watson, N., & Wooden, M. (2009). Identifying Factors Affecting Longitudinal Survey Response. In P.Lynn (Ed.), Methodology of Longitudinal Surveys (Pp 157-181). Chichester: John Wiley & Sons, Inc. Weuve, J., Tchetgen Tchetgen, E. J., Glymour, M. M., Beck, T. L., Aggarwal, N. T., Wilson, R. S., Evans, D.A., &
Mendes de Leon, C.F. (2012). Accounting for bias due to selective attrition: the example of smoking and cognitive decline. Epidemiology, 23, 119-128.