
Social gradients in child health and
development in relation to income inequality
Who benefits from greater income equality?
Philippa Kate Bird BA (Hons) MSc
PhD
University of York
Department of Health Sciences
November 2013
There is considerable evidence that health and development are better, on average, in countries with greater income equality. However, much of the research has focussed on average health and wellbeing; it is less clear how this benefit is distributed across society – do people from advantaged and disadvantaged socioeconomic backgrounds benefit equally? Further, there has been little research on the relationship between income inequality and child health.
This thesis aimed to explore how the social gradient in child health and development varies in relation to income inequality in high income countries.
I used two approaches to answer the question: Does everyone do better in more equal countries? I conducted a critical review of previous literature comparing social gradients in health and wellbeing. I also conducted original analysis using a comparative cohort study. I compared social gradients in health and development among children aged 4-6, using 7 cohort studies from 6 countries (US, UK, Australia, Canada, Netherlands, Sweden). I reviewed approaches to comparing data between studies and across countries, and harmonised the samples and variables to facilitate comparisons.
The studies in the critical review varied considerably, but there was substantial evidence that health and wellbeing are better for everyone in more equal countries (with the most disadvantaged benefitting the most). In the comparative cohort analysis, there was some evidence that social gradients are steeper in more equal countries (inequalities are greater), and some evidence that everyone does better. However, there were many inconsistencies and comparisons were challenging due to measurement differences between the cohorts.
The observation that social gradients are shallower in some countries than others shows that such inequalities can be prevented. There is growing evidence that people from all social backgrounds would benefit if countries had greater income equality.
Table of contents
Abstract...3 Contents ...5 Table of contents ...5 List of Tables ...11 List of Figures ...13 List of Boxes ...17 Acknowledgements...19 Author’s declaration ...21 Chapter 1: Introduction ...231.1. Background and justification ...23
Why study the social gradient in health in relation to income inequality?...23
Why study child health and development?...25
Why focus on high income countries? ...26
Summary of research problem...27
1.2. Aim and objectives...27
Aim ...27
Objectives...27
Specific research questions ...27
1.3. Structure of thesis...28
Part I: Background and literature review...28
PART II: Comparative cohort analysis ...28
PART III: Discussion and conclusion...29
1.4. Presentation of findings...30
PART I: BACKGROUND AND LITERATURE REVIEW...31
Chapter 2: Socioeconomic position, income inequality, and child health and development ...33
2.1. Introduction ...33
2.2. Social gradients in health and development ...34
A summary of the evidence...34
How does socioeconomic position influence health?...35
Do differences in health cause social selection? ...44
Summary of the links between SEP and child health and development ...45
2.3. The relationship between income inequality and health...45
A summary of the evidence...45
Why is there a relationship between income inequality and health?...50
Summary of the links between income inequality and child health...53
The relationship between the welfare state and health...54
How do welfare systems affect health?...56
2.5. Pulling it all together – overlapping layers of influence on child health and development..56
2.6. Social gradients in health in relation to income inequality? ...59
2.7. Summary of chapter 2 ...60
Chapter 3: Approaches to measuring and comparing socioeconomic inequalities in child health/development and income inequality... 61
3.1. Introduction...61
3.2. Child socioeconomic position...62
What is socioeconomic position?...62
How can we measure socioeconomic position for children and adolescents? ...62
Comparing child socioeconomic position across countries...65
Measuring and comparing child SEP: examples of indicators ...65
3.3. Socioeconomic Inequality...74
What is socioeconomic inequality?...74
How can we measure income inequality? ...75
Comparing income inequality...79
3.4. Health inequality and the social gradient in health...81
What are health inequality and the social gradient? ...81
How can we measure health inequality?...82
How can we measure the social gradient in health?...84
Comparing health inequalities and social gradients ...86
3.5. Child health and development ...87
What is child health and development? ...87
How can we measure child health and development?...87
Comparing child health and development across countries...88
3.6. Summary of chapter 3 ...91
Chapter 4: Critical review of studies that have compared the social gradient in health and wellbeing in more and less equal societies ... 93
4.1. Introduction...93
Objectives and research questions ...93
Models of the social gradient in relation to inequality...94
4.2. Methods...96
Literature search...96
Summarising and presenting findings ...98
4.3. Findings...100
Description of included studies...100
Physical wellbeing and health ...102
Socio-emotional wellbeing, mental health and behaviour...113
Areas for future research ...128
4.5. Summary of chapter 4...129
PART II: COMPARATIVE COHORT ANALYSIS... 131
Chapter 5: Comparative cohort analysis - Background and methods ... 133
5.1. Introduction ...133
Objective and research questions ...133
5.2. Background on the analysis of multiple cohort datasets...134
Background and terminology...134
The growth of coordinated analysis...136
Why conduct coordinated or pooled analysis? ...136
Harmonisation of multiple datasets ...136
How do cohort datasets differ and how can we take account of differences?...137
5.3. Comparative cohort study methods ...142
5.4. Sample...142
Study countries and cohorts...142
Within-country harmonised samples...146
5.5. Harmonised variables ...148
Socioeconomic position variables ...148
Physical health and development outcomes...154
Socio-emotional development and behaviour outcomes...157
Cognitive development outcomes...158
Other variables...159
5.6. Analysis ...159
i. Descriptive statistics...160
ii. Preliminary bivariate analysis ...160
iii. Multivariate analysis of the social gradient ...160
Analysis of social gradients...162
5.7. Summary of chapter 5...163
Chapter 6: Comparative cohort analysis - Descriptive statistics... 165
6.1. Introduction ...165
6.2. Sample selection and size ...165
6.3. The cohort children and their households...167
Age and sex ...167
Household composition...169
6.4. Socioeconomic Position ...169
Parental education...169
Household income...171
6.5. Child health and development outcomes...173
Height...173
Excellent health...177
Chronic illness ...178
Emotional problems and anxiety...178
Hyperactivity...181
Verbal cognition...183
6.6. Missing data...184
6.7. Summary of chapter 6 ...185
Chapter 7: Comparative cohort analysis - Social gradients in child health and development in relation to income inequality ... 187
7.1. Introduction...187
7.2. Physical health and development...189
Height ...189
Overweight and obesity...195
Excellent health...201
Chronic illness ...207
7.3. Behaviour and emotional development...213
Emotional problems and anxiety...213
Hyperactivity and inattention...220
7.4. Cognitive development...227
Verbal cognition...227
7.5. Overview of findings by group and cohort...232
Group A...232
Group B...232
Group C ...233
7.6. Summary of chapter 7 ...235
Chapter 8: Comparative cohort analysis - Discussion... 237
8.1. Introduction...237
8.2. Validity of comparisons ...237
Cohort samples ...238
Harmonised variables ...242
Further analytical considerations ...251
8.3. Explanations of differences ...252
Income inequality in the study countries...252
National income...254
Poverty...256
Welfare policies ...257
8.4. Summary of limitations ...260
8.5. Summary of chapter 8 ...262
PART III: DISCUSSION AND CONCLUSIONS ... 265 Chapter 9: Discussion of the evidence on social gradients in child health and development in
9.2. How do social gradients in child health and development vary between more and less equal
societies?...268
Summary of thesis findings ...268
Why is this important?...270
9.3. Understanding the relationships between income inequality, socioeconomic position, and health ...271
There are layers of influence on child health and development ...271
Children across society are vulnerable...272
The lived experience of growing up in an unequal country ...272
Causality and the interpretation of the evidence on income inequality and health...274
9.4. The policy implications of the relationship between income inequality, socioeconomic position, and health...278
a) Reduce income inequality and social differentiation...279
b) Reduce the link between income inequality/socioeconomic position and child health/development...281
9.5. Focus on the UK – child health and development, socioeconomic position and income inequality ...282
Income inequality in the UK ...282
Child health and development ...284
9.6. Evidence and methods for researching social gradients in child health and development in relation to income inequality...284
Harmonising cohort studies to compare social gradients in health– my approach...285
The research implications: strengthening the evidence base ...286
Chapter 10: Conclusions ... 289
Appendices ... 293
Appendix 2: Further information for chapter 2... 295
A.2.1 Ecological analysis of child health and development and income inequality ...295
Introduction...295
Methods ...296
Literature review...298
Hypotheses...300
Findings from the ecological analysis ...301
Discussion and Conclusions...307
Appendix 3: Further information for Chapter 3 ... 309
A.3.1 The measurement of infant mortality and implications for international comparisons...309
Introduction...309
Differences in recording of births and infant deaths ...310
Differences in registration coverage ...313
Implications for international comparisons of infant mortality rates ...314
Summary ...317
A.4.1 Studies which compared the social gradient in health using absolute measures ...320
Appendix 5: Further information for Chapter 5 ... 327
A.5.1 Background information on the cohort datasets...327
The ECLS-K...327 The MCS...328 The LSAC-K ...328 The NLSCY ...329 The QLSCD...330 Gen-R ...330 ABIS...331
A.5.2 Household income question wording and banding in the study cohorts ...332
A.5.3 Interval regression – background information...334
A.5.4 Parental education recoding strategy...342
Appendix 6: Further information for Chapter 6 ... 345
A.6.1 Descriptive statistics – additional tables of unweighted and weighted statistics ...346
A.6.2 Missing Data Analysis...354
Appendix 7: Further information for Chapter 7 ... 357
A.7.1 Unadjusted socioeconomic gradients – additional tables of weighted and unweighted figures...358
Abbreviations... 373
Table 1-1: Summary of objectives addressed in thesis chapters ...30
Table 2-1: Neuroendocrine pathways and chronic stress ...39
Table 3-1: Frequently used measures of Socioeconomic Position...63
Table 3-2: Measures of income inequality...76
Table 3-3: Measures of health inequality...83
Table 3-4: Measures of child health and development...88
Table 4-1: Summary of included studies and outcomes measured ...101
Table 4-2: Summary of the models supported by the different outcome measures in reviewed studies...124
Table 5-1: Coordinated/meta-analysis and pooled analysis features...134
Table 5-2: Study countries, groups and dataset...143
Table 5-3: Features of included cohort studies...144
Table 5-4: Parental education categorisation ...153
Table 5-5: General health status question wording in the cohorts...155
Table 5-6: Chronic illness question wording in the cohorts ...156
Table 5-7: Emotional problem and anxiety scale components in the cohorts...157
Table 5-8: Hyperactivity and inattention scale components in the cohorts ...158
Table 6-1: Exclusion process and sample sizes...166
Table 6-2: Age and sex of children, by group and cohort ...167
Table 6-3: Children’s household composition, by group and cohort ...169
Table 6-4: Summary of parental education levels, by group and cohort...170
Table 6-5: Summary of children’s household income, by group and cohort ...172
Table 6-6: Summary of children’s height, by group and cohort...174
Table 6-7: Summary of overweight/obesity, by group and cohort ...176
Table 6-8: Summary of excellent health, by group and cohort...177
Table 6-9: Summary of chronic illness, by group and cohort...178
Table 6-10: Raw and standardised emotional problem/ anxiety scores, by group and cohort ...179
Table 6-11: Raw and standardised hyperactivity and inattention scores, by group and cohort ...181
Table 6-12: Raw and standardised verbal cognition scores, by group and cohort ...183
Table 7-1: Linear regression models for child height and parental education categories ...191
Table 7-2: Linear regression models for child height and continuous equivalised household income, age and sex...194
Table 7-3: Logistic regression models for overweight and obesity with parental education categories, age and sex...197
Table 7-4: Logistic regression models for overweight and obesity with continuous equivalised household income, age and sex ...199
Table 7-5: Logistic regression models for excellent health and parental education categories, age and sex202 Table 7-6: Logistic regression models for excellent health and continuous equivalised household income, age and sex...205
Table 7-7: Logistic regression models for chronic illness and parental education categories, age and sex ..209 Table 7-8: Logistic regression models for chronic illness and continuous equivalised household income, age
and sex...211 Table 7-9: Linear regression models for emotional problems score and parental education categories, age
and sex...215 Table 7-10: Linear regression models for emotional problems and continuous equivalised household
income, age and sex ...218 Table 7-11: Linear regression models for hyperactivity score and parental education categories, age and sex
...222 Table 7-12: Linear regression models for hyperactivity and continuous equivalised household income, age
and sex...225 Table 7-13: Linear regression models for verbal cognition score and parental education categories, age and
sex...228 Table 7-14: Linear regression models for verbal cognition and continuous equivalised household income,
age and sex ...231 Table 8-1: Comparison my estimates and OECD estimates of equivalised incomes for households with
children (PPP$, 2005) ...244 Table 8-2: Comparison of cohort overweight/obesity prevalence with HBSC data...247 Table 8-3: Economic and policy context in the study countries...255
Figure 1-1: Rising income inequality in the UK, 1979-2011 ...25
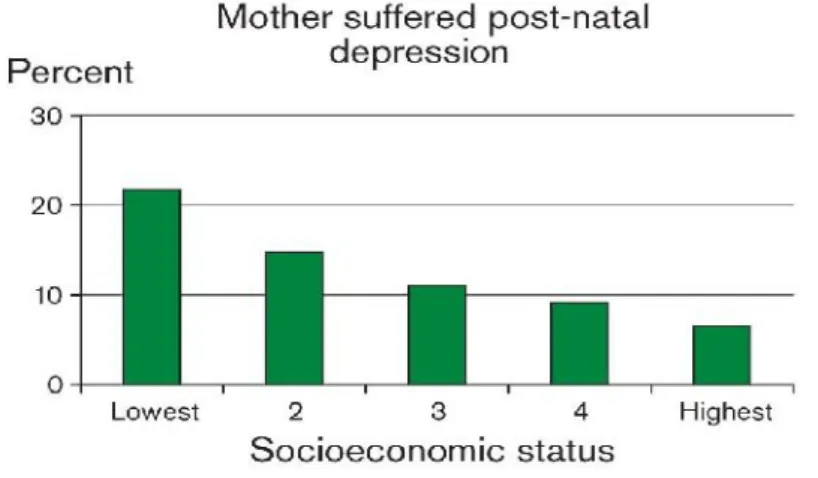
Figure 2-1: The gradient in children having a mother with postnatal depression, by socioeconomic status..41
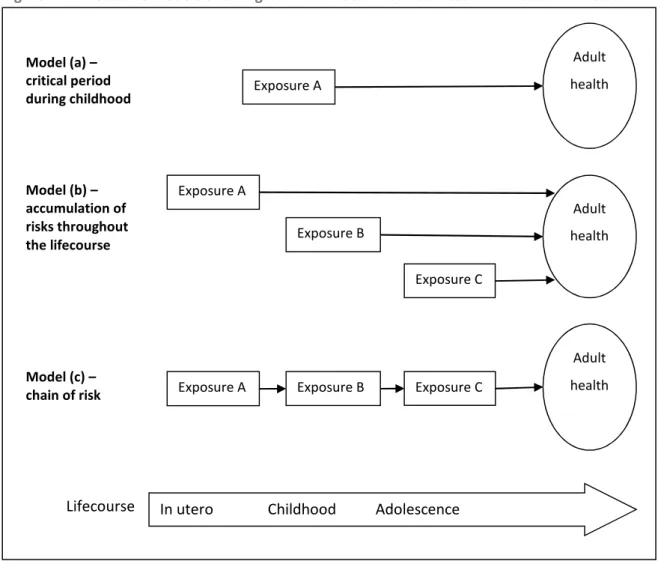
Figure 2-2: Lifecourse models showing how childhood circumstances can affect adult health ...44
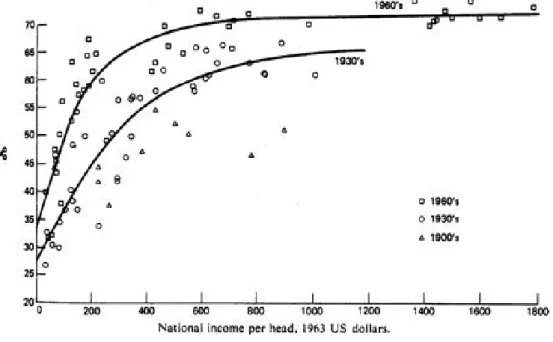
Figure 2-3: The relationship between life expectancy at birth and national income per head for nations in the 1900s, 1930s and 1960s ...46
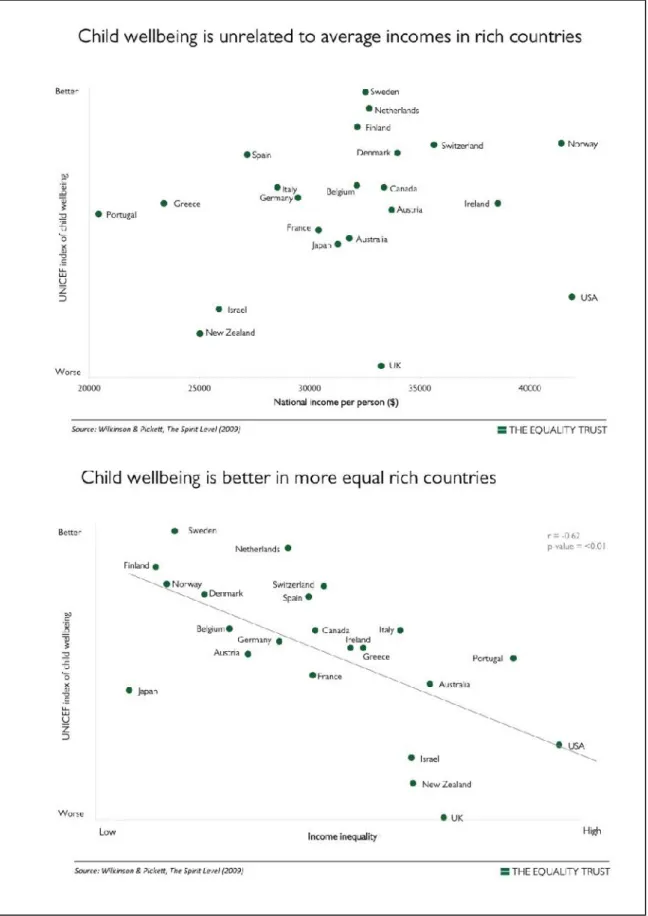
Figure 2-4: Child wellbeing in relation to national income and income inequality in rich countries...48
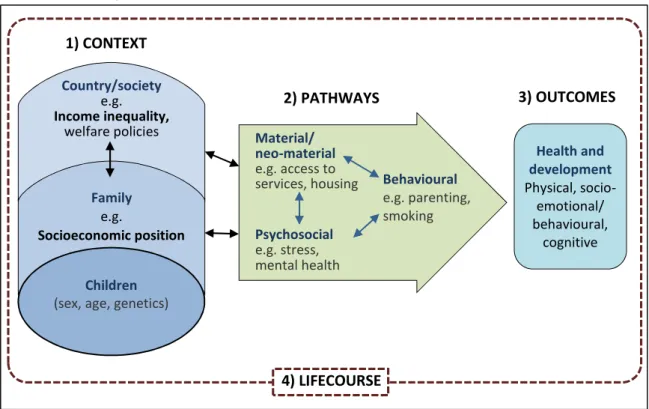
Figure 2-5: Income inequality, socioeconomic position and child health and development: Context, Pathways and Outcomes framework ...57
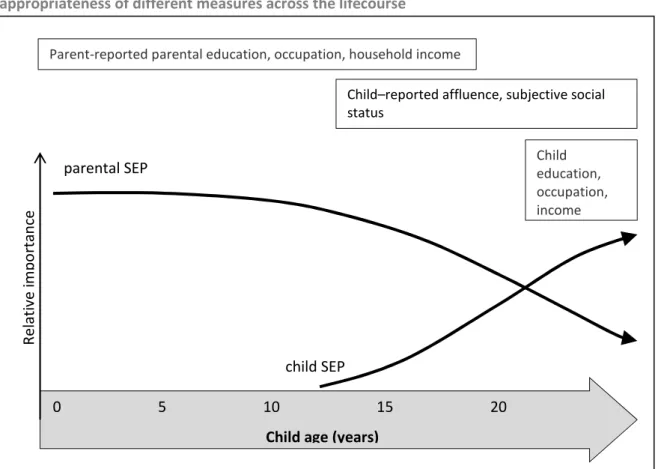
Figure 3-1: Relative importance of parental and child socioeconomic position and appropriateness of different measures across the lifecourse ...66
Figure 3-2: The Lorenz curve (hypothetical data) ...78
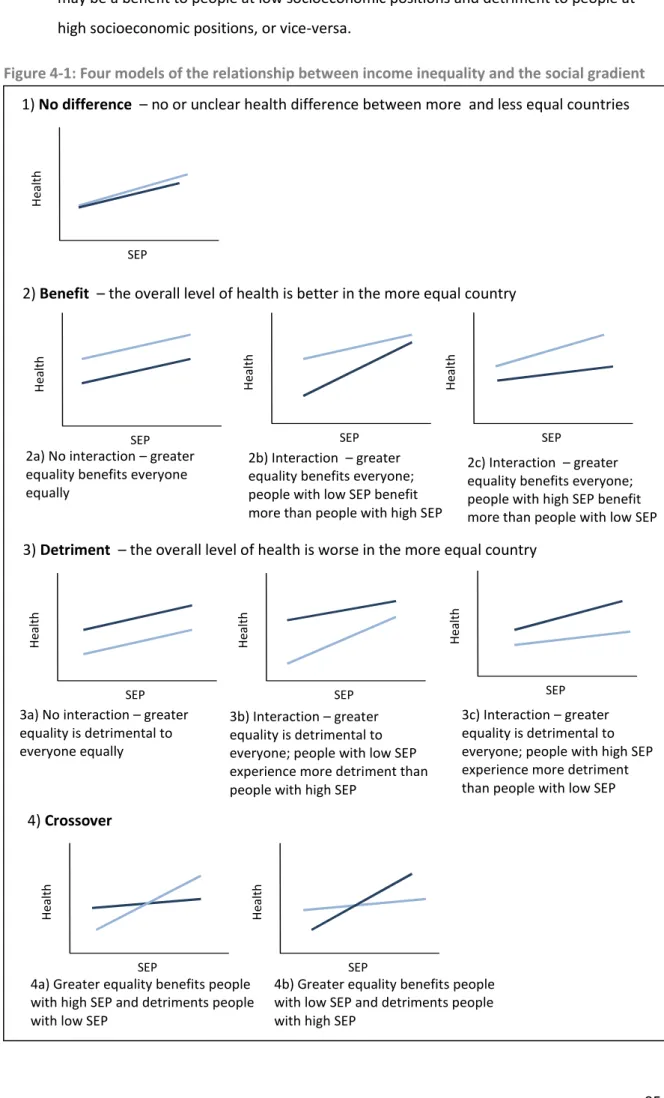
Figure 4-1: Four models of the relationship between income inequality and the social gradient ...95
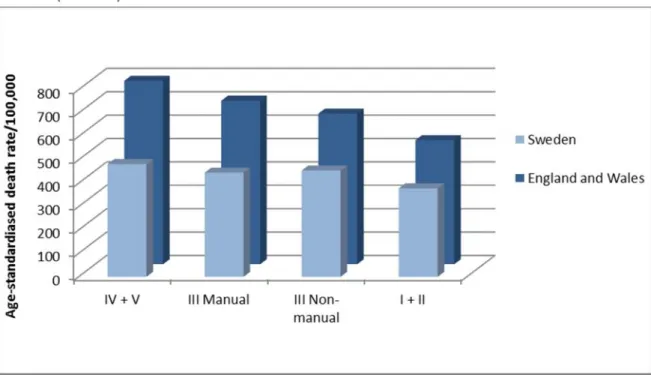
Figure 4-2: Neonatal mortality in Sweden (1985-6) and England and Wales (1983-5) by social class...103
Figure 4-3: Post neonatal mortality in Sweden (1985-6) and England and Wales (1983-5) by social class ...103
Figure 4-4: Death rates by social class for men aged 20-64 in England and Wales (1970-72) and Sweden (1961-79) ...104
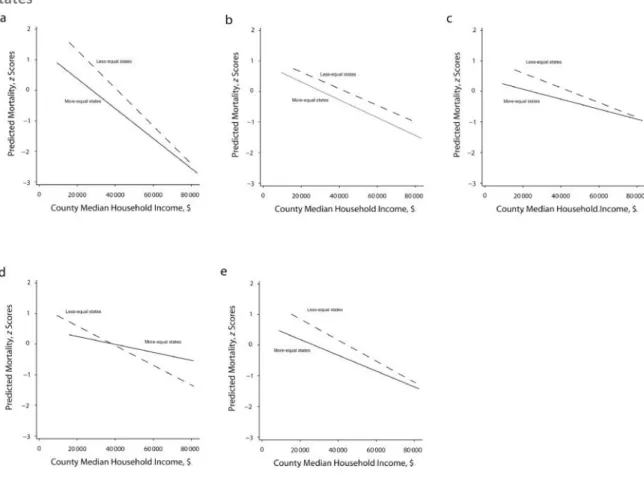
Figure 4-5: Mortality gradients by mean county household income in more and less equal states* ...105
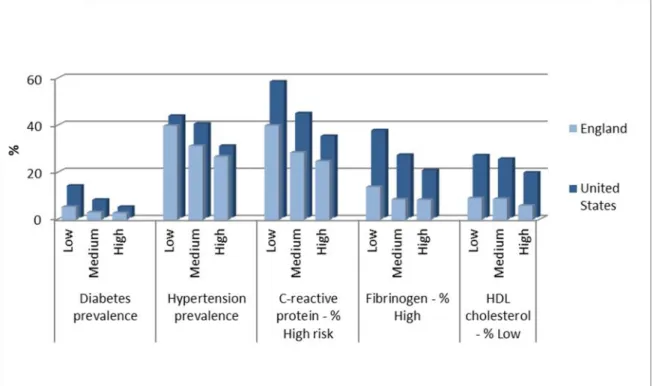
Figure 4-6: Clinical reports of illness by education group, ages 40-70, in the United States (1999-2002) and England (2003)...106
Figure 4-7: Clinical reports of illness by income group, ages 40-70, in the United States (1999-2002) and England (2003)...107
Figure 4-8: Age-adjusted prevalence of hypertension by subjective social status, US and UK, 1997-2001 ..108
Figure 4-9: Prevalence of self-reported chronic illness by education group in England and the United States, ages 55-64, 2002 ...109
Figure 4-10: Prevalence of self-reported chronic illness by income group in England and the United States, ages 55-64, 2002 ...110
Figure 4-11: Prevalence of self-reported obesity and overweight by income and education group in England and the United States, ages 55-64, 2002...110
Figure 4-12: Age-adjusted prevalence of self-reported fair/poor health, by subjective social status, US and UK ...111
Figure 4-13: Age-standardised percentages of limiting long-standing illness by education level, ages 25-74, Finland, Norway and Sweden, 1986/7 ...112
Figure 4-14: The relationship between income inequality (Gini coefficient) and absolute socioeconomic inequality in obesity (Slope Index of Inequality) for girls and boys in 23 high income countries, 2001-2 ...113
Figure 4-15: Prevalence of smoking and drinking by education and income group in England and the United States, ages 55-64, 2002...115
Figure 4-17: Inequalities in child externalising behaviour in Australia, Canada, the UK and the US by parental
education and parental income...116
Figure 4-18: Mean scores in reading achievement age 15 by parental social class, 2000, selected countries, excluding 'farm' category ...117
Figure 4-19: The relationship between document literacy scores age 16-25 and parents’ education, 1992-1998...119
Figure 4-20: The relationship between document literacy scores age 26-65 and parents’ education, 1992-1998...120
Figure 4-21: The relationship between income inequality and the slope of the social gradient in reading, OECD countries, 2009...121
Figure 4-22: Inequalities in vocabulary outcomes in Australia, Canada, the UK and the US by parental education and parental income...122
Figure 5-1: Development process for harmonised household income variables...151
Figure 6-1: Age distribution of children in the samples ...168
Figure 6-2: Proportion of children in each parental education category, by group and cohort ...171
Figure 6-3: Distribution of household income (PPP$ at 2005 prices) in the samples (unweighted)...173
Figure 6-4: Mean height for children, by group and cohort...174
Figure 6-5: Distribution of child height in the samples ...175
Figure 6-6: Percentage of children who are overweight or obese, by group and cohort ...176
Figure 6-7: Percentage of children with excellent health, by group and cohort...177
Figure 6-8: Percentage of children who have chronic illnesses, by group and cohort...178
Figure 6-9: Distribution of emotional problem and anxiety scores (standardised) in the cohorts (unweighted) ...180
Figure 6-10: Distribution of hyperactivity scores (standardised) in the samples (unweighted) ...182
Figure 6-11: Distribution of verbal cognition scores (standardised) in the cohorts...184
Figure 7-1: Key to graphs in this chapter...188
Figure 7-2: Mean height by parental education (unadjusted) ...190
Figure 7-3: Predicted height for children aged exactly 5 years at different parental education levels ...192
Figure 7-4: Mean height by equivalised household income quintile (unadjusted)...193
Figure 7-5: Predicted height for children aged exactly 5 years living in a 2 parent, 2 child household, at different levels of household income (p5, p25, p50, p75, p95) ...194
Figure 7-6: The proportion of children who are overweight or obese by parental education (unadjusted).196 Figure 7-7: Predicted probability of being overweight or obese for children aged exactly 5 years at different parental education levels ...198
Figure 7-8: The proportion of children who are overweight or obese by equivalised household income quintile (unadjusted) ...199
Figure 7-9: Predicted probability of being overweight or obese for children aged exactly 5 years living in a 2 parent, 2 child household, at different levels of household income (p5, p25, p50, p75, p95) ...200
parental education levels ...203 Figure 7-12: The proportion of children with excellent health by equivalised household income quintile
(unadjusted) ...204 Figure 7-13: Predicted probability of having excellent health for children aged exactly 5 years living in a 2
parent, 2 child household, at different levels of household income (p5, p25, p50, p75, p95) ...206 Figure 7-14: The proportion of children with chronic illness by parental education (unadjusted) ...208 Figure 7-15: Predicted probability of having a chronic illness for children aged exactly 5 years at different
parental education levels ...210 Figure 7-16: The proportion of children with chronic illness by equivalised household income quintile
(unadjusted) ...211 Figure 7-17: Predicted probability of chronic illness for children aged exactly 5 years living in a 2 parent, 2
child household, at different levels of household income (p5, p25, p50, p75, p95)...212 Figure 7-18: Mean standardised emotional problems and anxiety score by parental education (unadjusted)
...214 Figure 7-19: Predicted standardised emotional problems and anxiety score for children aged exactly 5 years
at different parental education levels ...216 Figure 7-20: Mean standardised emotional problems and anxiety score by equivalised household income
quintile (unadjusted) ...217 Figure 7-21: Predicted standardised emotional problems and anxiety score for children aged exactly 5 years
living in a 2 parent, 2 child household, at different levels of household income (p5, p25, p50, p75, p95) ...218 Figure 7-22: Mean standardised hyperactivity and inattention score by parental education (unadjusted) .221 Figure 7-23: Predicted standardised hyperactivity score for children aged exactly 5 years at different
parental education levels ...223 Figure 7-24: Mean standardised hyperactivity and inattention score by equivalised household income
quintile (unadjusted) ...224 Figure 7-25: Predicted standardised hyperactivity score for children aged exactly 5 years living in a 2 parent,
2 child household, at different levels of household income (p5, p25, p50, p75, p95)...226 Figure 7-26: Mean standardised verbal cognition score by parental education (unadjusted) ...228 Figure 7-27: Predicted standardised verbal cognition score for children aged exactly 5 years at different
parental education levels ...229 Figure 7-28: The difference in verbal cognition (in months of development) between parental education
categories, by group and cohort ...229 Figure 7-29: Mean standardised verbal cognition score by equivalised household income quintile
(unadjusted) ...230 Figure 7-30: Predicted standardised verbal cognition score for children aged exactly 5 years living in a 2
parent, 2 child household, at different levels of household income (p5, p25, p50, p75, p95) ...231 Figure 7-31: The difference in verbal cognition (in months of development) between children living in
Figure 8-1: Summary of social gradients in height, girls aged 5, by cohort (predicted from models) ...245 Figure 8-2: Summary of social gradients in overweight/obesity, girls aged 5, by cohort (proportion
overweight or obese predicted from models)...246 Figure 8-3: Summary of social gradients in excellent health, girls aged 5, by cohort (proportion with
excellent health predicted from models) ...248 Figure 8-4: Summary of social gradients in chronic illness, girls aged 5, by cohort (proportion with chronic
illness predicted from models) ...250 Figure 8-5: Changes in income inequality over time in the study countries, 1980-2010...254 Figure 8-6: Gross National Income and income inequality in study countries and other OECD countries, 2005
...256 Figure 8-7: Welfare regimes in the study countries and other OECD countries, in relation to income
inequality...259 Figure 9-1: Layers of health and development detriment ...272
Box 2-1: Classifications of welfare systems...55
Box 3-1: The 5 components of the gradient...85
Box 5-1: Terminology used by studies that have combined multiple datasets...135
Box 8-1: Socio-demographic characteristics of Rotterdam...239
I would like to thank my supervisor, Kate Pickett, for her guidance and support over the last 3 years. I’ve learned so much from her and she has been a great source of inspiration and encouragement for me. I am also thankful to Hilary Graham and Jonathan Bradshaw for their continued support in my Thesis Advisory Panel. I have enjoyed our interesting conversations at meetings and appreciated their helpful comments on my chapters.
I am grateful to my colleagues and fellow PhD students in the Department of Health Sciences. I have benefitted from their expertise and enjoyed our lunchtime discussions.
I could not have completed the research without the International Network for Research on Inequalities in Child Health. For their generous help, time and enthusiasm, I would particularly like to thank Louise Séguin, Jennifer McGrath, Elizabeth Quon, Tomas Faresjö, Hein Raat, Anne Witzjes, Béatrice Nikiéma, and Nicholas Spencer.
Many people have given me invaluable support and encouragement. I would like to thank my fantastic friends, who have provided so much support and friendship. In particular, thanks to Rosemary Morgan, Lena Kruckenberg, Noortje Uphoff, Baltica Cabieses. Finally, massive thanks to my family for their constant patience and encouragement.
Cohort study acknowledgements
The Millennium Cohort Study (MCS) - I am grateful to the Centre for Longitudinal Studies, Institute of Education for the use of these data and to the UK Data Archive and Economic and Social Data Service for making them available. However, they bear no responsibility for the analysis or interpretation of these data.
The Early Child Longitudinal Study (ECLS-K) - This report uses data from The Early Child Longitudinal Study - Kindergarten cohort (ECLS-K). The ECLS-K is managed by the National Center for Education Statistics, US Department of Education.
The Longitudinal Study of Australian Children (LSAC-K) -This report uses data from Growing Up in Australia: The Longitudinal Study of Australian Children (LSAC). LSAC was initiated and is funded by the Australian Government Department of Families, Housing, Community Services and Indigenous Affairs (FaHCSIA), and is undertaken in partnership with the Australian Institute of Family Studies (AIFS) and the Australian Bureau of Statistics (ABS).
National Longitudinal Survey of Children and Youth (NLSCY) - This report uses data from the National Longitudinal Survey of Children and Youth (NLSCY), managed by the Human Resources and Social Development Canada, the Special Surveys Division, Statistics Canada and the Centre for Education Statistics, Statistics Canada. Access to the NLSCY was through the Research Data Centre at McGill University, Montreal.
The Quebec Longitudinal Study of Child Development (QLSCD) -I am grateful to the Institut de la statistique du Québec, Direction Santé Québec, Gouvernement du Québec.
Generation-R (Gen-R) - The Generation R Study is conducted by the Erasmus Medical Center, Rotterdam in close collaboration with the School of Law and Faculty of Social Sciences of the Erasmus University Rotterdam, the Municipal Health Service Rotterdam area, the Rotterdam Homecare Foundation and the Stichting Trombosedienst & Artsenlaboratorium Rijnmond (STAR), Rotterdam. We gratefully acknowledge the contribution of general practitioners, hospitals, midwives and pharmacies in Rotterdam. The first phase of the Generation R Study was made possible by financial support from the Erasmus Medical Center, Rotterdam, the Erasmus University Rotterdam and the Netherlands Organization for Health Research and Development (ZonMw).
All Babies in Southeast Sweden (ABIS) - I am grateful to the ABIS team at Linkoping University, Sweden and to Professor Johnny Ludvigsson, who initiated the study.
I confirm that the research presented in this thesis is my own work. It has not been submitted for an award elsewhere. Where information has been derived from other sources, they have been appropriately acknowledged and full references have been provided.
Chapter 1: Introduction
This chapter provides an introduction to the thesis. It starts with background information and a justification for studying social gradients in child health and development in relation to income inequality. I then outline the aim and objectives and research questions for the thesis. I also provide an outline of the structure of the thesis, explaining how each chapter contributes to the aim and objectives.
1.1. Background and justification
Why study the social gradient in health in relation to income
inequality?
Income inequality is detrimental to population health
Comparing high income countries with different levels of income inequality, there is considerable evidence that health and development are better, on average, in more equal countries. This pattern is evident across a wide range of health and social outcomes. On average, populations in more equal countries have higher life expectancies, lower teenage pregnancy rates, lower infant mortality, better child wellbeing, lower crime rates and better educational achievement, for example (Pickett and Wilkinson, 2007, Wilkinson and Pickett, 2009b, Gold et al., 2002, Macinko et al., 2004, Mayer and Sarin, 2005).
However, much of the research has focussed on average health and wellbeing in the population. It is less clear how this benefit is distributed across society. Does everyone do better in more equal countries?
Socioeconomic circumstances are a key determinant of individual health
Within countries, there is social gradient in health: each incremental improvement in socioeconomic circumstances brings an associated gain in health. This pattern is evident, no matter how socioeconomic position is measured: health and wellbeing improve with increases in income, education, job status or neighbourhood conditions. Gradients exist for a wide range of
outcomes, including life expectancy, mental health, child development and educational achievement (Marmot, 2010).
It is uncertain how income inequality affects the health of people in different
socioeconomic circumstances
It is not clear how the social gradient in health varies in relation to the level of income inequality. In particular:
How does the slope of the social gradient vary in relation to income inequality? Is it steeper in more unequal countries?
How does the level of the social gradient vary in relation to income inequality?
Comparing both slope and level of the gradient, does everyone do better in more equal countries?
There is some evidence that the benefits of greater equality are widespread across the social gradient. These studies fall in to two key categories:
First, some studies have compared the level of health/ill health at different points on the social hierarchy between countries with different levels of income inequality. For example, infant mortality rates are lower across all social classes in (more equal) Sweden compared with (less equal) England and Wales (Leon et al., 1992). However, few studies have specifically analysed the role of income inequality in relation to the social gradient of health and development.
Second, some studies have specifically analysed how income inequality at the national/regional level interacts with individuals’ socioeconomic position in relation to health or wellbeing. These studies have employed multilevel modelling to analyse the interaction between the contextual effects of income inequality and the compositional effects of individual socioeconomic position. For example, one study used this approach to study life satisfaction among adolescents, concluding that socioeconomic inequalities in life satisfaction among young people within countries were independently related to both national income and income inequality (Levin et al., 2010). A number of studies have investigated the independent and interactive effects of individual income and state-level inequality on health using multi-level modelling (e.g. (Subramanian et al., 2001, Lochner et al., 2001).
However, the evidence is very limited and is not conclusive. The need for further evidence on health of people in different circumstances, in relation to income inequality, has recently been highlighted. For example, in a recent report on the relationship between income inequality and health, Rowlingson reviewed evidence that inequality is harmful to everyone in society,
or deciles) in a wider range of countries and on a wider range of health and social problems, would be useful” (Rowlingson, 2011, page 34).
There is therefore a need to explore how the social gradient in health in countries varies in relation to income inequality.
Understanding social gradients in relation to income inequality has important
policy implications
Income inequality has been rising in most high income countries since the 1980s. As a result, the richest 10% within each country now earn on average 9 times the amount earned by those in the bottom 10% (OECD, 2011a). In the UK, income inequality rose sharply in the 1980s. Since 1990, the pattern is more complex, depending on the measure of income inequality used. However, there has been an increase in top incomes relative to the rest of society (Figure 1-1 shows the how the ratio between the 99th percentile and median income has grown over time). It is
therefore important to understand the health and wellbeing implications of these social changes.
Figure 1-1: Rising income inequality in the UK, 1979-2011
Source: (Cribb et al., 2013)
Gaining a more nuanced understanding of how different socioeconomic groups are affected by income inequality has important policy implications. Understanding who benefits from greater equality and the extent of the benefit could influence the priority of income inequality in the policy arena. It would also provide information to inform policy responses.
Why study child health and development?
Inequality in health and wellbeing has origins in early childhood
The foundations of adult health and wellbeing are laid in childhood (Irwin et al., 2007). Inequalities in health and development during childhood have long-term implications throughout people’s lives, in terms of their heath, social and economic trajectories. Early childhood has been
identified as a critical period in terms of policy to reduce socioeconomic inequalities throughout the lifecourse (Marmot, 2010).
If greater inequality damages the lifelong trajectory of a child’s health into adulthood, and if this applies to children from the bottom to the top of the social gradient, then the policy implications are profound.
Child health/development is a useful case study
Finally, child health and development provides a useful case study for analysis. It is not possible to study all health/wellbeing outcomes at all ages, so is useful to narrow analysis down to childhood. There have been very few studies comparing the social gradient in more and less equal societies that have focussed on children’s health (including physical health, socio-emotional/behavioural and cognitive development).
It is useful to study inequalities in child health, in terms of interpretation of findings. There have been three dominant explanations for social gradients in adult health and the relationship between income inequality and health. Firstly, there is considerable evidence that factors associated with lower socioeconomic position cause poor health. Secondly, the relationship could be due to social selection (reverse causality), i.e. people with poor health tend to do worse and fall down the socioeconomic hierarchy, however there is limited evidence for this. Thirdly, an external factor could affect both health and socioeconomic position.
Arguments about reverse causality are less likely to apply for children. Severe childhood illness may have serious economic consequences for households. However, cognitive development, height and obesity, for example, are unlikely to push the family down the socioeconomic heirarchy. So societies are unlikely to develop greater income inequality as a consequence of health and social selection (downward income drift) among children. Therefore studying child health is particularly helpful in understanding the relationships between income inequality and health and social problems.
Why focus on high income countries?
The relationship between income inequality and health has been found to be strongest and most consistent among high income countries. Above a certain level of national income, increases in income per capita bear little relation to health, and a much closer association is observed between the distribution of incomes in the country and health outcomes (Wilkinson and Pickett, 2009b). Most of the evidence on the relationship between income inequality and health also stems from high income countries. I have therefore chosen to focus on the group of countries
Summary of research problem
We know that child health and development are better, on average, in more equal countries. We also know that there is a social gradient in child health and development within countries. It is not clear, however, how the social gradient varies in relation to income inequality: do children growing up in all socioeconomic circumstances do better in more equal countries?
1.2. Aim and objectives
Aim
To explore how the social gradient in child health and development varies in relation to income inequality in high income countries
Objectives
1) To review approaches to measuring and comparing the social gradient in child health and development
2) To review studies that have compared the social gradient in health and wellbeing between high income societies with different levels of income inequality
3) To analyse and compare social gradients in child health and development using data from high income countries with different levels of income inequality
4) To summarise and discuss the evidence on social gradients in child health and development in relation to income inequality
Specific research questions
The aim and objectives will answer the following specific research questions, concerning features of the social gradient in health and development:
How does theslopeof the social gradient vary in relation to income inequality? (Is the gradient steeper in more unequal countries?)
How does thelevelof the social gradient vary in relation to income inequality? (Is health worse overall in more unequal countries?)
Does everyone do better in more equal countries? (comparing both the slope and level of the gradient)
1.3. Structure of thesis
The thesis is structured into 3 parts, with 10 chapters. A summary of how each of the chapters contribute to achievement of the overall objectives is provided in Table 1-1.
Part I: Background and literature review
This part contains three chapters.Chapter 2: Socioeconomic position, income inequality and child health and
development
This chapter provides a summary of evidence on the social gradient in child health and development, and the relationship between income inequality and health. It provides an overview of the evidence on patterns and associations, and considers the theories and mechanisms that have been proposed in the literature. This chapter provides a background to the other chapters in the thesis, and, in particular, provides background information for the discussion in chapter 9.
Chapter 3: Approaches to measuring and comparing socioeconomic inequalities
in child health/development and income inequality
This chapter provides an overview of the approaches towards measurement of socioeconomic position (with a focus on children), health inequality/the social gradient, income inequality and child health and development. This information informs interpretation of studies in the critical review (chapter 4) and informs the development of methods for the comparative cohort analysis (chapters 5-8). The review contributes to objective 1.
Chapter 4: Critical review of studies that have compared the social gradient in
health and wellbeing in more and less equal societies
This chapter reviews studies that have compared the social gradient in health and wellbeing (for adults and children) between societies with different levels of income inequality. Where the role of income inequality has not been analysed in the studies, I conduct further analysis to investigate the relationship with income inequality. This chapter achieves objective 2.
PART II: Comparative cohort analysis
This part contains 4 chapters. These chapters together report the comparative analysis of social gradients in child health and development using cohort studies from high income countries, in order to achieve objective 3.
Chapter 5: Comparative cohort analysis - Background and methods
This chapter provides a short review of methods for harmonising data from cohort datasets. It also provides background information on the cohort datasets included in the study. Finally, it provides an overview of the methods I used to harmonise the cohort datasets and analyse and compare social gradients in child health and development.
Chapter 6: Comparative cohort analysis - Descriptive statistics
This chapter provides descriptive statistics for the included cohort studies. It provides an overview of the samples included (and numbers excluded). It includes descriptive statistics on household income and parental education for children in each cohort. Descriptive statistics are also provided for each child health and development outcome.
Chapter 7: Comparative cohort analysis - Social gradients in child health and
development in relation to income inequality
This chapter presents and compares social gradients in child health and development in relation to national level income inequality for each cohort dataset. Both unadjusted gradients and analyses adjusting for child age and sex are presented for household income, parental income and all child health and development outcomes.
Chapter 8: Comparative cohort analysis - Discussion
This chapter discusses the findings from the comparative cohort analysis. It addresses two key questions. First: to what extent can we be certain that findings represent actual population differences (rather than other differences, e.g. measurement variations between cohorts)? Second, what role does income inequality play in explaining differences in social gradients in child health and development between countries (with consideration of other contextual differences)?
PART III: Discussion and conclusion
This part contains 2 chapters:
Chapter 9: Discussion of the evidence on social gradients in relation to income
inequality
This chapter brings together the evidence on how social gradients in child health vary in relation to income inequality from the critical review (chapter 4) and the comparative cohort analysis (chapters 5-8). I then discuss the findings of the thesis, developing implications for theory and policy. This chapter achieves objective 4.
Chapter 10: Conclusion
Appendices
The appendices include further information on topics discussed in the chapters and further tables of statistics for the comparative cohort analysis.
Table 1-1: Summary of objectives addressed in thesis chapters
Objectives Chapters addressing
objective
1) To review approaches to measuring and comparing the
social gradient in child health and development Chapters 3 and 5 2) To review studies that have compared the social gradient
in health and wellbeing between high income countries with different levels of income inequality
Chapter 4 3) To analyse and compare social gradients in child health
and development using data from high income countries with different levels of income inequality
Chapters 5-8 4) To summarise and discuss the evidence on social gradients
in child health and development in relation to income inequality
Chapter 9
1.4. Presentation of findings
Wherever possible, findings on social gradients in child health are presented using graphs (additional tables and figures are provided in the Appendices). Graphs have been colour coded in relation to income inequality to facilitate visual comparisons of gradients. All gradients are presented in shades of blue, with lighter shades of blue representing more equal countries and darker blue representing more unequal countries.
Chapter 2: Socioeconomic position, income
inequality, and child health and development
This chapter summarises the evidence on the relationships between socioeconomic position, income inequality and health, with a focus on child health and development. I first review the evidence on the relationship between socioeconomic position and child health and development, with an overview of the different models that have been put forward to explain the relationship. I then summarise the evidence on the relationship between income inequality and health at a national level, followed by an overview of explanations and mechanisms that have been put forward. I give an overview of the role of the welfare state, in relation to income inequality, socioeconomic position and health. Finally, I develop a conceptual framework to summarise the overlapping layers of influence on child health and development.
2.1. Introduction
Many countries are becoming more unequal. Since the mid-1980s the level of income inequality has grown in two thirds of OECD countries, including marked increases in inequality in the UK and the US (OECD, 2008).
There has been increasing recognition of the importance of socioeconomic inequality and other broad social conditions are key determinants for population health, in relation to the relatively small role played by health care systems (Evans et al., 1994). The unequal distribution of socioeconomic resources within countries affects population health and wellbeing in two ways. First, there are social gradients in health and wellbeing within countries, such that each incremental level of socioeconomic advantage confers health and wellbeing benefits at the individual level. Second health and wellbeing tend to be worse, at a population level, in countries that are more unequal.
This chapter summarises the evidence on the social gradient in children’s health and development, and outlines the models developed to explain these links. I then give an overview of the relationship between income inequality and child health and wellbeing and our understanding of the mechanisms. I also give an overview of the role of the welfare state in relation to income
inequality, socioeconomic position and health. Understanding the types of welfare states and their components helps us to contextualise understanding of socioeconomic position, income inequality and health. Throughout the chapter, I discuss the evidence with a focus on children’s health and development. I have defined health and development broadly to include physical health, socio-emotional/behavioural and cognitive development outcomes.
2.2. Social gradients in health and development
A summary of the evidence
The health gap between the advantaged and disadvantaged in society has long been recognised. Victorian public health reformers in the UK noted the burden of ill-health among the poor and those working in particular occupations (Whitehead, 2000) and campaigned for social reform and public health interventions. Emphasis was placed on reducing the gap between the rich and the poor. More recently, attention has shifted to the gradient in health across the whole socioeconomic spectrum. The effects of social and economic factors on health are not confined to those living in poverty; rather, every incremental increase in socioeconomic position confers health and wellbeing advantages (Adler et al., 1994). There is firm evidence that health and wellbeing are incrementally worse among the more disadvantaged in society, measured in different ways. Yet the extent and causes of inequalities remain debated, due to methodological difficulties (discussed further in chapter 3) and political implications.
Socioeconomic position can be defined at the individual or household level, in terms of income, educational achievement or occupation, or at the area level, for example neighbourhood deprivation (discussed further in chapter 3). No matter how we choose to measure socioeconomic disadvantage, the gradient is still apparent. This pattern also exists in different parts of the world, including low income countries (Victora et al., 2003).
The gradient is evident across different child health, socio-emotional/behavioural and cognitive development outcomes (Bradley and Corwyn, 2002). The pattern is also present at different stages of the lifecourse (Chen et al., 2006, Bradley and Corwyn, 2002).
Before birth, there is a social gradient in foetal development, including intrauterine growth restriction (Kramer et al., 2000). Women with lower socioeconomic position are more likely to have adverse birth outcomes, including low birth weight and preterm birth (Blumenshine et al., 2010). In Britain, babies in the most deprived tenth of areas are twice as likely to be born very preterm (between 22 and 32 weeks’ gestation) than those in the least deprived tenth (Smith et al., 2007). There is also a steep social gradient birth weight (Howe et al., 2010) and in infant
Early child development has a steep social gradient. Child height is associated with socioeconomic circumstances (Howe et al., 2010). Gradients in unintentional injuries are particularly steep: disadvantaged children are more likely to have accidents at home or on the road (Laflamme et al., 2010). Considerable differences in cognitive development between children from wealthier and poorer backgrounds are already evident at age 3 and widen further by the time children start school at age 5 in the UK (Dearden et al., 2011).
Gradients persist throughout childhood, into adolescence. Young people from more disadvantaged backgrounds are more likely to engage in detrimental health behaviours, including smoking, poorer diet and less physical activity (Hanson and Chen, 2007). When asked to rate their health or life satisfaction, adolescents at higher socioeconomic positions give higher ratings (Levin et al., 2010, Starfield et al., 2002).
However, evidence on the social gradient is not consistent across health and development outcome and age groups. There is conflicting evidence on how and why the gradient changes with age. Some researchers have demonstrated that gradients flatten out during adolescence, developing a theory of ‘equalisation in youth’ (West, 1997). Yet other analyses have found persistent gradients through this age period (Starfield et al., 2002). Overall, patterns seem to differ by outcome. For some outcomes, gradients are steeper at younger ages and level out in adolescence, for example accidents (Laflamme et al., 2010). On the other hand, for some outcomes there is evidence that gradients may become steeper as children get older, for example gradients in respiratory illnesses appear during adolescence (Chen et al., 2006). A number of reasons have been put forward for these gradients, which are discussed below.
Inequalities in health and development during childhood have lifelong effects into adulthood (Hertzman and Wiens, 1996). The pathways through which this occurs are discussed in the following section. There is growing evidence of how the long-term effects can be modified through intervention (summarised in chapter 9).
How does socioeconomic position influence health?
There is clear and consistent evidence that people’s position in the socioeconomic hierarchy has a strong influence on their health, yet the pathways through which socioeconomic circumstances affect health are complex and remain disputed. In this section I review the main models of pathways: material, behavioural and psychosocial pathways, and lifecourse explanations. I consider the relative importance of the different models in explaining gradients, and why these may change with age.
I give a general overview, with a particular focus on child health and development. For each model, it is important to consider both the mechanisms through which child health is affected directly and the indirect mechanisms through parents, other relatives, peers and the wider community. We should also bear in mind that child socioeconomic position is not static – rather, it may change over time.
Material and neo-material pathways
It has long been recognised that people who lack the infrastructure or material means necessary for good health have higher rates of illness. Indeed public health infrastructure, as well as material living conditions played a key role in the late eighteenth century decline in mortality in Britain (Szreter, 2002). However, following the epidemiological transition, the relevance of material conditions for the most prevalent diseases today is less certain.
The material model asserts that lacking finances and resources in absolute terms affects health. A range of resources are needed for children to develop, including adequate housing and nutrition. Housing quality affects health, playing a causal role in conditions such as asthma and lead poisoning (Bashir, 2002). In high income countries (and increasingly in low and middle income countries), inadequate nutrition includes both insufficient and excess nutrition in parallel.
The neo-material model recognises that causes of disease have changed, and incorporates the effects of infrastructure and services, as well as individual material means, in creating the differential accumulation of exposures and experiences that affect health (Lynch et al., 2000). Differential access to and quality of services, including health care and education clearly affects children’s health and development. However significant social gradients remain despite the universal coverage of the NHS in the UK.
Whilst material and neo-material models explain why people living in absolute poverty are at greater risk of poor health, they are less useful for explaining the social gradient. Few people live in abject poverty in the UK today; the vast majority of people have adequate housing, consume enough calories and have access to education and health services. Yet we do not only see the few living in absolute poverty experiencing worse health and development, rather people experience worse outcomes at every step down the social ladder. An absolute lack of resources or services therefore is unlikely, on its own, to explain the gradient we see in child health and development. Material circumstances may affect health directly or indirectly through shaping health behaviours such as smoking, nutrition and exercise. The links between material factors and health behaviours are clear in some cases (e.g. we need adequate income to be able to eat healthily), although psychosocial factors such as stress may also be important (Wilkinson and Pickett, 2006). There are
psychosocial effects of inequality cannot be understood without reference to the unequal material conditions in which people live their lives.
Psychosocial pathways
There has been growing emphasis on psychosocial influences on health. Psychological mechanisms have been recognised for several decades, e.g. (Evans et al., 1994), and biological evidence for these pathways is now growing. According to psychosocial theories, it is a person’s position in the social hierarchy relative to others that is important to health (rather that their absolute level of resources). Income, education or occupation are markers of prestige and status, rather than material resources themselves. In other words, there is a focus on how people feel rather than what they have. For example, circumstances such as social isolation or lack of control, which make people feel stressed, can impact on their mental and physical health.
The observation of social gradients of health, even among people who do not seem to have an absolute lack of material resources, first led to the suggestion that psychosocial mechanisms affect health. The Whitehall studies of health among civil servants in London added evidence that there was a gradient in coronary heart disease even among people who worked in an office environment (Marmot et al., 1978). Participants did not seem to lack the material means necessary for health or to be exposed to physical occupational hazards. Furthermore, employment grade explained more of the differences in health than conventional risk factors and risk behaviours, such as smoking. Marmot and colleagues therefore suggested that stress and social status played a role. In a follow-up study, low control at work was found to explain a large part of the gradient in coronary heart disease (Marmot et al., 1997).
Further, a number of studies have shown that where people stand in the social hierarchy relative to others, e.g. income rank, is more important that their absolute income for their mental health and life satisfaction (Wood et al., 2012, Boyce et al., 2010). A recent study that I coauthored showed that relative socioeconomic position is also important for adolescent health: relative measures of affluence (rank and Yitzhaki index within the region or school) related more closely to psychosomatic symptoms in adolescents than absolute material affluence (Elgar et al., 2013). It is useful to break down the psychosocial mechanisms into overlapping layers of influence on health. At the centre, we can look at the individual and the ways in which psychological factors have a biological influence on the body. We can then look back to the ways that the social environment has influenced these psychological factors, including the proximate social environment (home, school, work and community) and the national context.
These factors may have a direct impact on children’s health, or may have an indirect impact through parental health and behaviour. Children at different socioeconomic positions have differential experiences of these psychosocial factors, with differential impacts on health and development. For example children whose mothers were stressed during pregnancy are more likely to develop emotional or cognitive problems (Talge et al., 2007).
How do psychological factors have a physiological effect on health and wellbeing?
Our understanding of the physiological processes through which stress and other psychological factors affect health focuses on neuroendocrine pathways, wound healing and immune response. Although I summarise the evidence on each of these separately below, it is important to note that the biological pathways are complex and interact.
Neuroendocrine pathways evolved to protect the body against short-term, physical threats in the past – the ‘fight or flight’ response. Increased heart rate, the release of energy and other responses helped the body to rapidly fight off the impending threat, after which it returned to normal with little effect on health. In today’s environment, people rarely experience short-term physical threats. However, psychological stresses are common and often chronic, for example financial worries, social isolation, and even sitting in traffic jams (Bartley, 2004). Psychologically stressful conditions repeatedly trigger the body’s ‘fight or flight’ response, which, as short-term physical responses are rarely required, can have a damaging effect on the body in the long term. Exposure to chronic stressful conditions can divert energy from normal body activities and affect the cardiovascular and immune systems, in turn making people more susceptible to infections and coronary heart disease. These pathways and problems are summarised in Table 2-1.
There is evidence of a social gradient in these pathways and hormones. For example, people with lower socioeconomic position have higher levels of cortisol and fibrinogen and higher blood pressures (reviewed in Bartley, 2004). However, cortisol levels and response patterns are complex and difficult to research. The evidence on social gradients remains inconsistent and further research is needed.
There is growing evidence of these patterns among children. Socioeconomic circumstances can have long-term effects on children through psychological and neurological pathways, for example through socioeconomic position and trauma can affect development of the endocrine system, including corticosterone release (Keating and Hertzman, 1999). In a study in Canada, for example, morning salivary cortisol levels were found to be higher among young children from low socioeconomic backgrounds, although the inequality levelled out among high school age children (Lupien et al., 2001). Evidence from animal models has explored the role of the HPA axis, showing
that prenatal stress can affect the functioning of the HPA axis, with long-term effects on offspring development (Talge et al., 2007).
Further evidence of the physiological effects of stress has been provided from studies of wound healing and immune response. Although material living conditions clearly play an important role in socioeconomic differences in exposure to infection, there is increasing understanding of how stress can impair the immune system, increase susceptibility to and severity of infections. These processes may play in important role among children, for whom infection is an important cause of morbidity and mortality.
Table 2-1: Neuroendocrine pathways and chronic stress Neuroendocrine
pathway Physiological role Problems with chronic exposure tostress
Sympatho-adrenal circuit Regulates the release of noradrenaline andadrenaline – the ‘fight or flight’ response
Arouses the mind, mobilises energy and suppresses body functions not required for immediate survival
Accelerates heartbeat, increases blood pressure and body temperature, increases metabolic rate in response to threats
Triggers release of fibrinogen, which helps blood to clot
In evolutionary past was an important response to fear or anger; the pathway was switched off when the threat had passed
Chronic exposure to stressful situations can lead to raised blood pressure,
Blood clotting in the absence of injury may lead to a greater chance of cardiovascular disease
Hypothalamic- pituitary-adrenocortical (HPA) circuit
Releases cortisol and glucocorticoids into the bloodstream
Feedback mechanisms adjust the amount of cortisol circulating in the bloodstream
Has metabolic effects - releases sugars and fats from storage to provide energy for the body. These can be burned off if the stressful situation creates violent activity
Has psychological effects – glucocorticoids promote vigilance
Many chronic psychological stress situations do not require sugars and fats for energy. If released sugars and fats are not burned off they can lead to the build-up of atheroma in arteries, putting the body at increased risk of
cardiovascular disease
Long-term high levels of cortisol may have long-term psychological effects, e.g. depression, paranoia
Glucocorticoids may divert body from other tasks e.g. fighting infection, repairing damage Source: (Brunner and Marmot, 2006) (Bartley, 2004)
How does the social environment affect psychological factors?
We can look at the proximate social environment in the household or family, including the quality of family relationships, and parental separation. The school, work or community environment also plays a role. These all overlap, for example the work environment may lead to parental stress, which affects children in the home environment.
Much research has been conducted on the role of stress. Stress is often perceived to be a condition that affects people at the top of the social hierarchy in high-powered, high responsibility jobs, such as bank managers, solicitors. However, studies have shown that people who have a lower social status often do monotonous work, have inadequate social support and financial worries and experience greater on-going psychological stress (Brunner and Marmot, 2006). There has been considerable research on how the work environment affects levels of stress. Numerous studies have demonstrated that a high level of demand with little control at work, or high effort and low reward, are important risk factors for poor health (Karasek et al., 1988, Marmot et al., 1997). The effects of status within groups on stress have been studied among non-human primates. This has enabled researchers to experimentally alter status hierarchies, showing that low status and a drop in status are associated with higher levels of the stress hormone cortisol (reviewed in Wilkinson and Pickett, 2009a).
There has been less research on the psychosocial effects of the home and school environments for children. It is unclear how children experience stress directly and the health effects of this. But it is easy to understand how parental stress could affect parental behaviours with children, including the level of interaction, and health behaviours, which may in turn influence outcomes such as accidents, socio-emotional or cognitive development. Maternal mental health plays a key role and has a steep social gradient (Figure 2-1), so more disadvantaged children are at greatest risk. Mothers who develop depression are more likely to develop poor health behaviours, show lower interaction and attachment with their children and lower concentration, which in turn can affect child health and development (O'Hara, 2009). Children whose mothers are depressed have poorer cognitive development (Mensah and Kiernan, 2010). They also have poorer social and emotional development and are more vulnerable to developing depression or anxiety themselves (Murray, 2009, Mensah and Kiernan, 2010). There is also evidence of poorer physical health and development, including poorer foetal growth (Hoffman and Hatch, 2000), and lower breastfeeding rates (Chung et al., 2004) among the children of mothers with postpartum depression.
![Ethyl 2 {1,3 bis[(6 chloro 3 pyridyl)methyl]imidazolidin 2 ylidene} 2 cyanoacetate ethanol solvate](data:image/gif;base64,R0lGODlhAQABAIAAAP///wAAACH5BAEAAAAALAAAAAABAAEAAAICRAEAOw==)