Mechanical Power Transmission
Editors
R Gnanamoorthy
Shankar Krishnapillai
Editors
R Gnanamoorthy
Shankar Krishnapillai
Piyush Shakya
Proceedings of the 1
stInternational Conference on Mechanical Power
Transmission (ICMPT 2019) held at IIT Madras, Chennai, India during
July 11-13, 2019
Organized by
Department of Mechanical Engineering
Indian Institute of Technology Madras
Vibration Analysis of Heterogeneous Gearbox Faults using
EMD Features and SVM Classifier
Setti Suresh1 and VPS Naidu2
1School of Avionics, Institute of Science and Technology, JNTUK, Kakinada, India.
2Multi Sensor Data Fusion Lab, National Aerospace Laboratories, Bangalore, India.
Email: [email protected] and [email protected]2
Abstract. Gearbox is one of the important mechanical power transmission device most commonly used in automobiles and industries to get the desired change in speed and torque. The gearbox fault diagnosis has given utmost importance for its significance in preventing halts of a mechanical system and guaranteeing an advantage of sufficient maintenance. This paper presents the vibration analysis of heterogeneous gearbox faults using EMD features and SVM classifier. The vibration signal is converted into intrinsic mode functions (IMF) with decreasing order of frequencies using empirical mode decomposition (EMD) method. Feature vector consisting of information theoretic features have been computed for each IMF and concatenated to form a feature set. By using random permutations, the feature set has been divided into training and testing sets. The support vector machine (SVM) algorithm has been used as a classification technique to diagnose the gearbox faults, which consists of five-class classification. The accuracy of the developed algorithm has been validated using 100 Monte Carlo runs. A comparative study has been carried between computed features and varying IMF components. The observations made were - clear discrimination of the gearbox faults and improved classification accuracy, which contain - chipped tooth, missing tooth, root fault, surface fault and healthy working state of the gear.
1. Introduction
Gearbox is a rotary complex system, which aims at effective mechanical power transmission in terms of speed and torque. It consists of different gear mechanisms embedded together to achieve desired mechanical benefits. As it is such a complex mechanical system, it is common to experience different faults associated with gear. Several qualitative and quantitative research has carried out from decades to bring the abnormalities in the gear, which lead to failure of the gearbox. Still, there is an ambiguity in the fault detection and diagnosis of gearbox due to its diverse applications and innovative gear designs. Therefore, it is important to develop different algorithms using trending mathematical computations to detect and diagnose the gearbox faults.
The condition monitoring of rotating machines was attained by measurements of vibratory, thermal, acoustics and oil-based signals. Among them, vibration analysis is the most widely used method, as the measured signal consists of information regarding the cause of vibration and characteristic vibrations of rotating components [1]. When there is a fault in the rotating machinery, the characteristics of acquired vibration signal changes. The vibrations measured from the gearbox are complicated that contain composite signal information, which needs to be analysed through different fault diagnosis methods to state the condition of the gearbox. Over the past decades, many researchers and scholars have done a pivoting role in implementing signal-processing techniques to diagnose the different types of gearbox faults. The ideology of dividing the original signal into local windows, then
175
computing the characteristic features of tri-domain that include time, frequency and time-frequency features followed by local feature-based gated recurrent unit (LFBGRU) model has been proposed in [2]. The methodology to localize the faulty gear using EMD and the estimation of two new condition indicators (features) on the angular pitch rather than using the entire vibration signal have asserted in [3]. The analogy of pre-processing the signal using differentiation to enhance the frequency and fault diagnosis of bearing using wavelet decomposition through mean and standard deviation features has presented in [4]. There are several other proposed ideas and experimental analyses [6-8] carried out by distinguished researchers with a common aim to detect and diagnose the fault of rotating machinery.
This paper presents a comparative study of vibration analysis of heterogeneous gearbox faults using EMD features and SVM classifier. The proposed workflow sequence contains, dividing the original vibration signal into segments/windows/epochs, pre-processing, application of empirical mode decomposition in the fault diagnosis of rotating machinery and SVM classifier. A comparative study of individual features behaviour and feature combination behaviour with respect to varying IMF components has been presented.
2. Methodology
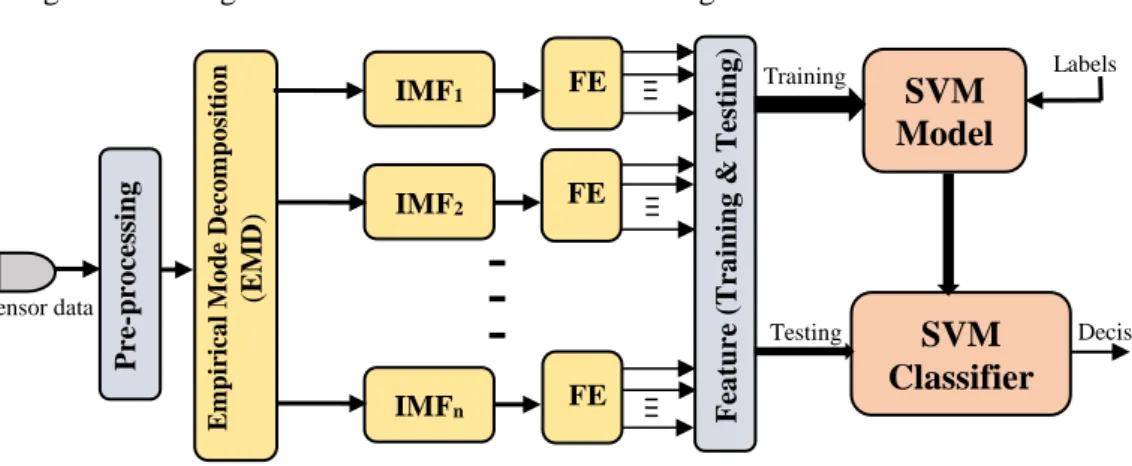
Fig 1 shows the proposed workflow sequence involved in the gearbox fault diagnosis. The workflow starts with data acquisition from the gearbox followed by pre-processing the vibration signal. The segmented signal is decomposed into intrinsic mode functions (IMF’s) using the EMD method. Further diagnostic features are computed for each IMF to get the discriminative information from the faulty signals. All the computed feature vectors from each IMF append together to form a feature set. To advance the diagnosis of the gearbox from fault detection to fault classification, the feature set is divided into training and testing sets to classify the fault between measured gearbox vibration signals. The training set is used to train the SVM model along with labels and the testing set is used to test the developed SVM model to get the final decision of fault classification. The application of each block in the fault diagnosis of the gearbox is illustrated in the following subsections.
Figure 1. Workflow diagram of gearbox fault diagnosis.
2.1 Data Acquisition
The vibration signals of the gearbox dataset [5] have been collected from Drivetrain Dynamic Simulator (DDS). The dataset consists of two operating conditions with a combination of rotating speed and load configuration set as 20Hz-0V and 30Hz-2V. Each configuration has five-class classification, which include one healthy state and four fault states (chipped tooth, missing tooth, root fault and surface fault) of the gearbox. Each state composed of seven vibration signals (1-motor vibration, 3-planetary gearbox vibration along x, y, z direction, 3-parallel gearbox vibration along x, y, z direction) and one torque sensor data.
2.2 Pre-processing
Pre-processing is an important part in the analysis of complex vibration signals. The original signal is differentiated to enhance the frequency of the signal [4]. In this paper, the acquired signals are
Sensor data Labels Decision F ea ture (T ra ini ng & T esti ng ) P re -pro ce ss ing IMF1 Emp ir ic a l Mo de D ec o m po sit io n ( EMD ) IMFn IMF2 FE FE FE
SVM
Model
SVM
Classifier
Training Testingsegmented over a length of 32768 samples [3]. All the sequence of steps (as shown in Figure 1) involved in the gearbox fault diagnosis after pre-processing are applied to the segmented signal and the information from all such segments are concatenated to get the final decision in fault diagnosis.
2.3 EMD
Huang et al [9] introduced Empirical Mode Decomposition (EMD) for the first time as a data-driven technique and used effectively with non-linear and non-stationary time series data. EMD is a self-adaptive technique, which helps to analyse the signal in both the time and frequency domain. It has applied to decompose the segmented signal into a set of intrinsic mode functions (IMF) based on local time scale characteristics with a decreasing order of frequencies [10].
2.4 Feature Extraction
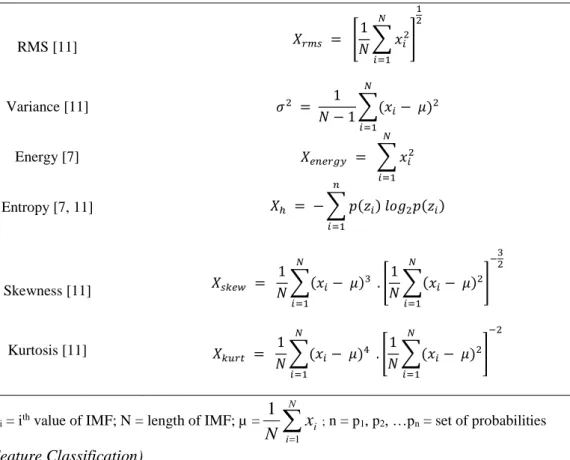
In general, feature extraction is an act of representing the original signal in terms of reduced dimensionality. In place of analysing the huge length of observations (cause of time lapse), it has converted into features that describe the properties of the original signal. Table 1 shows the expression of computed features for gearbox fault diagnosis and gear wear prediction. Here, each IMF component is converted into a feature vector comprising of estimated features. The significance of each feature in the fault diagnosis of the gearbox has illustrated briefly in the results and discussion section.
Table 1. Computed feature vectors for gearbox fault diagnosis and gear wear prediction.
Features Mathematical formula
RMS [11] 𝑋𝑟𝑚𝑠 = [ 1 𝑁∑ 𝑥𝑖2 𝑁 𝑖=1 ] 1 2 Variance [11] 𝜎2 = 1 𝑁 − 1∑(𝑥𝑖− 𝜇)2 𝑁 𝑖=1 Energy [7] 𝑋𝑒𝑛𝑒𝑟𝑔𝑦 = ∑ 𝑥𝑖2 𝑁 𝑖=1 Entropy [7, 11] 𝑋ℎ = − ∑ 𝑝(𝑧𝑖) 𝑙𝑜𝑔2𝑝(𝑧𝑖) 𝑛 𝑖=1 Skewness [11] 𝑋𝑠𝑘𝑒𝑤 = 1 𝑁∑(𝑥𝑖− 𝜇)3 𝑁 𝑖=1 . [1 𝑁∑(𝑥𝑖− 𝜇)2 𝑁 𝑖=1 ] −32 Kurtosis [11] 𝑋𝑘𝑢𝑟𝑡 = 1 𝑁∑(𝑥𝑖− 𝜇)4 𝑁 𝑖=1 . [1 𝑁∑(𝑥𝑖− 𝜇)2 𝑁 𝑖=1 ] −2
Note: xi = ith value of IMF; N = length of IMF; µ =
N i i x N 1 1 ; n = p1, p2, …pn = set of probabilities 2.5 SVM (Feature Classification)
Support vector machine - A modern classification or regression technique which defines a plane and divide the feature space into subspaces to attain minimum classification error has used in the feature classification of gearbox vibration signals. The feature set comprising of feature vector observations of the healthy signal, chipped tooth, missing tooth, root fault and surface fault, of planetary gearbox has divided into 80% of training and 20% as testing sets. The training set is used to train the SVM model and the testing set is used to test the developed SVM model with five-class classification.
3. Results and Discussions
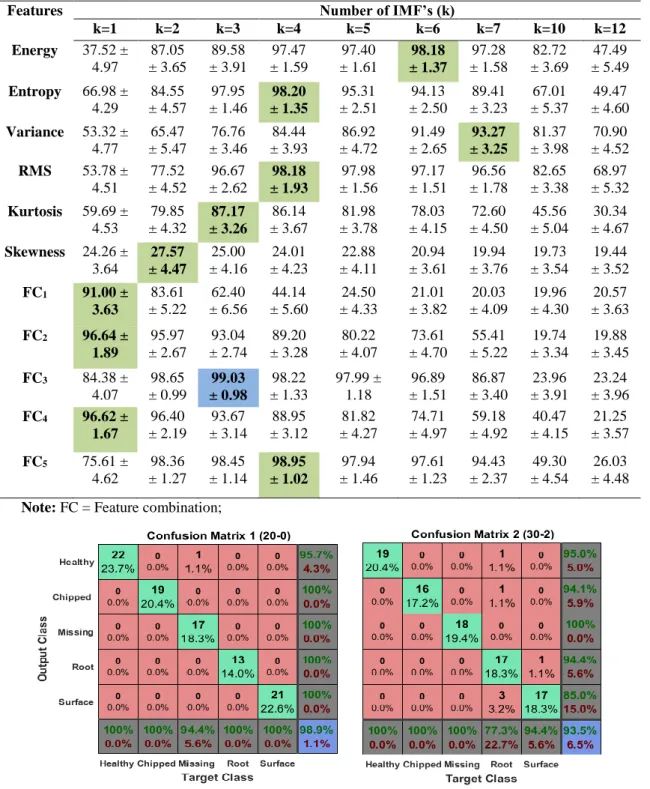
The proposed workflow was carried under both the configurations (20-0 & 30-2) and random permutations were used, to prepare the feature set into training and testing sets. The SVM model along with the classifier is set under 100 Monte Carlo runs to achieve the consistency in the classification accuracy of gearbox fault diagnosis. Table 2 shows the classification accuracy of the developed SVM model with five-class classification under 20-0 configuration for the planetary gearbox considering original signal. A comparative study of each computed feature, with the variation in the level of IMF components (k) to achieve a theoretical conclusion of gearbox fault diagnosis, is tabulated exclusively. The numerical values in percentage (mean and standard deviation of 100 Monte Carlo runs) denote the SVM classification accuracy with individual features considered and with different feature combinations (FC).
The feature ‘energy’, which indicates the strength of the signal, alone classifying the gearbox fault signals with a maximum accuracy of 98.18% at k = 6. It is observed that each feature has its own fault classification accuracy at different levels of IMF components i.e., ‘entropy’, which is a measure of non-linearity of the signal is with a maximum classification accuracy of 98.20% at k=4, ‘variance’, which denotes the squared deviation of the signal from its mean value having an accuracy of 93.27% at k=7, ‘root mean square (RMS)’, which aims at measuring the effective value of power content in the vibration signal having a maximum accuracy of 98.18% at k=4, ‘kurtosis’, which determines the tailedness of the probability distribution (the damaged vibration signal of gearbox contain sharp peaks with higher value, indicating sharp probability distribution) having a better accuracy of 87.18% at k=3, ‘skewness’, which describes the asymmetry in the distribution of vibration signal having an accuracy of 27.57% at k=2 as highest. It indicates that the skewness feature is unable to classify the gearbox dataset consisting of five-class classification. Further, to improve the classification accuracy, feature
combinations has considered. FC1 denotes the combination of all features considered having a
maximum accuracy of 91.00% at k=1, which is ineffective. FC2 is equal to FC1 minus skewness
feature having an accuracy of 96.64% at k=1 as highest, which is ineffective comparatively with
individual features considered. FC3 is equal to FC2 minus kurtosis feature showing the highest
classification accuracy of 99.03% at k=3, which is considered as achieved maximum successful
classification accuracy. FC4 equal to FC3 minus variance having an accuracy of 96.62% at k=1. FC5
equal to FC4 minus RMS having an accuracy of 98.95% at k=4. Therefore, it can be observed that,
with feature combination FC3 the fault classification accuracy of SVM is improved to 99.03%. Similar
case study as explained in Table 2 is carried out for planetary gearbox under 30-2 configuration and
observed that, feature combination FC3 has brought a maximum classification accuracy of 93.56% at
k=3 with 100 Monte Carlo runs. Further, to improve the fault classification accuracy, time-derivative of the original signal is carried out and similar case studies as explained in Table 2 were exercised. However, the results shown were not satisfactory for the considered gearbox dataset, assuring a maximum fault classification accuracy of 91.44% at k=5 under 20-0 configuration.
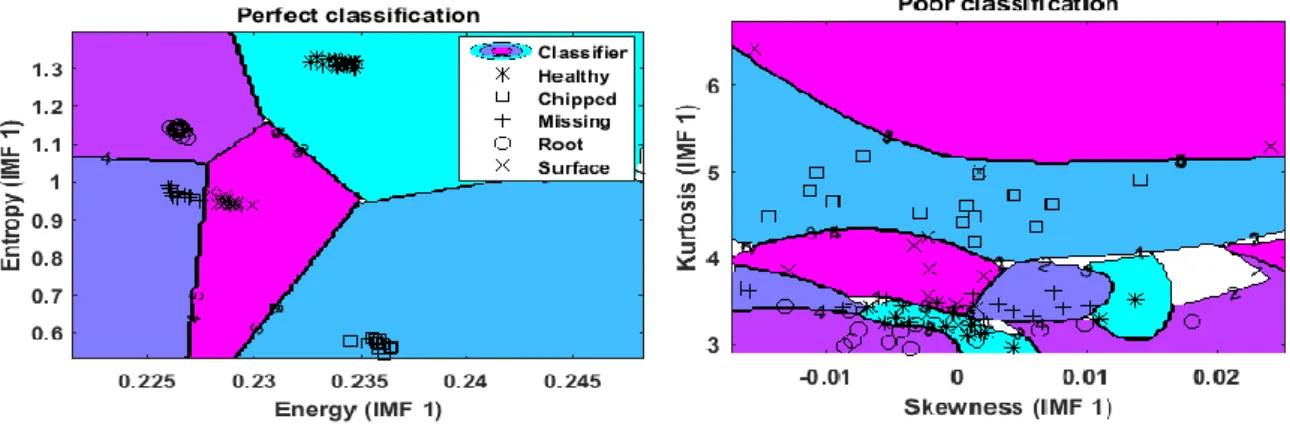
Figure 2 shows the classification plots of gearbox multi-class faults using SVM algorithm. It can be observed that, skewness and kurtosis features are ineffective in classifying the faults (poor).
Figure 3 shows the confusion matrix of the SVM fault classification accuracy under both 20-0 & 30-2 configurations. The five-class classification of known test labels (93 in total) of 20% testing set were mapped with output decision labels of SVM classifier. In confusion matrix 1 it is observed that in the missing tooth, 1-label is showing as healthy signal. In confusion matrix 2, in the root fault 3-labels are observed as a surface fault, 1-label as chipped tooth and 1-label as healthy, in the surface fault 1-label is predicted as root fault. These incorrect classification lead to a fault classification accuracy of 99.9% for 20-0 and 93.5% for 30-2 configuration (with single Monte Carlo run).
Table 2. SVM classification accuracy (%) with 100 Monte Caro runs for planetary gearbox.
Features Number of IMF’s (k)
k=1 k=2 k=3 k=4 k=5 k=6 k=7 k=10 k=12 Energy 37.52 ± 4.97 87.05 ± 3.65 89.58 ± 3.91 97.47 ± 1.59 97.40 ± 1.61 98.18 ± 1.37 97.28 ± 1.58 82.72 ± 3.69 47.49 ± 5.49 Entropy 66.98 ± 4.29 84.55 ± 4.57 97.95 ± 1.46 98.20 ± 1.35 95.31 ± 2.51 94.13 ± 2.50 89.41 ± 3.23 67.01 ± 5.37 49.47 ± 4.60 Variance 53.32 ± 4.77 65.47 ± 5.47 76.76 ± 3.46 84.44 ± 3.93 86.92 ± 4.72 91.49 ± 2.65 93.27 ± 3.25 81.37 ± 3.98 70.90 ± 4.52 RMS 53.78 ± 4.51 77.52 ± 4.52 96.67 ± 2.62 98.18 ± 1.93 97.98 ± 1.56 97.17 ± 1.51 96.56 ± 1.78 82.65 ± 3.38 68.97 ± 5.32 Kurtosis 59.69 ± 4.53 79.85 ± 4.32 87.17 ± 3.26 86.14 ± 3.67 81.98 ± 3.78 78.03 ± 4.15 72.60 ± 4.50 45.56 ± 5.04 30.34 ± 4.67 Skewness 24.26 ± 3.64 27.57 ± 4.47 25.00 ± 4.16 24.01 ± 4.23 22.88 ± 4.11 20.94 ± 3.61 19.94 ± 3.76 19.73 ± 3.54 19.44 ± 3.52 FC1 91.00 ± 3.63 83.61 ± 5.22 62.40 ± 6.56 44.14 ± 5.60 24.50 ± 4.33 21.01 ± 3.82 20.03 ± 4.09 19.96 ± 4.30 20.57 ± 3.63 FC2 96.64 ± 1.89 95.97 ± 2.67 93.04 ± 2.74 89.20 ± 3.28 80.22 ± 4.07 73.61 ± 4.70 55.41 ± 5.22 19.74 ± 3.34 19.88 ± 3.45 FC3 84.38 ± 4.07 98.65 ± 0.99 99.03 ± 0.98 98.22 ± 1.33 97.99 ± 1.18 96.89 ± 1.51 86.87 ± 3.40 23.96 ± 3.91 23.24 ± 3.96 FC4 96.62 ± 1.67 96.40 ± 2.19 93.67 ± 3.14 88.95 ± 3.12 81.82 ± 4.27 74.71 ± 4.97 59.18 ± 4.92 40.47 ± 4.15 21.25 ± 3.57 FC5 75.61 ± 4.62 98.36 ± 1.27 98.45 ± 1.14 98.95 ± 1.02 97.94 ± 1.46 97.61 ± 1.23 94.43 ± 2.37 49.30 ± 4.54 26.03 ± 4.48 Note: FC = Feature combination;
Figure 3. Confusion matrix of SVM classification accuracy for both the rotating speed and load configurations.
Experimental results are presented in Table 3. From the results, it has observed that the proposed method shows the improved fault classification accuracy compared with LFBGRU method in [2]. Even though the achieved classification accuracy is less for 30-2 configuration, it is elevated as a consistent result tested with 100 Monte Carlo runs (*).
Table 3. Classification results of the gearbox dataset.
Fault Diagnosis Method Gearbox (Rotating speed – Load configuration)
20-0 30-2
LFBGRU [2] 94.8% 95.8%
Proposed method 99.09 ± 0.98* 93.56 ± 2.33*
4. Conclusion
A new method based on EMD features and SVM classifier has been proposed to classify the heterogeneous gearbox faults. The EMD technique was implemented to decompose the segmented signal into IMF components, which contain different characteristic frequencies. The statistical features have been computed on each IMF to provide discriminative information to the classifier in the diagnosis of gearbox faults. All the feature vectors were concatenated to form a feature set and divided into training and testing set. The developed SVM model using the training set has tested using the testing set with 100 Monte Carlo runs. A comparative study has been carried out with the computed features (individually and selected feature combinations) to improve the fault classification accuracy. The result shows that the proposed method is effective in classifying the heterogeneous gearbox faults.
5. References
[1] Ilhan Asilturk ,Halit Aslanci ,Ugur Ozmen , (2017 ) " Machinery Monitoring Using Vibration Signal Analysis " , International Journal of Mechanical and Production Engineering (IJMPE) , pp.
21-25, Volume-5, Issue-2.
[2] R. Zhao, D. Wang, R. Yan, K. Mao, F. Shen and J. Wang, "Machine Health Monitoring Using Local Feature-Based Gated Recurrent Unit Networks," in IEEE Transactions on Industrial
Electronics, vol. 65, no. 2, pp. 1539-1548, Feb. 2018.
[3] Buzzoni, M., Mucchi, E., D’Elia, G., & Dalpiaz, G. (2017). “Diagnosis of Localized Faults in Multistage Gearboxes: A Vibrational Approach by Means of Automatic EMD-Based Algorithm”,
Shock and Vibration, 2017, 1–22.
[4] Shanmukha Priya, V, Mahalakshmi P & VPS Naidu, (2015). “Bearing health condition
monitoring: Wavelet decomposition”. Indian Journal of Science and Technology,
8.10.17485/ijst/2015/v8i26/81712.
[5] https://github.com/cathysiyu/Mechanical-datasets [Accessed on 20-03-2019].
[6] Junsheng, Cheng & Dejie, YU & Tang, Jiashi & Yang, Yu. (2009). Application of SVM and
SVD Technique Based on EMD to the Fault Diagnosis of the Rotating Machinery. Shock and
Vibration, 16. 89-98.
[7] Yu, Y., YuDejie, & Junsheng, C. (2006). A roller bearing fault diagnosis method based on EMD
energy entropy and ANN. Journal of Sound and Vibration, 294(1-2), 269–277.
[8] L. Guan, Y. Shao, Fengshou Gu, B. Fazenda and A. Ball, "Gearbox fault diagnosis under different operating conditions based on time synchronous average and ensemble empirical mode
decomposition," 2009 ICCAS-SICE, Fukuoka, 2009, pp. 383-388.
[9] N. E. Huang, Z. Shen, S. R. Long et al., “The empirical mode decomposition and the Hilbert spectrum for nonlinear and non-stationary time series analysis,” The Royal Society of London.
Proceedings. Series A. Mathematical, Physical and Engineering Sciences, vol. 454, no. 1971, pp.
903–995, 1998.
[10] Klionski, D. M., Oreshko, N. I., Geppener, V. V., & Vasiljev, A. V. (2008). “Applications of empirical mode decomposition for processing nonstationary signals”, Pattern Recognition and
Image Analysis, 18(3), 390–399.
[11] Caesarendra, Wahyu & Tjahjowidodo, Tegoeh. (2017). A Review of Feature Extraction Methods in Vibration-Based Condition Monitoring and Its Application for Degradation Trend Estimation