R E S E A R C H
Open Access
The potential role of cost-utility analysis in
the decision to implement major system
change in acute stroke services in
metropolitan areas in England
Rachael M. Hunter
1*, Naomi J. Fulop
2, Ruth J. Boaden
3, Christopher McKevitt
4, Catherine Perry
3,
Angus I. G. Ramsay
2, Anthony G. Rudd
4,5, Simon J. Turner
6, Pippa J. Tyrrell
3, Charles D. A. Wolfe
4and Stephen Morris
2Abstract
Background:The economic implications of major system change are an important component of the decision to implement health service reconfigurations. Little is known about how best to report the results of economic evaluations of major system change to inform decision-makers. Reconfiguration of acute stroke care in two metropolitan areas in England, namely London and Greater Manchester (GM), was used to analyse the economic implications of two different implementation strategies for major system change.
Methods:A decision analytic model was used to calculate difference-in-differences in costs and outcomes before and after the implementation of two major system change strategies in stroke care in London and GM. Values in the model were based on patient level data from Hospital Episode Statistics, linked mortality data from the Office of National Statistics and data from two national stroke audits. Results were presented as net monetary benefit (NMB) and using Programme Budgeting and Marginal Analysis (PBMA) to assess the costs and benefits of a hypothetical typical region in England with approximately 4000 strokes a year.
Results:In London, after 90 days, there were nine fewer deaths per 1000 patients compared to the rest of England (95% CI–24 to 6) at an additional cost of £770,027 per 1000 stroke patients admitted. There were two additional deaths (95% CI–19 to 23) in GM, with a total costs saving of £156,118 per 1000 patients compared to the rest of England. At a £30,000 willingness to pay the NMB was higher in London and GM than the rest of England over the same time period. The results of the PBMA suggest that a GM style reconfiguration could result in a total greater health benefit to a region. Implementation costs were £136 per patient in London and £75 in GM.
Conclusions:The implementation of major system change in acute stroke care may result in a net health benefit to a region, even one functioning within a fixed budget. The choice of what model of stroke reconfiguration to implement may depend on the relative importance of clinical versus cost outcomes.
Keywords:economic evaluation, stroke, major system change, implementation, cost-effectiveness, programme budgeting and marginal analysis
* Correspondence:[email protected]
1Research Department of Primary Care and Population Health, Royal Free
Medical School, University College London, Royal Free Campus, Rowland Hill Street, London NW3 2PF, United Kingdom
Full list of author information is available at the end of the article
Background
Major system change involves the reorganisation, some-times called reconfiguration, of services at a regional level. Hospital centralisation is a form of major system change where services are reorganised so that a reduced number of hospitals provide specialist clinical care. A common service reconfiguration is a hub and spoke model, where healthcare services provided in specialised hubs are complemented by a number of smaller services providing less specialist, complex or intensive care.
In 2010, a major system change of acute stroke services was implemented in two metropolitan areas in the English National Health Service (NHS), London (population 8.17 million) [1] and Greater Manchester (GM) (population 2.68 million) [1] with the aim of improving access to high quality specialist stroke care and thereby improve patient outcomes. In London, post reconfiguration, all patients identified as potentially having a stroke were taken by am-bulance to one of eight hospitals with a designated hyper-acute stroke unit (HASU), a ward that provides intensive, dedicated stroke care from a specialist multi-disciplined team. Patients remained on the HASU for 72 hours before either being discharged or moved to one of 24 stroke units [2–6] that provide ongoing care and rehabilitation. In GM, a similar model was implemented with the exception that patients with suspected strokes were transferred to a hyper-acute centre only if the onset time was within the previous 4 hours.
The centralisations have been associated with a 1.1% reduction of stroke-related deaths at 90 days in London, or 168 fewer deaths 21 months after the centralisation, as well as a reduction in bed days of 1.4 days per patient in London and 2.8 bed days per patient in Manchester compared to the rest of England [4].
The centralisation of acute stroke care in GM and London provides an opportunity to explore the implica-tions for decision-makers of two different ways of reporting the results of an economic evaluation of major system change, in particular contrasting ways of repor-ting quality adjusted life years (QALYs) versus costs.
Economic evaluations and the decision to implement major system change
Economic evaluations of the implementation of major system change and policy initiatives are rare, with no specific framework-guiding analysis methods [7].
The decision to implement new interventions in publicly financed healthcare systems that operate within a fixed budget, as is the case with the NHS, can sometimes result in a need to weigh up clinical effectiveness and cost. An intervention shown to be clinically effective may cost significantly more than current practice. If the new, more expensive intervention is to be implemented, a decision may need to be made if (1) the healthcare service will now
treat fewer patients as the cost per patient has now in-creased, or (2) funds need to be taken from another
ser-vice to finance the cost of the new treatment.
Alternatively, the new service and its clinical effectiveness may result in cost savings produced elsewhere and hence the total cost per patient is reduced.
To help payers and policy-makers decide whether they should implement a new technology or service there are a number of types of economic analysis that can be under-taken. Within the English NHS the most common type of economic analysis for evaluating if a new technology should be implemented is to report the incremental cost per QALY gained of current or best practice compared to a new technology. QALYs are the preferred unit of reporting effectiveness of the National Institute for Health and Care Excellence (NICE), the NHS government body responsible for evaluating new technologies and recommending their implementation, given that QALYs are a combination of both mortality and morbidity over time weighted for the general public preferences for health outcomes [8]. If the incremental cost to the NHS of a QALY gained as a result of the new technology is less than £20,000 per QALY, in 87% of cases, NICE will recommend that the new techno-logy is made available to patients in the NHS [9]. However, the use of the £20,000 threshold has been criticised given that the cost to produce an additional QALY in the NHS is £12,936. As a result, approval of new technologies using a threshold higher than £12,936 risks displacing technologies where the cost to produce an additional QALY is less and hence more efficient [9].
An alternative approach for evaluating the impact of implementing new technologies or services is Programme Budgeting and Marginal Analysis (PBMA). PBMA com-pares the additional benefit achieved per pound spent on a technology or service, A, compared to another service or technology, B, where B may be current practice or even an alternative healthcare service. The benefit of PBMA is that it facilitates the evaluation of benefit of A compared to B across programmes of work and within a fixed budget [10].
The aim of this paper is to report the economic impli-cations of the reconfiguration in London and GM compared to metropolitan areas in the rest of England. The information will be reported in a way to aid with the decision to implement different reconfigurations of acute stroke care using different types of analysis (1) reporting the incremental cost per QALY gained as recommended by NICE and (2) using a hypothetical region with a fixed budget and PBMA.
Methods
Overview
and GM on costs, mortality and QALYs compared to metropolitan areas in the rest of England. Metropolitan areas were chosen so that population density and blue light ambulance travel time to hospital were as compar-able as possible with London and GM. The analysis was undertaken with a cost perspective of the English NHS and personal social services. Eight decision analytic models were developed, each with 1000 hypothetical stroke patients. The time periods were as in Morris et al. [4] as described below.
(1). London before the reconfiguration (January 2008 to January 2010)
(2). London after the reconfiguration (July 2010 to March 2012)
(3). The rest of England (Metropolitan only), excluding GM for the same time period as (1) (4). The rest of England (Metropolitan only),
excluding GM for the same time period as (2) (5). GM before the reconfiguration (January 2008 to
November 2008)
(6). GM after the reconfiguration (April 2010 to March 2012)
(7). The rest of England (Metropolitan only), excluding London for the same time period as (5) (8). The rest of England (Metropolitan only),
excluding London for the same time period as (6)
Total costs and QALYs per 1000 patients were calcu-lated for each of the eight models at 90 days and 10 years after admission, using a discount rate of 3.5% for costs and QALYs [8]. Costs are for the year 2013/2014 and are in British Pounds (£). We report the difference in costs and QALYs for (1) and (2) compared to (3) and (4), and the difference in costs and QALYs for (5) and (6) compared to (7) and (8).
Data
We used routinely collected hospital data (Hospital Episode Statistics (HES)), audit data (National Senti-nel Stroke Clinical Audit 2008, Stroke Improvement National Audit Programme (SINAP)) and data from the published literature to construct the model.
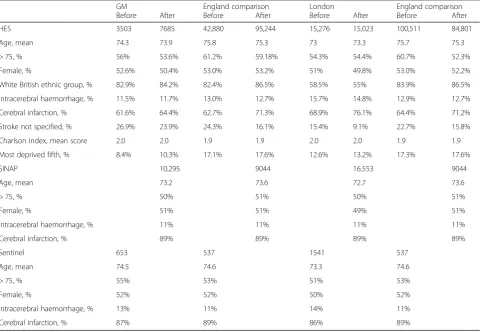
Table 1 provides details on the number of stroke
patients in each dataset.
Table 1Data sources and numbers
GM England comparison London England comparison
Before After Before After Before After Before After
HES 3503 7685 42,880 95,244 15,276 15,023 100,511 84,801
Age, mean 74.3 73.9 75.8 75.3 73 73.3 75.7 75.3
> 75, % 56% 53.6% 61.2% 59.18% 54.3% 54.4% 60.7% 52.3%
Female, % 52.6% 50.4% 53.0% 53.2% 51% 49.8% 53.0% 52.2%
White British ethnic group, % 82.9% 84.2% 82.4% 86.5% 58.5% 55% 83.9% 86.5%
Intracerebral haemorrhage, % 11.5% 11.7% 13.0% 12.7% 15.7% 14.8% 12.9% 12.7%
Cerebral infarction, % 61.6% 64.4% 62.7% 71.3% 68.9% 76.1% 64.4% 71.2%
Stroke not specified, % 26.9% 23.9% 24.3% 16.1% 15.4% 9.1% 22.7% 15.8%
Charlson index, mean score 2.0 2.0 1.9 1.9 2.0 2.0 1.9 1.9
Most deprived fifth, % 8.4% 10.3% 17.1% 17.6% 12.6% 13.2% 17.3% 17.6%
SINAP 10,295 9044 16,553 9044
Age, mean 73.2 73.6 72.7 73.6
> 75, % 50% 51% 50% 51%
Female, % 51% 51% 49% 51%
Intracerebral haemorrhage, % 11% 11% 11% 11%
Cerebral infarction, % 89% 89% 89% 89%
Sentinel 653 537 1541 537
Age, mean 74.5 74.6 73.3 74.6
> 75, % 55% 53% 51% 53%
Female, % 52% 52% 50% 52%
Intracerebral haemorrhage, % 13% 11% 14% 11%
Cerebral infarction, % 87% 89% 86% 89%
The HES data only contained patients with a primary diagnosis of stroke, as defined by ICD-10 codes I61 (in-tracerebral haemorrhage), I63 (cerebral infarction) and I64 (stroke, not specified as haemorrhage or infarction), and from metropolitan areas using the urban/rural clas-sification for England [11]. It is linked to data from the Office of National Statistics vital statistics to obtain date of death [12].
Sentinel was a national biennial audit that collected data on the first 60 strokes across participating hospitals for the period April to August each year. Data from the 2008 Sentinel audit were used [13]. SINAP was a national audit of stroke care across participating acute hospitals in England providing data from all identified patients in participating hospitals from July 2010 to 2012 [14].
The South London Stroke Register (SLSR), a
population-based stroke prospective registry recording all first-ever strokes in patients of all ages living in an area of South London [15], was used to calculate changes in disability before and after the reconfigurations.
Further details on the datasets used can be found in Morris et al. [4] for HES data, Ramsay et al. [5] for Sentinel and SINAP, and Hunter et al. [3] for SLSR. Data were analysed using STATA 13.
Model structure
Each of the eight models has two components:
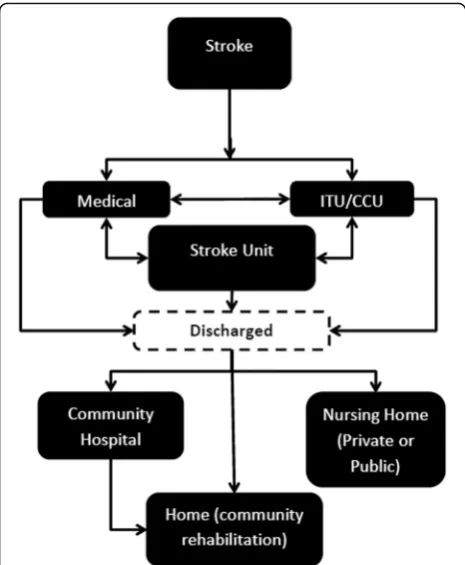
(1).A 90-day discrete event simulation of daily acute hospital ward movements, discharge destinations and mortality using data from HES, Sentinel and SINAP (Fig.1).
(2).A 10-year Markov model [16] with 90-day cycles using information from the 90-day model plus HES, the SLSR and published data to calculate costs and QALYs (Additional file1: Figure S1).
All patients enter the 90-day model as an admission to hospital following a stroke. The proportion of patients in each health state in the first cycle of the 10-year model is determined by the final destination of patients in the 90-day model, including still on an acute hospital ward. The day discrete event simulation is also used for 90-day costs and outcomes of hospitalisation following recurrent strokes in the 10-year Markov model.
The flow for the 90-day model is illustrated in Fig. 2, excluding the state of death–patients have a probability of death every day of the 90-day model regardless of where they are in the model. The same flow is used for all eight models and is different to the stylised diagrams in Fig.1. This is because, following the reconfigurations, despite the fact that patients should only have been ad-mitted to a HASU in London and to a HASU if the stroke had occurred within 4 hours prior to admission and a District Stroke Centre if it had occurred more than 4 hours prior in GM, data from SINAP show only whether the first ward of admission was a stroke unit or not and do not provide information on the specific type of stroke unit [5].
The model was developed in Microsoft Excel 2010.
Mortality
Mortality at 72 hours, 30 days and 90 days was calculated using the same data and a similar method to Morris et al.
[2], including coefficients to adjust for differences between regions in age, sex, ethnicity, deprivation (index of mul-tiple deprivation quintile) [17], and co-morbidities using the Charlson index [18]. Random effects for provider were also applied to the model. Two logistic regression models were fitted to the HES data; one for London and the rest of England excluding GM and one for GM and the rest of England excluding London. Values for the models are re-ported in Additional file1: Table S1 and further details for the calculation of transition probabilities are provided in Additional file1: Methods S1.
Length of stay (LOS) and discharge destination
HES data were used to calculate the daily probability of discharge from acute hospital and discharge destination using a parametric survival model and Weibull distribu-tion [16]. Two analyses, London (analyses 1 to 4 in over-view) and GM (analyses 5 to 8 in overover-view), were run with the same adjustments as the mortality models (Additional file1: Table S3). We assumed the probability of discharge was the same regardless of ward type as there is no infor-mation in HES on ward-specific LOS.
The method for calculating ward movements and discharge destination is provided in Additional file 1: Methods S2 and Tables S4 and S5.
10-year model
The model is described in Additional file1: Figure S1 and model inputs in Additional file1: Table S4. The possible states in the 10-year model are (1) home and in one of five health states based on the Barthel index, a measure of functional independence, where 0 is no functioning and 20 is fully functional (0–4, 5–9, 10–14, 15–19 and 20); (2) residential care or nursing home; (3) recurrent stroke and in hospital < 90 days; (4) recurrent stroke and in hospital > 90 days; and (4) dead.
The probability of patients discharged to community hospital or home being admitted to residential care or nursing home was taken from SLSR (Additional file 1: Table S4).
The probability that patients had a recurrent stroke following discharge was calculated using HES data and parametric survival analysis. A Weibull model [16] was used to give differential probabilities over time with prob-abilities calculated for 90-day cycles. Models were adjusted using the same methodology as above and were calculated for GM versus the rest of urban England, excluding London, and London compared to the rest of urban England excluding GM (Additional file1: Table S4).
The probability of recurrent stroke for patients discharged in residential care or a nursing home was calculated from HES for patients discharged to resi-dential care only.
The 10-year model takes into account the health and well-being of patients discharged from acute care using the Barthel index, with patients divided into the five Barthel states given above. The proportion of patients in each Barthel state and movement between them has been taken from the SLSR with different rates before and after (Additional file 1: Table S4). No data are available for Barthel indexes or any other measure of functioning or quality of life for GM or the rest of England before the reconfiguration. As a result, it is not possible to evaluate the impact of the reconfigurations on functioning or quality of life in GM or compare the changes that occurred in London with what happened over the same period in the rest of England. For the pur-pose of the model and calculating QALYs, the conserva-tive assumption was made that the same improvements were seen in GM, the rest of England and London as were seen in the SLSR.
Probability of dying while in a care home was updated to Gordon et al. [19] as the most recent estimate available in the literature.
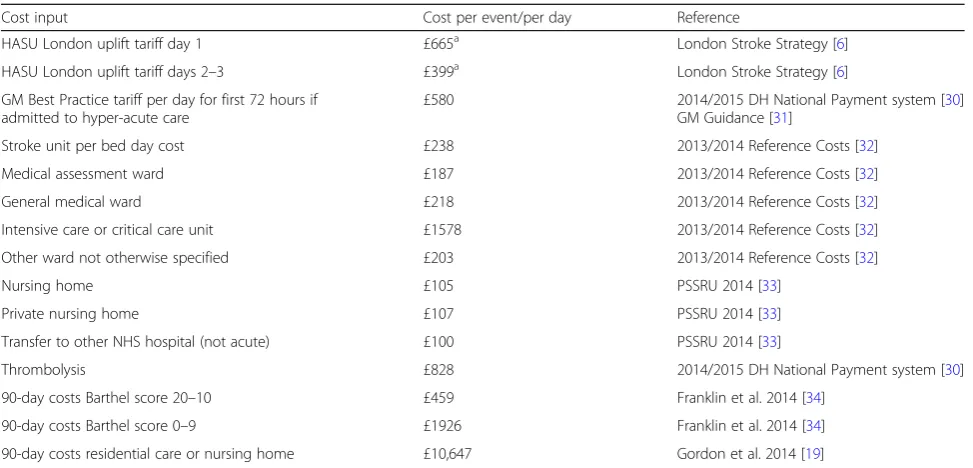
Unit costs
Details of unit costs are given in Table 2. The cost of transfer has not been included as transfer costs were included in the additional cost of the HASU [6].
Fig. 2The 90-day discrete event simulation model structure.ITU
Costs of implementation
We undertook reviews of documentary evidence to iden-tify the costs of implementing the reconfigurations in London and GM, including one-off financial investments to improve services, research to investigate the optimal
configuration of services, and public and staff
consultations.
QALYs
QALYs were calculated using Barthel index from the SLSR and the methods described in Hunter et al. [3]. Utility scores were applied to each ward and discharge location and calculated as a daily rate for the 90-day model and each location for the 10-year model and calculated as a 90-day rate. Details on utility scores are provided in Additional file1: Table S5.
Cost-utility analysis
A difference-in-differences approach was used to com-pare cost and mortality at 90 days and costs and QALYs at 10 years; we compared costs, mortality and QALYs in London before and after the reconfiguration outcomes and costs over the same period in the rest of England (excluding GM). The same analysis was then conducted for GM (excluding London). Mortality and LOS was ad-justed for differences between London, GM and the rest of England in age, sex, co-morbidities (Charlson Index [18]), stroke type and level of deprivation [17].
Net monetary benefit (NMB) is defined as total QALYs multiplied by a willingness to pay (WTP) for a QALY minus costs. Incremental NMB is calculated for London
before the changes compared to after (models 1 and 2) and England, excluding GM, for the same time periods (models 3 and 4) for a range of values of WTP for a QALY gained (£0 to £100,000). If the incremental NMB was higher for London than the rest of England the London reconfiguration was then considered to be cost-effective. The same was performed for GM.
PBMA
The budget for delivering acute stroke care in the hypo-thetical example was set at £40 million pounds per year, equating to the approximate amount required to treat 4000 strokes a year, close to the average number of admissions to acute hospital with a diagnosis per year in a region of approximately 3 million inhabitants in England [20]. Using the goal seek command in Excel, we calculated the number of patients with stroke treated in 1 year and total QALYs at 1, 5 and 10 years if a region has a fixed budget of £40 million per year. This was cal-culated before and after reconfiguration and differences between reconfigured areas and the rest of metropolitan England were compared. The cost per patient of imple-mentation was included in the analysis.
Probabilistic sensitivity analysis
Probabilities were applied to the model using the me-thodology given in Briggs et al. [16]. For costs, a gamma distribution was used with 25% variation around the mean. A total of 5000 iterations of the eight models were run and costs, mortality and QALYs over 10 years and 90 days were captured. The percentage of iterations Table 2Cost inputs for 90-day and 10-year model
Cost input Cost per event/per day Reference
HASU London uplift tariff day 1 £665a London Stroke Strategy [6]
HASU London uplift tariff days 2–3 £399a London Stroke Strategy [6]
GM Best Practice tariff per day for first 72 hours if admitted to hyper-acute care
£580 2014/2015 DH National Payment system [30]
GM Guidance [31]
Stroke unit per bed day cost £238 2013/2014 Reference Costs [32]
Medical assessment ward £187 2013/2014 Reference Costs [32]
General medical ward £218 2013/2014 Reference Costs [32]
Intensive care or critical care unit £1578 2013/2014 Reference Costs [32]
Other ward not otherwise specified £203 2013/2014 Reference Costs [32]
Nursing home £105 PSSRU 2014 [33]
Private nursing home £107 PSSRU 2014 [33]
Transfer to other NHS hospital (not acute) £100 PSSRU 2014 [33]
Thrombolysis £828 2014/2015 DH National Payment system [30]
90-day costs Barthel score 20–10 £459 Franklin et al. 2014 [34]
90-day costs Barthel score 0–9 £1926 Franklin et al. 2014 [34]
90-day costs residential care or nursing home £10,647 Gordon et al. 2014 [19]
a
Converted to 2013/2014 prices using Hospital and Community Health Services inflation index [33]
where London or GM had a higher NMB than the rest of England for a specific WTP for a QALY gained were recorded and shown on a cost-effectiveness acceptability curve. Additionally, 95% confidence intervals were calcu-lated using the standard deviation of the 5000 iterations of the model.
Other sensitivity analyses
To test assumptions made in the model, five sensitivity analyses were conducted. Details of the sensitivity ana-lyses conducted are reported in Additional file 1: Methods S1.
Results
Base case
At 90 days, London had a reduced risk of mortality com-pared to the rest of England before versus after the recon-figuration. Per 1000 strokes, the adjusted number of deaths in London at 90 days was 100 before the reconfig-uration and 75 after, thus a reduction of 2.7 percentage points in the number of deaths. During the same period in England there was an adjusted reduction in deaths of 1.8 percentage points (114 deaths before compared to 97 deaths after) (Table3). This represents a relative reduction in deaths in London compared to the rest of England of 0.9% or 9 deaths per 1000 patients. In 90% of iterations of the model, London had a greater reduction in deaths after the reconfigurations than the rest of England. Compared to the rest of England, there was no reduction in deaths in GM at 90 days. Both areas had a reduction in LOS relative to the rest of England, namely of 2 days less in GM and 0.6 days less in London.
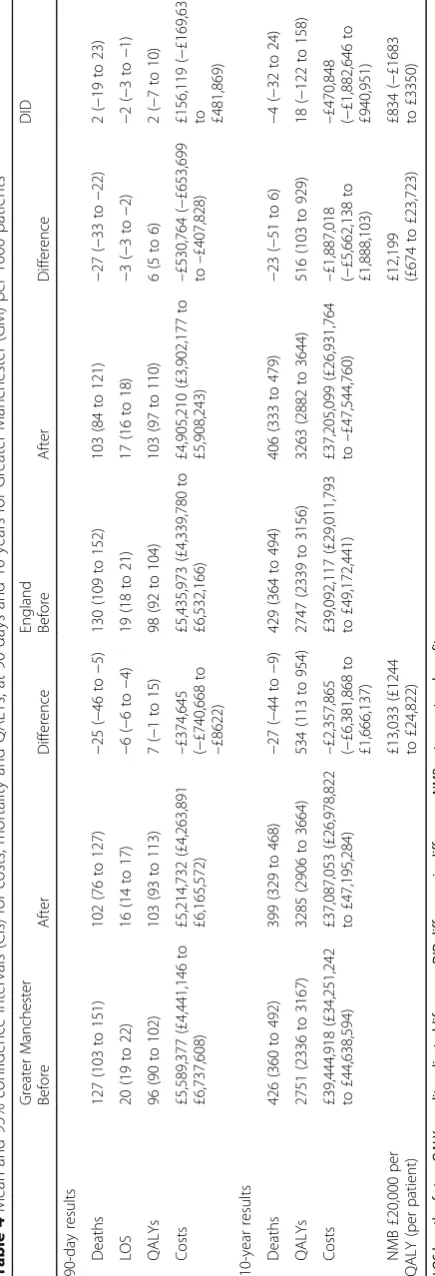
At 10 years, both reconfigurations resulted in more QALYs compared to their Rest of England comparator (Table 4). London resulted in 58 more QALYs at 10 years per 1000 patients at an additional cost of £1,014,363. This is equivalent to an incremental cost effectiveness ratio of £17,452; hence, at a WTP for a QALY gained of £20,000, the changes in London have a higher NMB than the rest of England over the same time period. However, the incremental cost effectiveness ratio is greater than the average cost to produce a QALY in the NHS of £12,936, suggesting that some displace-ment of services and a net QALY loss may have occurred. At 10 years, the reconfigurations that occurred in GM dominate what happened in England over the same time period in that there are more QALYs (18 QALYs per 1000 patients over 10 years compared to the rest of England) and less costs (−£470,848 per 1000 patients compared to the rest of England over 10 years).
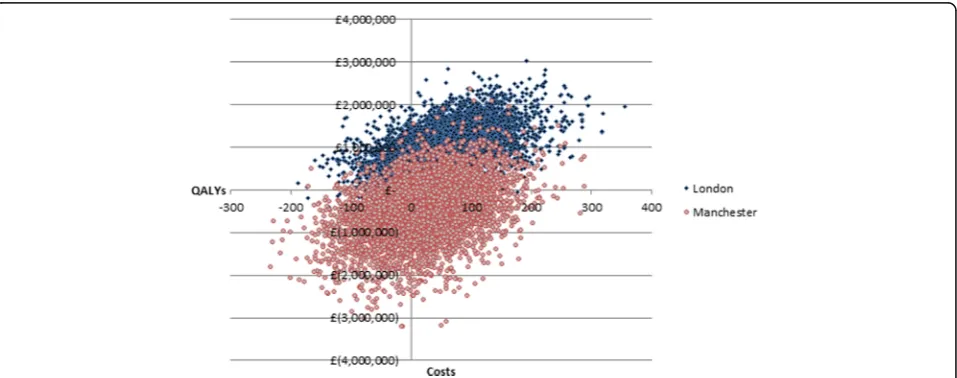
Cost-effectiveness acceptability curve
The probability that the changes that occurred in GM as a result of the reconfigurations had a higher NMB than
what occurred in England over the same time period peaked at a WTP for a QALY gained of £7000 and 82% probability (Fig.3). GM had a higher probability of being cost-effective than London at a WTP for a QALY gained of values less than £39,000. GM had a higher probability of being cost-effective at lower values of WTP for a QALY as 35% of iterations of the difference in costs and QALYs in GM compared to England over the same time period fell in the south-west quadrant of the cost-effectiveness plane (Fig.4); thus, the changes in GM cost less than in the rest of England but there was only a 60% chance that there was also a reduction in mortality com-pared to the rest of England. For London, the majority of iterations of the model (80%) fell in the north-east quadrant for London, where London cost more but also had a higher probability that there was an improvement in mortality (81%).
Sensitivity analyses
The results of the sensitivity analyses are reported in Additional file1: Tables S6 and S7. None of the sensitiv-ity analyses changed the conclusions drawn as a result of the analysis, other than the observation that, once the cost of a HASU increased by 50% per night, the London reconfigurations were no longer cost-effective at a WTP of £20,000 per QALY. If it was assumed that improve-ments in functioning (Barthel index) only occurred in London and GM as a result of the reconfiguration but not in the rest of England, there was a 97% chance in both London and GM that the reconfigurations be cost-effective at 10 years at a WTP of £20,000 for a QALY (Additional file1: Figure S2).
Costs of implementation
Table 4 Mean and 95% confidence intervals (CIs) for costs, mortality and QALYs, at 90 days and 10 years for Greater Manchester (GM) per 1000 patients Greater Manche ster Eng land D ID Befor e After D ifference Befor e After Differen ce 90-day resul ts Death s 127 (103 to 15 1) 102 (76 to 127) − 25 ( − 46 to − 5) 130 (109 to 152) 103 (84 to 121) − 27 ( − 33 to − 22) 2 ( − 19 to 23) LOS 20 (19 to 22) 16 (14 to 17) − 6( − 6t o − 4) 19 (18 to 21 ) 17 (16 to 18 ) − 3( − 3t o − 2) − 2( − 3t o − 1) QALY s 96 (90 to 102) 103 (93 to 113) 7 ( − 1 to 15) 98 (92 to 10 4) 103 (97 to 110) 6 (5 to 6) 2 ( − 7t o1 0 ) Cost s £5,589, 377 (£4,4 41,146 to £6,737, 608) £5,214, 732 (£4,2 63,891 £6,165, 572) – £374 ,645 ( − £7 40,668 to – £862 2) £5,435, 973 (£4, 339,780 to £6,532, 166) £4,905, 210 (£3,9 02,177 to £5,908, 243) – £530 ,764 ( − £653,69 9 to – £407,82 8) £1 56,119 ( − £169,63 2
to £481,869)
GM was £75 per patient admitted. Other costs are likely to have been incurred in both London and GM to pay for research to identify the optimal configuration of ser-vices, and to consult staff and public, but evidence of these costs is not available.
QALY production for a fixed budget of £40 million
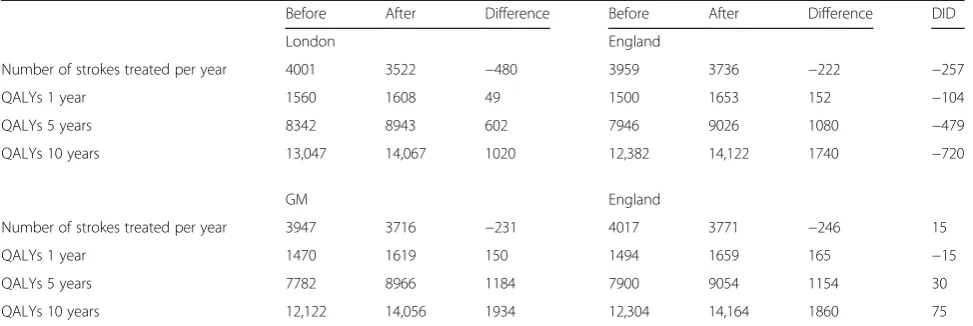
The results of the analysis comparing total strokes treated and total QALYs at 1, 5 and 10 years for a fixed yearly budget of £40 million are reported in Table5. We estimated 75 additional QALYs over 10 years as the result of the centralisation of GM acute stroke care compared to changes that occurred in the rest of England for the same time period for a fixed yearly budget of £40 million. Centralisation of London services
may have resulted in a net loss of 720 QALYs over 10 years. The lower number of estimated QALYs is a result of a lower volume of patients that may be treated for the fixed budget.
Discussion
The implementation of major system change in both London and GM models resulted in a NMB compared to changes that occurred over the same time period elsewhere in England at 10 years at a threshold of £20,000–£30,000 for a QALY. The GM model was cost saving at 10 years, but did not result in the same health benefits as the London model; hence, for higher values of WTP for a QALY, London had a higher probability of being cost-effective.
Fig. 4Difference-in-difference cost-effectiveness plane of the adjusted difference in 10-year costs and QALYs between London before and after reconfigurations minus the difference in England over the same time period, and the difference in costs and QALYs in GM compared to England over the same time period
If the value for money of the centralisation of acute care is tested in the context of PBMA using a finite budget of £40 million per year (approximate budget required for 4000 stroke admissions per year) and choosing the model that produces the largest number of QALYs, the GM model may be preferred based on the QALYs produced at 5 and 10 years. Over time, the cost of treating strokes in metropolitan areas in England has increased everywhere, but clinical outcomes have also improved. As a result, even though fewer people can be treated for a stroke within the same budget envelope, the resulting total QALYs (health benefits) may still be greater.
Reporting the results of economic evaluations to decision-makers
The aim of this study was to present the results of the cost-utility analysis in two contrasting ways, namely (1) as cost per QALY in line with NICE recommendations and (2) as a PBMA to reflect a potential real-world scenario. Within the English NHS, decision-making based on economic evaluations predominately occurs as part of NICE technology assessments and guidelines [23]. As a result, most cost-effectiveness analyses are conducted using the NICE reference case as their tem-plate for their methodology and reporting with little consideration given to whether this is helpful to decision-makers at regional and local levels [23]. Previous research has identified that improved clinical outcomes play a key role in the decision to implement change [23, 24]. Clinicians in particular prefer that clinical effectiveness is given more weight, arguing for the needs of the patients [25]. Both the results of the NMB and the PBMA would recommend that regions implement the GM model for acute stroke care reconfi-guration. However, the fact that GM changed aspects of its delivery of stroke care following evidence of its lack of clinical impact is a reflection of the important role
that clinical outcomes play. Indeed, this analysis is only one component of a wider piece of work looking at how service reconfiguration comes about in acute stroke ser-vices, with a key emphasis on clinical and organisational outcomes [2,4,5,24].
When costs are considered at local and regional levels, these tend to relate to identifying additional resources for staffing and the costs of new equipment. Potential disinvestments in other services are rarely considered. Where value for money is mentioned, it is more commonly used to refer to cost-savings, and not the cost per outcome gained more commonly presented in economic evaluations [23]. Regardless of the potential benefits of centralisation of services one of the greatest challenges for commissioners is identifying funding for the initial upfront cost of reconfiguring services. How-ever, previous evaluations of major system change have failed to address the economic implications of different implementation strategies [7,24,26]. As reported in our other work [24,27], this may be one of the greatest bar-riers to major system changes. To help decision-makers, we have provided as much information as possible on the potential costs of implementation. However, more work is required to identify to what extent these represent additional resource requirements in regards to additional staffing and equipment.
A systematic review of economic evaluations of centralisation of specialist services identified that most economic evaluations lack information that is sufficiently detailed and transparent to be useful to decision-makers [7]. As part of our work, we con-sulted with decision-makers responsible for decisions about stroke service reconfiguration, including having them as members on steering groups, as part of our qualitative work, informal interviews and
corres-pondence [2]. This was done to ensure that we
present information that is useful to decision-makers Table 5Total number of strokes treated and total QALYs for a fixed yearly budget of £40 million
Before After Difference Before After Difference DID
London England
Number of strokes treated per year 4001 3522 −480 3959 3736 −222 −257
QALYs 1 year 1560 1608 49 1500 1653 152 −104
QALYs 5 years 8342 8943 602 7946 9026 1080 −479
QALYs 10 years 13,047 14,067 1020 12,382 14,122 1740 −720
GM England
Number of strokes treated per year 3947 3716 −231 4017 3771 −246 15
QALYs 1 year 1470 1619 150 1494 1659 165 −15
QALYs 5 years 7782 8966 1184 7900 9054 1154 30
QALYs 10 years 12,122 14,056 1934 12,304 14,164 1860 75
and has been a driver in our decision to report the results as a PBMA. Reporting results over different time horizons and for a range of outcomes, not just QALYs, has also been recommended when reporting results for decision-makers [7, 28]. Previous research has suggested that decision-makers rarely use QALYs, preferring hard clinical outcomes instead as they find them easier to understand [23, 28]. However, we have chosen to keep with QALYs given these can capture both mortality and morbidity – an important consi-deration in stroke care, which aims to improve func-tioning in addition to extending life. Nevertheless, we have continued to report mortality and LOS alongside QALYs given that decision-makers find these out-comes easier to understand than QALYs and consider them important outcomes in stroke care.
Another important consideration for reporting the results is their generalisability and clear communica-tion of limitacommunica-tions [7, 23]. We have tried to make the results generalisable by adjusting for key factors that are likely to differ across regions in our analysis, for example, age and type of stroke. As part of the PBMA, we chose a population size that is representa-tive of the average metropolitan area in England. However, the analysis is based on major system change in two metropolitan areas. A key limitation of this analysis is that the results are not applicable to rural areas, which may face different challenges in the centralisation of acute stroke services. In particular, rural areas will need to address the issue of greater travel times as a result of reconfiguration and may re-quire different solutions to address these, for example, telemedicine, with different costs to consider in bringing about these changes [4].
Strengths and weaknesses
The key strength of this analysis is that it provides information to policy-makers about the real-world implications of the changes made and hence can in-form policy decisions about major system changes in the future. It contains information on the upfront costs of implementation, as well as ongoing costs, and presents the results both in regards to clinical effectiveness, but also using PBMA and within the context of a fixed budget.
A key weakness is that the results are based on observational, routinely collected hospital data; most notable are coding errors. For example, in one London hospital, 3% of 1300 stroke patients had a discharge destination code for discharge to a mental health hospital, compared to 0.13% for hospitals across all of England. It is unlikely that such a large percentage of patients were being discharged to this location; instead, it is more likely that the wrong code had been used and
they were being discharged elsewhere. There is no way to know where and hence the only option was to re-move the data prior to estimating discharge destination. It is likely the dataset contains other errors in relation to discharge destination. However, it was assumed that those errors would occur equally at random across the three regions. It is also hard to know how ‘stroke mimics’, patients presenting with the stroke-like symp-toms but who do not have a final diagnosis of stroke, appear in the data. They may be screened out of the datasets as not having stroke even though they have a stroke unit admission, or potentially the final diagnosis is missing from our dataset. It is hard to know from the data we have what proportion are mimics and what im-pact they have had on the cost and outcomes for the care pathway.
The retrospective nature of the study also meant that limited information was available on the true cost of implementation. Although data could be obtained from reports and interviews with stakeholders, some of the knowledge of the true cost of implementation would have been lost. This knowledge and the importance of collecting in-depth data on the cost of implementation has assisted with the design of other studies [29].
It is important to note that the values reported in the model for LOS and mortality are values adjusted for differences between patients within the regions with regards to age, ethnicity, sex and co-morbidities. As a result, they do not represent true values per 1000 or 4000 patients but adjusted values to allow for comparison between areas over the same period of time. One of the key weaknesses in the model is that South London is the only area where data were avail-able on what impact the changes had on functioning using the Barthel index. Instead, we had to make the conservative estimate that the same improvement in functioning was seen throughout the whole country over the same time period. If we assume that instead the improvements are the direct result of the reconfi-gurations, the sensitivity analysis showed that the London and GM models have a significantly higher probability of being cost-effective.
Conclusions
Economic factors are a significant determinant in the decision to implement major system change [27], but the results of economic evaluations of centralisation are rarely reported in a way that is helpful to decision-makers [7]. How the results of economic evaluations are reported may have a significant impact on the decision to implement change and how a service should be reconfigured. Although a centralised model of stroke care across an entire metropolitan area has a high prob-ability of being a cost-effective way to improve outcomes for stroke patients at the threshold of £30,000 per QALY, what this model of stroke care should look like is dependent on the priorities of a decision-maker. If the aim of the payer is to maximise clinical outcomes with no consideration of budget, then the London model may be the preferable one. In the context of fixed health bud-gets, there is the potential that the additional cost of centralisation may displace benefits of other services that potentially produce more QALYs for a lower cost. In the case of GM, it may be that the reconfigurations resulted in a net health benefit to the health economy as a result of the reduced cost per stroke even though they did not result in additional clinical improvements.
Additional file
Additional file 1: Supporting figures, tables and methods for acute stroke cost-utility analysis. (DOCX 81 kb)
Abbreviations
GM:Greater Manchester; HASU: hyper-acute stroke unit; HES: Hospital
Episode Statistics; ITU: intensive therapy unit; LOS: length of stay; NHS: National Health Service; NICE: National Institute for Health and Care Excellence; NMB: net monetary benefit; PBMA: programme budgeting and marginal analysis; QALY: quality adjusted life years; SINAP: Stroke Improvement National Audit Programme; SLSR: South London Stroke Register; WTP: willingness to pay
Acknowledgements Not applicable.
Funding
This paper presents independent research commissioned by the National Institute for Health Research (NIHR) Health Services and Delivery Research Programme, funded by the Department of Health (study reference 10/1009/ 09). SJT, SM and NJF were partly supported by the NIHR Collaboration for Leadership in Applied Health Research and Care (CLAHRC) North Thames at
Bart’s Health NHS Trust. CDAW is funded/supported by the NIHR
Collaboration for Leadership in Applied Health Research and Care South
London at King’s College Hospital NHS Foundation Trust and NIHR
Biomedical Research Centre based at Guy’s and St Thomas’NHS Foundation
Trust and King’s College London. The views expressed are those of the
authors and not necessarily those of the NHS, the NIHR or the Department of Health.
Availability of data and materials
The data that support the findings of this study are available from NHS Digital but restrictions apply to the availability of these data, which were used under license for the current study, and so are not publicly available. A copy of the decision model is available from the author upon reasonable request.
Authors’contributions
RMH, NJF, SM and AIGR designed the study. RH carried out the analysis of the Hospital Episode Statistics data, developed the model and drafted the initial manuscript. AIGR contributed to the interpretation of Sentinel and SINAP data. SM designed the initial analysis of the Hospital Episode Statistics data and contributed to the statistical analysis. RMH, NJF, RJB, CM, CP, AIGR, AGR, SJT, PJT, CDAW and SM made substantial contributions to the study design and interpretation of the findings. All authors contributed to the drafting of the article or critical revision for important intellectual content, gave final approval of the version to be published, and agree to be accountable for all aspects of the work in ensuring that questions related to the accuracy or integrity of any part of the article are appropriately investigated and resolved.
Ethics approval and consent to participate
The study received ethical approval in September 2011 from the London East NHS Research Ethics Committee (Ref 11/LO/1396).
Consent for publication Not applicable.
Competing interests
AGR is the National Clinical Director of Stroke in England, and London Stroke Clinical Director. PJT was Clinical Lead for Stroke in Greater Manchester up to 2013, and led the Greater Manchester stroke service redesign from 2007. All
authors have completed the ICMJE uniform disclosure form athttp://
www.icmje.org/coi_disclosure.pdfand declare no support from any organisation for the submitted work, no financial relationships with any organisations that might have an interest in the submitted work in the previous 3 years, and no other relationships or activities that could appear to have influenced the submitted work.
Publisher’s Note
Springer Nature remains neutral with regard to jurisdictional claims in published maps and institutional affiliations.
Author details
1Research Department of Primary Care and Population Health, Royal Free
Medical School, University College London, Royal Free Campus, Rowland Hill Street, London NW3 2PF, United Kingdom.2Department of Applied Health Research, University College London, 1-19 Torrington Place, London WC1E 7HB, United Kingdom.3Alliance Manchester Business School, University of Manchester, Booth Street West, Manchester M15 6PB, United Kingdom. 4
Division of Health & Social Care Research, School of Medicine, King’s College London, Capital House 7th Floor, 42 Weston Street, London SE1 3QD, United Kingdom.5Guy’s and St Thomas’NHS Foundation Trust, St Thomas’Hospital, London SE1 7EH, United Kingdom.6Centre for Primary Care, Division of Population Health, Health Services Research and Primary Care, School of Health Sciences, Faculty of Biology, Medicine and Health, University of Manchester, Oxford Road, Manchester M13 9PL, United Kingdom.
Received: 18 July 2017 Accepted: 22 February 2018
References
1. Office of National Statistics. Census: usual resident population, local authorities
in England and Wales.https://www.ons.gov.uk/file?uri=/peoplepopulationand
community/populationandmigration/populationestimates/datasets/ 2011censuskeystatisticsforlocalauthoritiesinenglandandwales/ r21ewrttableks101ewladv1_tcm77-290562.xls. Accessed 5 Mar 2015.
2. Fulop N, Boaden R, Hunter R, McKevitt C, Morris S, Pursani N, Ramsay AI,
Rudd AG, Tyrrell PJ, Wolfe C. Innovations in major system reconfiguration in England: a study of the effectiveness, acceptability and processes of implementation of two models of stroke care. Implement Sci. 2013;8:5.
3. Hunter RM, Davie C, Rudd A, Thompson A, Walker H, Thomson N,
Mountford J, Schwamm L, Deanfield J, Thompson K, et al. Impact on clinical and cost outcomes of a centralized approach to acute stroke care in London: a comparative effectiveness before and after model. PLoS One. 2013;8:e70420.
4. Morris S, Hunter RM, Ramsay AI, Boaden R, McKevitt C, Perry C, Pursani N,
services in English metropolitan areas on mortality and length of hospital stay: difference-in-differences analysis. BMJ. 2014;349:g4757.
5. Ramsay AI, Morris S, Hoffman A, Hunter RM, Boaden R, McKevitt C, Perry C,
Pursani N, Rudd AG, Turner SJ, et al. Effects of centralizing acute stroke services on stroke care provision in two large metropolitan areas in
England. Stroke. 2015;46:2244–51.
6. Healthcare for London. Stroke Acute Commissioning and Tariff Guidance.
London: Department of Health; 2009.
7. Bhattarai N, McMeekin P, Price C, Vale L. Economic evaluations on
centralisation of specialised healthcare services: a systematic review of methods. BMJ Open. 2016;6:e011214.
8. National Institute for Health and Care Excellence. Guide to the Methods of
Technology Appraisal 2013. 2013.https://www.nice.org.uk/process/pmg9/
chapter/foreword. Accessed 2 Jan 2018.
9. Claxton K, Martin S, Soares M, Rice N, Spackman E, Hinde S, Devlin N, Smith
PC, Sculpher M. Methods for the estimation of the National Institute for Health and Care Excellence cost-effectiveness threshold. Health Technol
Assess. 2015;19:1–503. v-vi
10. Ruta D, Mitton C, Bate A, Donaldson C. Programme budgeting and
marginal analysis: bridging the divide between doctors and managers.
BMJ. 2005;330:1501–3.
11. Office of National Statistics. 2001 Rural-Urban Classification.http://www.ons.
gov.uk/ons/guide-method/geography/products/area-classifications/rural-urban-definition-and-la/index.html. Accessed 12 Feb 2016.
12. NHS Digital. Linked HES-ONS Mortality Data.http://content.digital.nhs.uk/
article/2677/Linked-HES-ONS-mortality-data. Accessed 15 Feb 2016.
13. On behalf of the Intercollegiate Stroke Working Party. National Sentinel
Stroke Audit: Phase II (clinical audit) 2008. London: Royal College of Physicians; 2009.
14. On behalf of the Intercollegiate Stroke Working Party. SINAP - Combined
Quarterly Public Report (Quarters 1–7). London: Royal College of
Physicians; 2013.
15. Wang Y, Rudd AG, Wolfe CD. Age and ethnic disparities in incidence of stroke
over time: the South London Stroke Register. Stroke. 2013;44:3298–304.
16. Briggs A, Sculpher M, Claxton K. Decision Modelling for Health Economic
Evaluation. Oxford: Oxford University Press; 2006.
17. Department for Communities and Local Government. Index of Multiple
Deprivation 2004.http://data.gov.uk/dataset/imd_2004. Accessed 25 Jan 2016.
18. Quan H, Sundararajan V, Halfon P, Fong A, Burnand B, Luthi JC,
Saunders LD, Beck CA, Feasby TE, Ghali WA. Coding algorithms for defining comorbidities in ICD-9-CM and ICD-10 administrative data.
Med Care. 2005;43:1130–9.
19. Gordon AL, Franklin M, Bradshaw L, Logan P, Elliott R, Gladman JR. Health
status of UK care home residents: a cohort study. Age Ageing. 2014;43:97–103.
20. NHS Digital. Emergency Hospital Admissions: Stroke: Indirectly Standardised
Rate, All Ages. Annual Trend.
https://beta.digital.nhs.uk/publications/clinical- indicators/compendium-of-population-health-indicators/compendium- hospital-care/current/emergency-admissions/emergency-hospital-admissions-stroke-indirectly-standardised-rate-all-ages-annual-trend-f-m-p. Accessed 5 Mar 2018.
21. Sheehan J. Pre-Consultation Business Case - Major Trauma and Stroke
Services in London. London: Healthcare for London; 2009.
22. Boyle S. Economic Case for Change in the System of Stroke Care in Greater
Manchester. Greater Manchester & Cheshire Cardiac and Stroke Network, and the Association of Greater Manchester PCTs: Greater Manchester; 2009.
23. Eddama O, Coast J. Use of economic evaluation in local health care
decision-making in England: a qualitative investigation. Health Policy. 2009;
89:261–70.
24. Fulop NJ, Ramsay AI, Perry C, Boaden RJ, McKevitt C, Rudd AG, Turner SJ,
Tyrrell PJ, Wolfe CD, Morris S. Explaining outcomes in major system change: a qualitative study of implementing centralised acute stroke services in two large metropolitan regions in England. Implement Sci. 2016;11:80.
25. Ubel PA, DeKay ML, Baron J, Asch DA. Cost-effectiveness analysis in a setting of
budget constraints–is it equitable? N Engl J Med. 1996;334:1174–7.
26. Hoomans T, Severens JL. Economic evaluation of implementation strategies
in health care. Implement Sci. 2014;9:168.
27. Turner S, Ramsay A, Perry C, Boaden R, McKevitt C, Morris S, Pursani N,
Rudd A, Tyrrell P, Wolfe C, et al. Lessons for major system change: centralization of stroke services in two metropolitan areas of England. J
Health Serv Res Policy. 2016;21:156–65.
28. Sullivan SM, Wells G, Coyle D. What guidance are economists given on how
to present economic evaluations for policymakers? A systematic review.
Value Health. 2015;18:915–24.
29. Fulop NJ, Ramsay AI, Vindrola-Padros C, Aitchison M, Boaden RJ, Brinton V,
Clarke CS, Hines J, Hunter RM, Levermore C, et al. Reorganising specialist cancer surgery for the twenty-first century: a mixed methods evaluation (RESPECT-21). Implement Sci. 2016;11:155.
30. NHS England. 2014/2015 National Tariff Payment System: Annex 5A:
National Prices. Department of Health. 2014;https://www.gov.uk/
government/publications/national-tariff-payment-system-2014-to-2015. Accessed 25 Oct 2015
31. Greater Manchester and Cheshire Cardiac and Stroke Network Support
Team. Development of Stroke Services in Greater Manchester: Twelve
Month Review.http://www.gmecscn.nhs.uk/attachments/article/39/
Appendix1-GMCCSN12monthStrokeReviewOct11.pdf. Accessed 5 Mar 2018.
32. Department of Health. NHS Reference Costs 2013 to 2014.https://www.gov.
uk/government/publications/nhs-reference-costs-2013-to-2014. Accessed 25 Oct 2015.
33. Curtis L. Unit Costs of Health and Social Care 2014. Canterbury: Personal
Social Services Research Unit; 2015.
34. Franklin M, Berdunov V, Edmans J, Conroy S, Gladman J, Tanajewski L,
Gkountouras G, Elliott RA. Identifying patient-level health and social care costs for older adults discharged from acute medical units in England. Age
Ageing. 2014;43:703–7.
• We accept pre-submission inquiries
• Our selector tool helps you to find the most relevant journal
• We provide round the clock customer support
• Convenient online submission
• Thorough peer review
• Inclusion in PubMed and all major indexing services
• Maximum visibility for your research
Submit your manuscript at www.biomedcentral.com/submit