A Novel Personalized Recommendation Algorithm for the
Metrology Industry with Massive Sparse Data
PeiQiang Zheng
1*, JinXing Lin
1, Kaizhi Chen
21 Fujian Metrology Institute No.9, Pingdong Road, Gulou District, Fuzhou, Fujian, China.
2 Fuzhou University, Fuzhou, Fujian, China.
* Corresponding author. Tel.: +86-15960092002; email: [email protected] Manuscript submitted October 31, 2018; accepted December 19
doi: 10.17706/jcp.14.2.134-143
Abstract: Sparsity of source data sets is one major reason causing the poor recommendation quality. In order to solve this problem in the recommendation system of metrology industry with limited an unordered data, this paper proposes a novel personalized recommendation algorithm incorporating industry information and service category information to alleviate the influence of source data sparsity. First, the user's industry information and service category information are added to existing user-service preference data. Then, the K-means clustering algorithm is used to calculate the different user clusters. And then, the user-service preference matrix and the user-service category preference matrix are constructed separately from the user data in each cluster. And then, the nearest neighbor set of target user is calculated by the measure of cosine similarity. Finally, we use the user-based collaborative filtering algorithm to implement personalized recommendations for each user. Experimental results show that the proposed method can improve the recommendation accuracy rate in the metrology industry with sparse data set. The time to calculate for the nearest neighbor is shortened and the recommended speed is improved by reducing the nearest neighbor search range using clustering.
Key words: Industry information, service category, collaborative filtering, personalized recommendation.
1.
Introduction
With people’s higher demand of product quality, safety, health, and environmental protection, lots of new industries are emerging, such as photovoltaic industry, smart grid, and biotechnology. Meanwhile, the market of metrology industry continues to increase, and more and more metrology services are emerging. It is profitable to accurate recommend these professional metrology services to customers. The personalized recommendation system [1] provides an effective tool to deal with this problem by data mining among the metrology services, customer information and other specific information in metrology industry. Traditional collaborative filtering (CF) algorithm is divided into user-based CF [2] and Item-based CF [3]. These algorithms use statistical techniques to find neighbor users with the same or similar interests as the target user [4]. For example, after predicting the preference value of their unselected items based on the preference information of the neighbor user, the top N items with high preference values are recommended to the target user. These algorithms are effective when the train datasets are sufficient.
bottleneck of the recommendation system in metrology industry. So how to overcome or alleviate the sparsity of source data is the major challenge.
Researchers have made great efforts to solve the problem of source data sparseness in recommendation algorithms. Hu et al [5] proposed an implicit semantic model to solve score date sparseness within a recommender system for television shows. Authors used implicit feedback datasets instead of the traditional explicit scoring datasets, which reduced data sparseness in the original scoring matrix. Koren et al [6] proposed a matrix decomposition model, and Zhou et al [7] proposed an incremental recommendation algorithm based on singular value decomposition (SVD). Both of these works coped with data sparseness by dimensionality reduction calculation to remarkably reduce the size of the original score matrix. Huang et al [8] proposed an uncertain neighbors’ CF algorithm. This algorithm can choose the neighbors dynamically as the recommendation set based on uncertain scenarios. Although the recommendation performance in sparse data environment can be improved, the feature information of user and item are lost. WU et al [9] proposed an advanced recommendation algorithm based on CF and partition clustering to reduce the nearest neighbor calculation time and improve the system scalability. To a certain extent, the problem of data sparseness is alleviated. Lekakos et al [10] proposed an algorithm based on user characteristics. The user score information is used to predict the item score value and then filled into the user score matrix to alleviate the sparseness of scoring matrix. Cai et al [11] proposed a hybrid algorithm based on label and collaborative filtering recommendation. This algorithm used the label as the user interest preference and item characteristics, and then used the multidimensional relationship of the user, social and labeling to generate the user feature vector and item feature vector. These processes can effectively alleviate data sparsity and improves the recommended accuracy. In [12], Zhang et al put forward a three-layer neural network that was trained by the user score datasets, and then was used to predict the user's score. The score based on BP neural network prediction is filled into the original sparse score matrix. This method effectively reduces the sparseness of user scoring data. In [13], the author used biclustering to handle the existing duality between users and items. The proposed algorithm consists of a hybrid approach containing an initial cluster phase which is taken as input for a biclustering phase and proves to be scalable dealing with large amounts of sparsity. In [14], the author thought that the temporal with matrix factorization is one of the successful collaborative-based approaches which address data sparsity. However, the user’s rating scores have drifted over time and the predicted rating scores are over-fitted. So the author proposed the ShortTemporalMF, which uses the bacterial foraging optimization algorithm (BFOA) and the k-means algorithm to minimize the over-fitting by exploiting several latent features. In [15], [16], the authors used “trust” in social network to alleviate the sparsity problem and the cold-start problem. In [17], the author proposed the Hierarchical Itemspace Rank (HIR), which decomposes the itemspace into item blocks and exploits this decomposition to define new levels of indirect proximity between the elements of the dataset. This view gives rise to a corresponding stochastic matrix which can be used to enrich the direct inter-item relations and reduce the sensitivity to sparsity.
metrology industry with massive sparse data. The key process is to incorporate existing industry information and service category information to alleviate the influence of data sparsity. And then we integrate some existing methods [8]-[11] into our algorithm for better performance. The following section will demonstrate this algorithm.
2.
The Proposed Algorithm
2.1.
System
Architecture
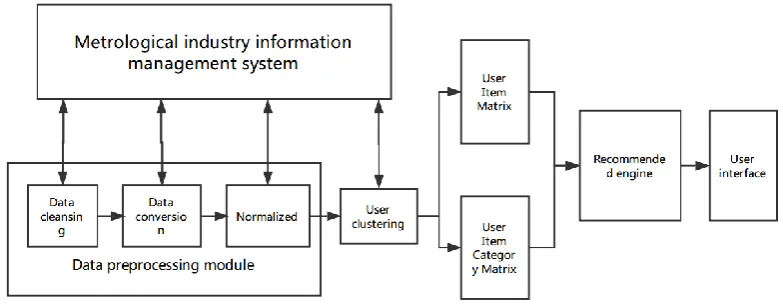
A scheme of personalized recommendation system for the measurement industry on the basis of industry information and service categories is presented in Fig. 1. The nearest neighbor set of each target user can be obtained by adding industry information and service category to the traditional user historical behavior data, combining with the clustering technology and user-based CF technology, and processing historical user data from the measurement industry. Therefore, the possible preference of the target user can be predicted, and higher accuracy of personalized recommendation services can be generated according to the preference of the nearest neighbor set.
Fig. 1. System architecture.
2.2.
Data Preprocessing
The user model is established through data preprocessing. The model should be able to represent the needs and interests of users. The system uses the space vector model to represent the user and facilitates user clustering and similarity calculation. The data source is the instrument inspection record of the customer in the measurement industry. Data preprocessing includes data cleaning, data conversion, and
The systemconsists of the following five modules:
Information management system of measurement industry, including data storage and management, is used to store the original and transformed data, and establish the relation between database tables. This system facilitates the program to access and use data.
The data preprocessing module involves data cleaning and data conversion. This process is used to establish user model.
The similar-industry user clustering module is related to the division of the entire user group into a number of clusters of similar users.
The recommendation engine module is related to finding similar users and generating a recommended list.
normalization. Data are optimized in data cleaning. Records that do not meet the requirements, such as those with empty fields and dirty data, are deleted. Data cleaning can improve the quality of data leading to enhanced performance of an algorithm in learning the user's preference information. Data conversion is used to represent the user's inspection record with a vector. The dimension of the vector is the total number of utensils, and each dimension represents an instrument in which the mark of the checked record is 1, and the flag of the unchecked record is zero. Normalization limits the data to a certain extent. This process is not only convenient for data processing but also hastens the convergence of the operation.
2.3.
Similar User Clustering
Similar users are clustered after data preprocessing. In the measurement industry, the users of the same industry are highly relevant in the selection of metering services because of the similarities in the work. The category of a project has certain relevance, and the types of service are numerous, but the industry type is relatively rare. Thus, similarity calculation based on user similarity is used in this study to facilitate the calculation. The search range for the nearest neighbor in calculating for the nearest neighbor during clustering can be narrowed by dividing the users of higher similarity into a class. Therefore, the classical K-Means clustering algorithm is implemented. An important step of the K-means algorithm is the choice of the initial K value. As previously mentioned, the users from the same industry also have certain relevance in the user preferences. Therefore, the total number of industries is used in this study as the initial K value input. The specific principle of the algorithm is the establishment of the users’ collection User, and the total number of users is recorded as User (U1, U2, U3,..., Um). The user information of each user vector Ux is normalized, and each service item information of its choice is considered the Ux attribute. Assuming n attributes, Ux can be expressed as Ux (Cx1, Cx2, Cx3,..., Cxn).
Clustering is based on the User, according to the user's properties to complete the comparison of similar user grouping. The user is divided into K similar clusters, and a cluster center, which is the mean of the cluster, is set in each cluster. The Ux close to the mean is divided into this group, and the pseudo code of specific steps is shown in Algorithm 1.
In algorithm 1, user behavior data with industry information and industry number K are used as initial clustering inputs. The algorithm randomly selects K users as the initial cluster center and then calculates the distance of each user to each cluster center in step 12. The algorithm assigns the user to the corresponding cluster according to the value of the target user to the center distance of each cluster in step 12. After all users have been assigned, the algorithm recalculates the new cluster center in step 15. Then, the algorithm determines whether the distance between the new and old cluster centers satisfies the convergence condition. If the condition is not satisfied, the algorithm repeats steps 11 to 15, until the new clustering center satisfies the convergence condition. Then, algorithm is terminated, and the clustering results are generated.
2.4.
Collaborative Filtering Recommendation Based on Service Category and User
Similarity
categories by the user as a supplement to the user-project preference matrix. Hence, when the user history data is sparse, the traditional algorithm cannot find the neighbors. Thus, algorithm 2 is implemented as a complementary means of finding the nearest neighbor set.
Table 1. Algorithm 1 : User Clustering
Require:User,K,Ux,m,n,Cxi 1:User -user vector set
2:K -Number of clusters
3:Ux -user vector(
U
x
User
)4:m-Total number of users 5:n -Total number of items
6:Cxi-The attribute value of each user vector
Ensure:K-means 7:Input User, K
8:Output Each cluster of users and cluster centers for each cluster
9:Randomly select K user
vectors
(
U
1,
U
2,
U
3
U
k)
User
as the initial cluster center10:repeat
11: for each
U
x
User
(0<x<m)do 12: Ux to the cluster centerUidxi (cx1ci1)2(cx2ci2)2(cxncin)2 13: Ux belongs to the user cluster
2 )
(
min
arg x i
i x
U U
c (i[1,K])
14: end for
15: Recalculate the cluster center
m x x m x x x i i c U i c U 1 ) ( 1 ) ( } { 1 } { 116:until The clustering center satisfies the convergence condition
After constructing two preference matrices, the next step is to determine the user's top-n nearest neighbor set. CF algorithm based on user is implemented according to the similarity between users to determine the target user's top-n nearest neighbor set. Many techniques can be used to calculate the similarity, but the cosine similarity is used in this study. First, the user-project preference matrix is used. Then, the user's preference value of the project is considered as an n-dimensional preference vector. The In algorithm 2, a user set U and item set S are defined first. The user's preference for the item is expressed as R, which is an m×n matrix, where each line represents a user's preference vector for the item.
R (i, j) represents the preference of user i for item j. The data set in the current study is based on the implicit feedback characteristics of user behavior data. Thus, the preference is simplified to 0 and 1 to represent the user's preference for an item; that is, 0 indicates not preferred and 1 as preferred. A user-service category preference matrix S is also built. Similar to the user-project preference matrix, each line represent a user's preference vector for the service category. S(i, j) represents the number of times user ihas selected the jclass service. The user has selected items
Table 2. Algorithm 2 : Collaborative Filtering Recommendation Method Based on Service Categories and User Similarity
Require:Ri×j,Si×k,n,i,j,k,u 1:Ri×j-User - Item preference matrix
2:Si×k-User - Service category preference matrix 3:n-The number of neighbors
4:i-User dimension 5:j-Item dimension
6:k-Service category dimension 7:u-user vector
Ensure:Collaborative filtering 8:Input:Ri×j,Si×k,n
9:Output:User's recommended list L 10:Initialize the recommended list L 11:for each
u
R
ij do12: Use Ri×jto calculate the similarity UserSim between u and other users in the cluster
13: if The number of users with a similarity of 0 is greater than or equal to n
14: According to UserSim get top-n neighbor set and calculate u's recommended list L '
15: else
16: Use Si×k calculate the similarity between u and other users in the cluster
17: To get u top-n neighbor set and calculate u for other items of preference values
18: The preference value to fill in the original user vector u for the 0 items
19: Use the new vector to compute the nearest neighbor and get the u’s list L '
19: L+=L’ 20:end for
21:return L
value of the i-th dimension represents the score for item I. The score vectors of user uand the user vare
represented as vectors Xand Y v can be defined as
follows:
n i i n i i n i i i y x y x Y X Y X Y X sim 1 2 1 2 1 ) cos( ) ,(
. (1)The similarity UserSim between the target user and other users can be determined by calculating the similarity between users. When the target user's similarity is not 0, the number of neighbors is less than n. Thus, the user-service category preference matrix is introduced. The similarity between the target user and other users is calculated by the cosine similarity UserSim'. A top-n nearest neighbor set can also be obtained. With this top-n nearest neighbor set, the target user's preference is calculated for each service item using the user-based CF method. Then, these values are filled according to the user's original user-project preference vector in the 0 item, and a new user-item preference vector is obtained. Then, the new user-project preference vector is used to
compute for the new top-n neighbor set.
u
n u G i n u G i i j i u j u j u sim R R j u sim R P ) ( ) ( , , ) , ( ) )( , ( (2)Finally, according to the preference value of target user for each item, a recommended list of each target user is generated from high to low.
3.
Experimental Results and Analysis
The experimental data covers 100,000 inspection data provided by the Fujian Academy of Metrology in 2013. The data set includes 10 industries, 9853 users, 8 inspection categories, and 196 measuring instrument inspection service. Data sparsity is 94.82%, which indicates a sparse data set.
The valid fields in the data are sorted, and these fields include user ID, item ID, user's industry code, and a list of service categories. The experiment consists of two parts, namely, data processing module and recommendation engine module. Data preprocessing is implemented by SQL Server 2008, and the recommendation engine module is implemented by Python development module under eclipse.
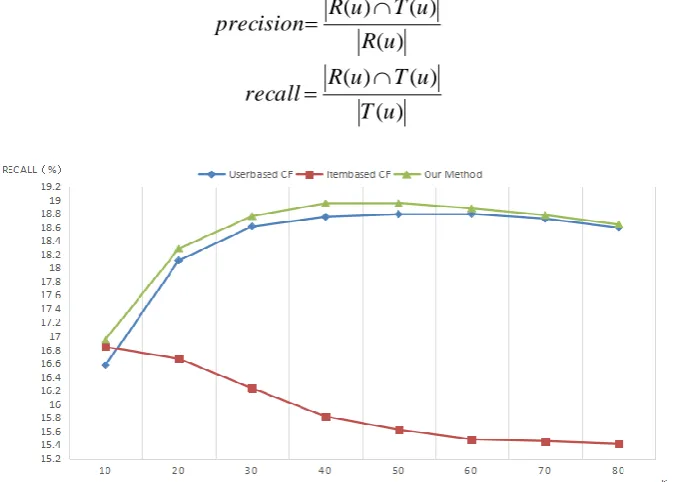
The experimental evaluation standard adopts two indices, namely, recall and precision rates [18]. The precision rate describes the probability of the user's interest in the past in the resource recommendation set, while recall rate describes the probability of the resources which are of interest to the user in the resource recommendation set. R(U) is the final resource recommendation set given by the user's behavior on the training set. T(U) is the user's actual chosen resource set in the recommendation system. Precision and recall are defined as follows:
) ( ) ( ) ( u R u T u R
precision (3)
)
(
)
(
)
(
u
T
u
T
u
R
recall
(4)Fig. 2. Comparison of the recall rates of the traditional and proposed methods.
Three sets of experiments are designed to verify the effectiveness of the proposed personalized recommendation method based on industry information and service categories. Each group of experiments recommends the top 10 candidates to the user. The proposed method is compared with the traditional user-based and item-based CF algorithms. The experiment uses cross validation, and the data set is randomly divided into eight parts, one of which is used as test set, and remaining parts as training set. The experiment is repeated five times, and the average is considered as the final result. The comparative experimental results in the proposed method and the user-based CF and item-based CF are shown in Fig. 2–4.
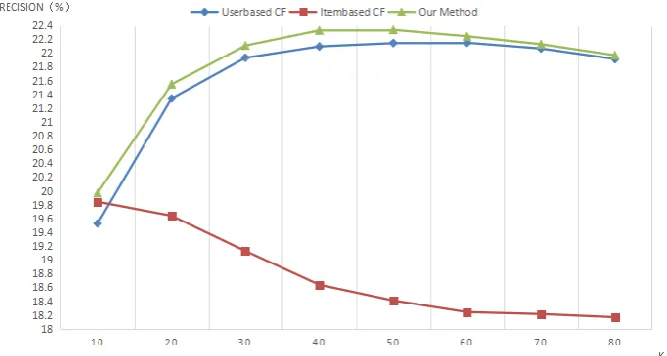
In Fig. 2 and 3, the abscissa is the number of neighbors of the specified customer, while the vertical coordinate represents the recall in Fig. 2 and precision in Fig. 3. User-based CF has the lowest recall and prevision when the initial neighbor number is 10. Increasing the number of neighbors results in the gradual increase in recall and precision rates, with the highest levels obtained at approximately 60 neighbors, followed by slight decrease in these indices. When the initial number of neighbors is 10, the recall and precision rates of item-based CF are higher than those of user-based CF, but slightly lower than those of the proposed method. However, the recall and precision rates decrease with increase in the number of neighbors. When the number of neighbors reaches 60 the two indices tend to be stable. When the initial neighbor is 10, recall and precision rates of the proposed method are higher than those of the other two methods, and performance is better as the number of neighbors increases, but a slight decrease when the number of neighbors is more than 40. On the whole, the recall and precision rates of the proposed method are higher than the other two methods, regardless of the number of neighbors.
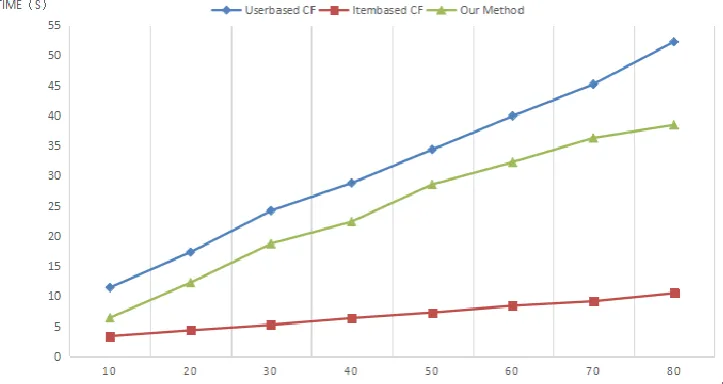
In addition, the calculation time of the three groups of experiments are compared, and the results shown in Fig.4.It shows that item-based CF results in the shortest calculation time, while the user-based CF generates the longest calculation time. The result from the proposed method is between those of the two methods. The proposed method is faster than the user-based CF but slower than the Item-based CF. Thus, based on the time complexity of the algorithm, the same conclusion can be drawn. Assuming m users and N projects, the User-based CF calculates the time complexity of a user's similar user to O (m), while the time complexity of a similar project for an item-based CF calculation is O (n). In the proposed method, users are clustered and divided into several user clusters, and this process reduces the search scope of neighbor users. Assuming K user clusters, the time complexity of calculating a user's similar user is O (m / k), because in the data set, m is much larger than n; thus, O (m)> O (m / K)>O (n). The experimental results validate this analysis.
Fig. 4. Comparison of calculations times of the traditional and proposed methods.
Although Item-based CF is optimal in computation time, its performance on recall and precision is unsatisfactory. Therefore, the experimental results show that the measurement industry personalized recommendation method can obtain better recommendation accuracy and faster speed of recommendation in sparse data set.
4.
Conclusion
This paper proposes a personalized recommendation method based on the industry information and service categories of customers in the measurement industry. Experimental results show that the proposed method can improve the recommendation accuracy rate in the metrology industry with sparse data set. The time to calculate for the nearest neighbor is shortened and the recommended speed is improved by reducing the nearest neighbor search range using clustering. In our future work, we will focus on how to use more information about customer to help
References
[1] Zhang, B., Zhang, Y., & Gao, K. N. (2012). Combining relation and content analysis for social tagging recommendation. Journal of Software, 391(22), 5759-5768.
[2] Zhao, Z. D., & Shang, M. S. (2010). User-based collaborative-filtering recommendation algorithms on hadoop. Proceedings of the 3rd International Conference on Knowledge Discovery and Data Mining,
WKDD'10(pp. 478-481).
[3] Sarwar, B., Karypis, G., & Konstan, J. (2001). Item-based collaborative filtering recommendation algorithms. Proceedings of the 10th International Conference on World Wide Web, ACM(pp. 285-295). [4] Cong, L., Liang, C., & Li, M. (2008). A collaborative filtering recommendation algorithm based on
domain nearest neighbor. Journal of Computer Research & Development, 45(9), 1532-1538.
[5] Hu, Y., Koren, Y., & Volinsky, C. (2008). Collaborative filtering for implicit feedback datasets.
Proceedings of the Eighth IEEE International Conference on Data Mining (ICDM'08), IEEE (pp. 263-272).
[6] Koren, Y., Bell, R., & Volinsky, C. (2009). Matrix factorization techniques for recommender systems.
Computer, 42(8),30-37.
[7] Zhou, X., He, J., & Huang, G. (2015). SVD-based incremental approaches for recommender systems.
Journal of Computer and System Sciences, 81(4), 717-733.
algorithm. Chinese Journal of Computers, 33(8), 1369-1377.
[9] Wu, H. C., Wang, X. J., & Cheng, Y. (2011). Advanced recommendation based on collaborative filtering and partition clustering. Journal of Computer Research and Development,48(2), 205-212.
[10]Lekakos, G., & Giaglis, G. M. (2006). Improving the prediction accuracy of recommendation algorithms: Approaches anchored on human factors. Interacting with Computers, 18(3), 410-431.
[11]Cai, Q., Han, D. M., & Li, H. S. (2014). Personalized resource recommendation based on tags and collaborative filtering. Computer Science, 41(1), 69-71.
[12]Zhang, F., & Chang, H. Employing BP neural networks to alleviate the sparsity issue in collaborative filtering recommendation algorithms. Journal of Computer Research & Development, 43(4), 667. [13]Desai, T., Gandhi, S., & Murlidhar, P. (2016). An enterprise-friendly book recommendation system for
very sparse data. Proceedings of International Conference on Computing, Analytics and Security Trends
(CAST), IEEE (pp. 211-215).
[14]Al-Hadi, I. A. A. Q., Sharef, N. M., & Sulaiman, M. N. (2017). Bacterial foraging optimization algorithm with temporal features to solve data sparsity in recommendation system. Proceedings of the 2nd
International Conference on Internet of Things and Cloud Computing, ACM (pp. 148).
[15]Papagelis, M., Plexousakis, D., & Kutsuras, T. (2005). Alleviating the sparsity problem of collaborative filtering using trust inferences. Proceedings of International Conference on Trust Management (pp. 224-239).
[16]Pitsilis, G., & Knapskog, S. J. (2009). Social trust as a solution to address sparsity-inherent problems of recommender systems. Recommender Systems & the Social Web.
[17]Nikolakopoulos, A. N., Kouneli, M. A., & Garofalakis, J. D. (2015). Hierarchical itemspace rank: Exploiting hierarchy to alleviate sparsity in ranking-based recommendation. Neurocomputing,163, 126-136. [18]Zhu, Y. X. (2012). Evaluation metrics for recommender systems. Journal of the University of Electronic
Science & Technology of China,41(2), 163-175.
Peiqiang Zheng graduated at Fuzhou University in Fuzhou, China in 2007, where he received a M.A. in software engineering. Now, he works as a network and systems administrator in Fujian Metrology Institute, China. His research interests include big data technology and software testing.
Jingxing Lingraduated at Machinery Institute of Shan’Xi, China in 2003. Now, he works as measurement technology and the measuring data research in Fujian Metrology Institute, China. His research interests include big data of measurement and management.