HIGH RESOLUTION IMAGE
PROJECTION IN FREQUENCY DOMAIN
FOR CONTINUOUS IMAGE SEQUENCE
1M. Nagaraju Naik, 2P. Rajesh Kumar
1Associate Professor, CMRCET, Medchal, Hyderabad, A P, India. 2Associate Professor, A.U. College of Engineering, Vizag, A P, India.
Abstract:
Unlike most other information technologies, which have enjoyed an exponential growth for the past several decades, display resolution has largely stagnated. Low display resolution has in turn limited the resolution of digital images. Scaling is a non-trivial process that involves a trade-off between efficiency, smoothness and sharpness. As the size of an image is increased, so the pixels, which comprise the image, become increasingly visible, making the image to appear soft. Super scalar representation of image sequence is limited due to image information present in low dimensional image sequence. To project a image frame sequence into high-resolution static or fractional scaling value, a scaling approach is developed based on energy spectral interpolation and frequency spectral interpolation techniques. To realize the frequency spectral resolution Cubic-B-Spline method is used.
Keywords: Cubic-B Spline, Image, Super Resolution, Digital image, smoothness.
I. Introduction:
Digital image codings are developed from a long time. In the area of image processing there is a need to improve the resource requirement for progressive image processing using resource optimization techniques. In earlier efforts it is observed that image sequencing can be improved by optimized usage of available resources using scheduling schemes, multiplexing schemes, representation schemes etc. The proposed conventional methods were observed to be developed keeping available resources and there constrains in mind. Today’s applications demand high-resolution representation of image data for real time interfacing and communications. With the incorporation of developed optimization scheme as outlined above can provide a significant improvement in coding but in current scenario and for future applications these methods may get constrained. As the available resources such as bandwidth, power, coding techniques are limited to certain minimum values. To achieve high resolution representation images are to be retained for good visual quality. As resource optimizations are constrained, coding techniques are to be improved to achieve the stated quality in image processing. A new approach of image representation has emerged in recent past with high-resolution projection approach for low dimensional image sequence. Where data representation low is very low in resource requirement and has low visual quality then it is suggested to be interpolated on a high-resolution grid for better visual quality. To achieve higher visual quality the stated interpolation approaches were carried out in frequency representation using transformation techniques. The most dominantly used transformation is the fast Fourier transform technique. In this work the problem of low-resolution interpolation issue isfocusedand a method using Cubic-B-Spline is incorporated to the conventional FFT based interpolation scheme.
II. System Design:
Let
x
s,
y
s be the size in the X direction and Y direction respectively of a planar source image. Let the corresponding sizes of the destination image bex
d,
y
d. This means that the source image hasx
spixels in a row, which must be converted tox
d pixels in the destination image. The ratio of these two numbers is called scaling factors d x
x
x
s d y
y
y
S
__________(2)The problem of image high-resolution is observed to estimate a high resolution (HR) version of a image sequence from its low-resolution (LR) equivalent. Even in the case of a sufficient number of LR samples, the presence of distortion and noise produces contradictory source information. In many ways the solution is similar to previous approaches for still-image scenarios, but certain modifications have been introduced to improve performance and tackle some complications that arise specifically for the case of image.
There are several attractive features for this proposed method. First, the required models can also be adjusted locally for a higher-quality HR reconstruction. The second major quality of the algorithm is its efficiency, a necessary requirement for a practical image enhancement solution. Finally, the proposed method offers significant flexibility in several aspects of the solution: the scaling factor can be arbitrarily adjusted (even separately on each dimension for aspect ratio conversion), the model information (distortion, noise, and motion) can be changed locally, and the amount of source data can vary allowing a more selective inter-frame registration.
III. Architecture of Proposed Method:
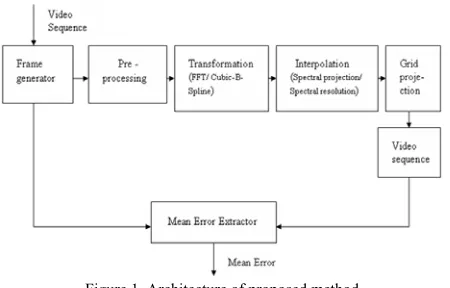
The Architecture of Proposed Methodis shown below, here frame generator takes low resolution image sequences as input and converts it into static frames. These static frames converted into grey level in the pre-processing step. Next these grey level frames converted into frequency domain using FFT transformation to compare we are using Cubic-B-Spline method. The transformed data to than interpolated (spectral projection/spectral resolution) using FFT and Cubic-B-Spline. The projected data is aligned over a predefined grid format to obtain high resolution image. This image sequence is compared with original data to extract Mean Error.
Figure 1. Architecture of proposed method
The concept of resolution projection of image stream is developed using spectral and frequency interpolations and evaluated for computational time and retrieval accuracy.
A) Functional Description:
1) Input Interface: The developed system is processed over a very low image sequence represented in low dimensional projection. To evaluate the performance of suggested scaling system, a low dimensional, colored image streams are read and transformed into frame sequence using input interface unit. The processed frame sequence is then passed to a pre-processing unit for the equalization of input frame sequence for further processing.
2) Pre-Processing: This unit extracts the gray pixel intensity of the continuous frame sequence and pass to the transformation unit for further processing. The gray pixel intensity are extracted from the input information segregated colored information.
4) Interpolation: Once the spectral resolutions were obtained, the pixel is to project on a higher grid level depending upon the scale value. Scaling of the image is achieved by interpolating the pixel information based on energy distribution of the given image sequence. To achieve better interpolation rather than energy resolution, spectral resolution could provide high-resolution accuracy developed using Cubic-B-Spline approach. The interpolated information is than projected on a grid projection to represent the given low dimensional image sequence into high-resolution image sequence.
IV. Coding Aproach:
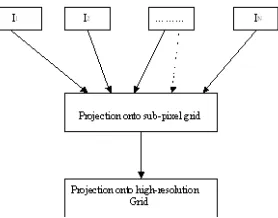
Most of the methods on super resolution try to solve these two problems. Though their approaches are different but the end goal is same. The following figure describes the two steps graphically. On the left hand side four low-resolution images are shown Motion estimation is used to estimate the pixel positions of the three images with respect to the 1st image. Note that these pixel positions would not be at integer values, but can take any real value. Once this information is calculated accurately, it is possible to project this information on a desired high-resolution grid. Details of how these two problems are solved will be discussed in the following sections.
Figure 2. Conversion of low-resolution images to high-resolution images.
A) Image Registration:
The first step in any Super-resolution algorithm is to estimate the motion between given LR frames. A good ME is a hard prerequisite for SR. In this project the motion is restricted to shifts and rotation, so a very simple (though accurate) approach is enough for image registration.
B) Transformation Schemes:
There are two ways that can be used to carry out rotation estimation between low-resolution images.
Rotate individual images at all the angles and correlate them with the first image. The angle that gives the maximum correlation is the angle of rotation between them.
The method described above is computationally expensive, so a faster method is to calculate the image energy at each angle. The correlation of these energy vectors of different images will give the angle of rotation.
Angle (i) = max index (correlation (I1(θ), Ii (θ))) ____________(3)
Where I1(θ) is the pixel intensity of the reference pixel and Ii(θ) is the intensity of the ith pixel. It turned out that
though the first method is computationally expensive, but gives more precise results, so it was used in this project. B.1) SHIFT CALCULATION
Once rotation angle is known between different images, shift calculation can be performed. Before calculating the shift, all the images are rotated with respect to the first image. For determining the amount of shift in any pixel of an image,
Fi(uT) = ej2πuΔs. F
1 (uT) ______(4)
This is obtained by applying Fourier Transform of a reference pixel matrix. The shift angle Δs from the above relation can be calculated as:
Δs = [angle (Fi(uT)/ F
1(uT))]/2π____(5)
And in matrix form,
Δs= [Δx Δy] T________(6)
Where,
U(x, y) is the pixel coordinate,
Δy is the variation of current y-position from reference y-position, Fi (uT) is the transform of transposed ith pixel,
F1 (uT) is the transform of transposed referencepixel, Δs is the shift angle.
Technically, each frequency domain method should give the same shift, but that does not happen.
Figure 3. Various operations done on the image after step 1
V. Projection onto High Grid Resolution
Once a good estimate of shift and rotation between all the images and the reference image is achieved, the pixel positions of all the LR images in the reference frame of the first image can be derived. Then we can project this information on high-resolution grid. There are various ways to do this.
A) Bilinear Interpolation B) Bicubic Interpolation
In Bilinear Interpolation is the process of using each of the intermediate fields in an interlaced image frame to generate a full size target image. Either all the odd or all the even lines on the field are used. Interpolations are then performed between the lines and between adjoining pixels to generate an entire non-interlaced frame for the progressive scan output.
VI. Iterative Back-Projection
The iterative back-projection (IBP) technique [6] can accomplish the HR image interpolation and de-blurring simultaneously. Its underlying idea is that the reconstructed HR image from the degraded LR image should produce the same observed LR image if passing it through the same blurring and down sampling process. The iterative back-projection (IBP) technique can minimize the reconstruction error by iteratively back projecting the reconstruction error into the reconstructed image. Taking into account several considerations, a method that was fairly simple and straightforward - Fourier algorithm (P-G Algorithm) is proposed.
A) Fourier Projection:
This method assumes two things:
Some of the pixel values in the high-resolution grid are known. The high frequency components in the high-resolution image are zero. It works by projecting HR grid data on the two sets described above. The steps are:
Form a high resolution grid. Set the known pixels values from the low-resolution images (after converting their pixel position to the ref frame of first low-resolution image). The position on the HR grid is calculated by rounding the magnified pixel positions to nearest integer locations.
Figure 4 Flow Chart for P-G Algorithm
By making the high-frequency equal to zero, this method tries to interpolate the unknown values and so correct the aliasing for low-frequency components. Also, by forcing the known values, it does predict some of the high-frequency values. The set of images walks through the actual working of this algorithm. Initially, the HR grid is filled with known pixel values and makes the unknown pixel values to be zero.
In the next step, the higher frequencies can be made zero in the frequency domain. This effectively is low-pass filtering the image. The unknown pixels now have got some value, and the known values have gone down in amplitude, due to low-pass filtering. The magnitude of known pixels can be increased by forcing them to what they should be. This again creates some high-frequency components by iteratively doing this again and again, correcting the low-frequency values (by guessing the values for unknown pixels) and finding some the high-frequency components by forcing the known values is achieved. By juggling between the two data sets, i.e. forcing the high frequency to zero and forcing the known values, we have estimated the value of unknown pixels.
VI. Results & Observations:
Figure 5 Original image sequence considered
The original frame sequence taken for processing of the image coding system. The original frame sequence is taken at a very low resolution with pixel representation of 150x250 size frame. These 5 frame sequences are passed to the developed system for pre processing.
Figure 6 Scaled image sequences at 1:2.5 ratio using Fourier approach
The interpolation is carried out for the spectral distributed image coefficients obtained after Fourier transformation. The interpolation is made for the spectral distributed data as shown above.
Figure 7 Scaled image sequences at 1:2.5 ratio using cubical-b-spline approach.
1 2 0 1 0 2 0 3 0 4 0 5 0 6 0 7 0 8 0 9 0 1 0 0
P r o c e s s i n g t i m e p l o t
O b s e r va t i o n
Co m p u tat ion t im e( S ec )
F o u r i e r i n t e r p o l a t i o n C u b i c - b - s p l i n e i n t e r p o l a t i o n
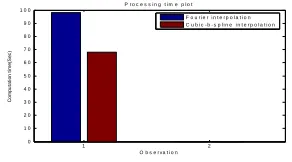
Figure 8. Computation time taken for the two methods.
The system developed is also evaluated for the computation time taken for the computation and projection of the frame sequence for interpolation. The total time taken for reading, processing and projecting is considered for the processing system.
VII. Conclusions:
The energy spectral resolution projecting is carried out using Fourier transform techniques, where a low dimensional image sequence is projected to a high grid based on energy distribution. To improve resolution accuracy, a frequency based projection scheme is developed. To realize the frequency spectral resolution Cubic-B-Spline method is used. It is observed that the resolution accuracy with respect to visual quality, mean error and computational time is comparatively improved compared to conventional Fourier based interpolation technique. For the evaluation of the suggested approach, the system is tested over various low dimensions of image sequence and scaled over fixed and fractional scaling value. Due to the higher visual quality the system find applications in various real time applications such as Television processing, Image conferencing, Internet image processing, Tele medicine etc.
VIII. Reference:
[1] S. P. Kim, N. K. Bose, and H. M. Valenzuela, “Recursive reconstruction of high resolution image from noisy under sampled multiframes”, IEEE Trans. Acoust., Speech, Signal Processing, vol. 38, pp. 1013-1027, June 1990.
[2] S. Farsiu, M. D. Robinson, M. Elad, and P. Milanfar, “Fast and robust multiframe super resolution”, IEEE Trans. Image Processing, vol. 13, pp. 1327-1344, Oct. 2004.
[3] X. Li and M. T. Orchard, “New edge-directed interpolation”, IEEE Trans. Image Proc., vol. 10, pp. 1521-1527, Oct. 2001.
[4] H. A. Aly and E. Dubois, “Specification of the observation model for regularized image up-sampling,” IEEE Trans. Image Processing, vol. 14, pp. 567-576, May 2005.
[5] R. S. Prendergast and T. Q. Nguyen, “Spectral modelling and Fourier domain recovery of high-resolution images from jointly undersampled image sets”, under review for IEEE Trans. Image Proc., submitted Dec. 18, 2006.
[6] K. S. Ni and T. Q. Nguyen,“Image superresolution using support vector regression”, IEEE Trans. Image Proc., vol. 16, pp. 1596- 1610, June 2007.
[7] S. C. Park, M. K. Park, and M. G. Kang, “Super-resolution image reconstruction: a technical overview”, IEEE Signal Processing Mag., vol. 20, pp. 21-36, May 2003.
[8] B. Narayanan, R. C. Hardie, K. E. Barner, and M. Shao, “A computationally efficient super-resolution algorithm for image processing using partition filters,” IEEE Trans. on Circ. Syst. For Image Technology, vol. 17, no. 5, pp. 621-634, May 2007.
[9] S. Farsiu, M. Elad, and P. Milanfar, “Image-to-image dynamic superresolution for grayscale and color sequences,” EURASIP Journal of Applied Signal Processing, Special Issue on Superresolution Imaging, vol. 2006, pp. 1–15, 2006.
[10] R. C. Hardie, “A fast image super-resolution algorithm using an adaptive Wiener filter,” IEEE Trans. Image Proc., vol. 16, no. 12, pp. 2953-2964, Dec. 2007.