Published online February 20, 2013 (http://www.sciencepublishinggroup.com/j/ijssn) doi: 10.11648/j. ijssn.20130101.12
Running consistent, parallel experiments in vehicular
environmen
Jui-Ting Weng, Ian Ku, Giovanni Pau, Mario Gerla
Computer Science Department of University of California, Los Angeles, Los Angeles, USA
Email address:
[email protected] (Jui-Ting Weng), [email protected] (I. Ku), [email protected] (G. Pau), [email protected] (M. Gerla)
To cite this article:
Jui-Ting Weng, Ian Ku, Giovanni Pau, Mario Gerla. Running Consistent Parallel Experiments in Vehicular Environment. International Journal Sensors and Sensor Network. Vol. 1, No. 1, 2013, pp. 10-20. doi: 10.11648/j.ijssn.20130101.12
Abstract:
The dynamic nature of vehicular ad-hoc networks (VANETs) makes performance comparisons hard, because network conditions cannot be replicated. This paper introduces PepNet (Parallel Experiment Platform for VANET), a VANET testbed where multiple experimental configurations run simultaneously on identical network conditions. PepNet exploits Xen and Gentoo to provide a virtualized environment at every node. Atop the virtualized environment, multiple virtual guests, each are carrying an independent experiment, run in parallel sharing the same physical resources. The contributions of this paper are three-fold. (1) Virtual machines run various experiments simultaneously, so that each set of experiments encounters identical network conditions and thus produces consistent results. (2) Fewer physical machines are required. (3) Experiments are more consistent, easier to control, and the results are easier to interpret. To demonstrate the efficacy of PepNet, two well-known ad-hoc routing protocols, AODV and OLSR, are tested. Experiments confirm the results published in several previous studies, while the new testbed is more efficient and gives more consistent results.Keywords:
VANET, Testbed1. Introduction
Testbeds play a key role in ad hoc network research, be-cause a wireless medium has physical characteristics that cannot easily be simulated. Over the years, many kinds of testbeds have been developed. Performing testbed expe-ri-ments in a mobile ad hoc network (MANET), however, is challenging.
The first challenge in a MANET testbed is the cost due to mobility. Devices require continuous power supply, human monitoring, and mobility support. Therefore, even a simple MANET experiment is costly to conduct. In addition, when evaluating performance among protocols or applications, the cost of experiments increases proportionally to the number of different scenarios, which causes mobile experiments to be short and limited to few rounds.
Another challenge for MANET testbed experiments is topology control. This becomes more difficult in a vehi-cu-lar ad hoc network (VANET), where the topology changes are much faster than in a traditional MANET. Convention-ally, vehicles are integrated with wireless de-vices to estab-lish Vehicle to Vehicle (V2V) communication, and are dri-ven around to provide mobility for the experi-ments [1]-[6]. Nevertheless, this can result in inconsistent
environmental conditions. For example, suppose the objec-tive is to com-pare two routing protocols. The common approach is to run experiments with routing protocols A and B separately. However, the results are generally not fairly compared, because in ten minutes the external interference may have changed, the motion pattern of the various ve-hicles in-volved in the experiments may have changed (for example, due to unpredictable traffic lights), and the radio propaga-tion may have changed (say, due to mobile ob-stacles beyond experimental control).
Simulations provide an alternative approach to evaluate VANET research to solve the inconsistency problem in testbed experiments. Simulators such as ns-2, Opnet, and QualNet allow researchers to repeat experiments with dif-ferent protocols configured, which ensure consistency. The whole system is under full control and thus one can adjust a few parameters and keep the rest unchanged. However, simulators assume accurate modeling of physical characte-ristics such as mobility/traffic patterns, radio propagation models, and external interferences.
based on those traces. Traffic/mobility traces can be gener-ated by traffic simulators, public transportation schedules, and real-time logs [7]. Such an approach allows one to evaluate the performance by simulations using complex and realistic mobility patterns.
Nevertheless, problems still remain in radio propagation models and external interferences. A common approach to simulate the radio propagation is to use well-established statistical models, which mostly do not account for static obstacles such as buildings and moving obstacles such as trucks. A model that estimates signal coverage through ex-isting maps is available in [8]. However, attenuation caused by dynamic factors such as moving obstacles is still diffi-cult to reproduce. A naive solution, similar to what is often done for the mobility model, is to collect channel condition logs from real experiments. This is extremely costly since it records noise level and signal strength for all node pairs every milli- or even micro-second throughout the experi-ment. A simplified version of this naive solution was pro-posed in [9], which records only channel connectivity. Nonetheless, connectivity itself is still not accurate enough to represent real channel conditions. These lo-ca-tion-dependent and time-varying physical characteristics inevitably make simulations inaccurate.
Testbed approaches are the only way to conduct VANET experiments with high fidelity, but the dynamic nature of VANETs result in experimental inconsistency. Though it is possible to repeat enough experiments until the uncon-troll-able factors ``even out", this significantly increases the cost.
This paper addresses these challenges by leveraging the resource sharing of virtual machines to perform parallel experiments. Its three major contributions are as follows. (1) Pepnet, a virtual machine based VANET testbed, compares different protocols under the same topology and channel conditions. (2) Virtual machines allow parallel experi-ments to be conducted with fewer physical machines. (3) The perimental results are easier to compare because of the ex-periment consistency. To demonstrate PepNet, two well- known ad-hoc routing protocols, AODV and OLSR, are tested. Our experiments confirm the results from sever-al previous studies, while our testbed requires fewer physi-cal resources and gives more consistent results.
The rest of the paper is organized as follows. Previous studies on testbeds and simulations are introduced in Sec-tion 2. Section 3 describes the platform details. Virtua-liza-tion overhead is evaluated in Section 4. Comparisons be-tween AODV and OLSR are reported in Section 5. Fi-nally, conclusions and future extensions are presented in Section 6.
2. Related Work
Testbeds play a key role in ad hoc network research, be-cause a wireless medium has physical characteristics that cannot easily be simulated. Over the years, many kinds of testbeds have been developed. Performing testbed
expe-ri-ments in a mobile ad hoc network (MANET), however, is challenging.
VANET is an emerging technology that improves safety and provides comfort and convenience for vehicle drivers and passengers. Recently, many new protocols were pro-posed to address problems introduced by the new commu-nication schemes that VANET enables, namely, Vehicle to Vehicle (V2V) communication and Vehicle to Infrastructure (V2I) communication. Routing is a particu-larly important issue since routes are changing all the time in both V2V and V2I communications. As a result, several routing protocols were proposed for different application needs [10]-[13]. However, no previous study provides a fair, accurate, and consistent evaluation.
The Wireless Signal Propagation Emulator developed by CMU [14] accurately emulates wireless signal propagation in a physical space. The emulator senses signals generated by known wireless sources through the antenna port, sub-jects the signals to the same effects that occur in a real physical space (e.g. attenuation, multi-path fading, etc), and feeds the combined signals back into wireless cards. The emulator, however, has limitations in reproducing arbitrary motion patterns. In addition, although the propagation sce-nario is more realistic, it is still artificially created as op-posed to be measured in real life.
Orbit [15] is a testbed that combines an indoor radio grid emulator and an outdoor field trial network. This testbed is available for use either via remote or on site access. As for mobility support, the outdoor testbed is grounded, while the indoor emulator only supports virtual grid mobility. D. Rastogi et al. present a comparison between AODV and OLSR, performed through the Orbit indoor testbed [16]. The result indicates that AODV performs better than OLSR in terms of stability. However, because the radio propaga-tion model differs from the real world, Orbit cannot simu-late wireless interferences.
The department of computer science at University Upp-sala has opened to the community the Ad hoc Protocol Evaluation Testbed (APE Testbed) [17]. APE is an en-cap-sulated execution environment with tools for post test-run data analysis, which is like a small Linux package with ad hoc configuration and network traffic analysis tools. Lundgred et al. used APE to evaluate the performance of AODV and OLSR with up to 37 nodes along indoor hall-ways and athletic fields in [18]. The result shows AODV performs better than OLSR in this high mobility scenario. To the best of our knowledge, there is no VANET experi-ments use APE testbed.
because realistic mobility in vehicle experiments is hard to replicate.
To summarize, recent testbeds provide convincing chan-nel conditions, but do not support repeatable, compli-cated mobility at the same time. In this paper, a novel ap-proach is used to perform parallel experiments. Thus the mobility and channel conditions do not need to be repro-duced in order to compare different routing protocols.
3. Overview of PepNet
When several experiments are performed simultaneously in a single run, even if mobility patterns and channel con-di-tions are not reproducible, experiments performed at the same time experience the same environmental conditions. The main objective of this study is to construct a platform for concurrent experiments.
Our platform has two design goals. (1) The platform is simple to setup with commodity equipments. (2) All pro-to-col and application implementations can be directly ap-plied in our platform without significant changes. A Parallel Experiment Platform for VANET (PepNet) is built to ad-dress these principles. PepNet has multiple virtual machines running on every mobile node. Each virtual machine runs one experimental configuration, and all virtual machines at a mobile node share hardware resources and have identical mobility. In additions, each virtual machine fulfills the sys-tem requirement for one experiment. The following sections first describe the hardware platform and subsequently the software setup details.
3.1. Hardware Platform
PepNet nodes are common commercial laptops with an Intel Core 2 Duo CPU, 2GB of RAM and a 120GB hard drive. Each laptop is instrumented with a Ubiquiti SRC wireless card with Atheros 802.11 wifi chipsets (AR5004). The Atheros 802.11 wifi chipset is supported by the open source Linux madwifi driver [22], which allows many cus-tomized settings including fixed channel selection, trans-mission power adjustment, and monitor mode support. For our experiments, all physical wireless cards are in ad hoc mode, using channel 1 only. The transmission power is set to the hardware supported maximum (19dbm). The wireless card is connected to a magnetic mount antenna with an 8dB nominal gain. Each laptop is also equipped with a GPS receiver to track the positions of the nodes during the expe-riments. Figure 1 shows an example of a node setup on a vehicle.
3.2. Software Platform
Each PepNet node runs the Linux Gentoo distribution (kernel version 2.6.21) patched with Xen [23][24] Xen is an open source industry standard virtualization environment that allows several virtual machines (Xen guests) to share hardware as shown in Fig. 2. One virtual network interface card (eth0) in every guest operating system and the physical
wireless card in the host operating system (Xen host) are connected together through a Linux virtual bridge. This bridge handles all incoming and outgoing wireless traffic, so Xen guests route as if they are directly connected to the wireless network interface. An advantage of the bridging approach is that Xen host needs not know what routing protocols are run in the Xen guest environment.
Fig. 1. Node setup on a vehicle
Fig. 2. Software Platform
In addition to the first bridge, a second bridge allows the communication between host and guest without interfering with experimental traffic. A preliminary experiments found time drifts between the Xen host and guests even with the synchronization Xen provided. For better time synchro-ni-zation, the second bridge enables the Network Time Proto-col (NTP) to correct the time drift between Xen host and guests clocks. The second bridge also passes geo-graphical information to Xen guests. The Xen host is con-nected to the GPS device by gpsd [25], an open source daemon that provides a network socket interface for re-trieving location information. Through the Ethernet bridge, Xen guests can access GPS information via gpsd. This al-lows the use of applications and protocols that require GPS information.
shows the source and destination of each scenario, and the processing performance at each interface.
4. PepNet Overhead Evaluation
Virtualization introduces two types of additional over- head, which may effect experiment results:
Virtualization Overhead: Virtualization adds an extra software processing layer between applications and hard-ware. In addition, hardware resources are used to run the virtual machines. Therefore, system performance is worse than a regular Linux system.
Sharing Overhead: When multiple virtual machines transmit at the same time, they contend for the same physical hardware. This contention lowers the maximum throughput the hardware can achieve and increases the packet drop rate. This section quantifies the "safe zone" of the PepNet such that the overhead does not significantly affect the validity of the experiment results.
4.1. Virtualization Overhead
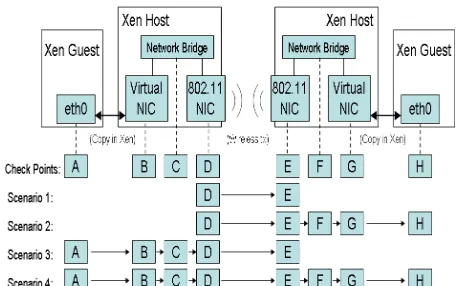
Figure 3 shows the end-to-end packet delivery process on the Xen virtual machine. After the physical wireless inter-face at the Xen host receives the packet, it is forwarded to a virtual interface via the virtual bridge at the Xen host. Then, every packet received at this virtual interface is copied to the destination Xen guest. Similarly, outgoing packets go through the reverse process and have additional processing overhead in the virtual environment.
Fig. 3. Virtualization Overhead experiment scenarios. The upper part
shows the packet delivery environment from one Xen guest to another
The bottleneck of our system was examined by con-si-dering four experiments: (1) Linux (Xen host) to Linux, (2) Linux to Xen guest, (3) Xen guest to Linux, (4) Xen guest to Xen guest. The Linux system here refers to the Xen host OS without running virtual machines in it. In every scenario, the sender generates and sends to the receiver bursty traffic of 10k and 100k UDP packets, each of which contains 1000 bytes payload. For every set of the scenarios, a "checkpoint" is set at every interface and both UDP send-er/receiver ap-plications. The experiment results are shown in Table 1 and Table 2.
Table 1. VM OVERHEAD EVALUATION (PACKET DELIVERY RATIO).
CheckPoint Sender A B C D E F G H Reciever
Scenario 1 (10K) 1 N/A N/A N/A 1 1 N/A N/A N/A 1
Scenario 2 (10K) 1 N/A N/A N/A 1 0.995 0.995 0.995 0.995 0.995
Scenario 3 (10K) 1 1 1 1 1 0.646 N/A N/A N/A 0.646
Scenario 4 (10K) 1 1 1 1 1 0.617 0.617 0.617 0.617 0.617
Scenario 1 (100K) 1 N/A N/A N/A 1 1 N/A N/A N/A 1
Scenario 2 (100K) 1 N/A N/A N/A 1 0.976 0.955 0.974 0.988 0.988
Scenario 3 (100K) 1 1 1 1 1 0.653 N/A N/A N/A 0.653
Scenario 4 (100K) 1 1 1 1 1 0.655 0.646 0.645 0.649 0.648
Table 2. VM OVERHEAD EVALUATION (LATENCY IN SECONDS).
CheckPoint Sender A B C D E F G H Reciever
Scenario 1 (10K) 4.596 N/A N/A N/A 4.596 4.628 N/A N/A N/A 4.628
Scenario 2 (10K) 4.683 N/A N/A N/A 4.679 4.724 4.724 4.724 4.724 4.720
Scenario 3 (10K) 4.678 4.623 4.623 4.623 4.621 4.797 N/A N/A N/A 4.811
Scenario 4 (10K) 4.434 4.431 4.431 4.429 4.428 4.503 4.503 4.503 4.503 4.602
Scenario 1 (100K) 51.78 N/A N/A N/A 51.784 51.832 N/A N/A N/A 51.831
Scenario 2 (100K) 54.899 N/A N/A N/A 54.896 55.055 55.055 55.055 55.055 60.052
Scenario 3 (100K) 49.489 49.489 49.486 49.485 49.485 51.289 N/A N/A N/A 51.264
Each column represents a different checkpoint, and each row represents the combination of the scenario and the traf-fic load. The (10K) and (100K) tags in each row represent the number of packets generated. Table 1 shows the packet delivery ratio, which is the number of packets received at a checkpoint divided by the number of packets generated at the sender. Table 2 is the interval between the first packet and the last packet received at every checkpoint in seconds. Theses numbers were collected by running the packet sniffer tshark [26] at every interface.
Comparing the packet delivery ratio sequentially at all interfaces in Table I, there is a steep decrease between checkpoint D and E in scenarios 3 and 4, where the packets originate from the Xen guest instead of the Xen host. On the contrary, when packets originate from Xen host in sce-narios 1 and 2, packets entering the outgoing interface D are suc-cessfully transmitted to checkpoint E with high probability. The transmission between checkpoint D and E is carried out by two 802.11 wireless cards. This shows that when bursty packets are generated on the same operating system as the physical interface, the Xen host has better scheduling to handle packets, so fewer packets are dropped at the wireless device.
Next, the reliability of the Xen system is considered. In-side the sending machine, there is no packet loss at any checkpoint, as shown in scenario 3 and 4. In addition, a test between the Xen host and guest using iperf shows the bandwidth between Xen host and guests are more than 8Gb/s, which is significantly larger than the wireless band-width. Therefore, the Xen host and guest communica-tion in the sending node is 100% reliable.
On the other hand, some packet loss is found inside the receiving machine, in scenario 2 and 4 with 100K bursty traffic. However, the total number of receiving packets at each interface is not always decreasing. From row scenario 2 (100K) and scenario 4 (100K) , columns G and H, more packets are received at the last interface than the virtual bridge. This contradictory result implies that tshark is probably not 100% accurate. The experiments show that tshark has at least 4% error, as some packets that are not sniffed at one interface appear later in another interface. Although this complicates the result, packet counts sniffed at every interface inside the receiving node are still close to each other. This suggests that after packets are received at the physical interface of the receiving node, they are deli-vered to the application with a high probability.
Table 2 shows the interval between the first packet and the last packet sniffed at every interface. This number re-mains fairly constant among all interfaces for every scena-rio. Because all interfaces besides the two wireless devices have little packet loss, the processing time at each virtual interface does not contribute much to the delay, according to queueing theory. It also implies the next bottleneck be-sides wireless devices processing in the experiments is the UDP packet generator. In addition, scenario 1 on row 1 and row 5 represents the performance of the native Linux sys-tem,
which shows the network interface card achieved 17.8Mb/s while transmitting 10k packets, and 15.4Mb/s while trans-mitting 100k packets.
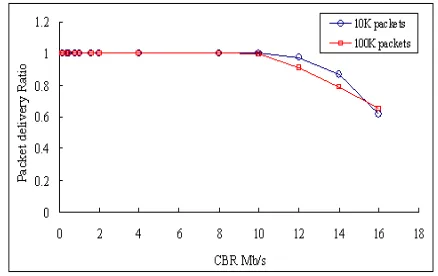
Finally, different loads of UDP Constant Bit Rate (CBR) traffic is used to examine the threshold of the system in order to find the "safe zone" to perform experiments. The CBR traffic is generated by the UDP application with 1000-byte packets with a fixed interval instead of bursty traffic. The network configuration is the same as scenario 4: traffic generated from one Xen guest and delivered to another Xen guest on a different node. The results are shown in Figure 4. The outgoing interface can handle at least 10Mb/s of traffic without introducing massive end-to-end packet loss. We conclude that the Xen system is reliable when the wireless traffic load is under 10Mb/s.
Fig. 4. Overhead introduced by Xen virtualization: packet delivery ratio
while performing the VM to VM experiment with different loads of CBR traffic.
4.2. Sharing Overhead
On our virtualized platform, multiple Xen guests share physical resources. It is therefore important to understand the maximum network load at which the sharing causes performance drops or excessive delays. In our setup, the Xen host connects multiple Xen guests to the physical net-work interface through a Linux network bridge. The oper-ating system provides a share of CPU time to the virtual machines, and thus to the read and write locks on the net-work bridge. The bridge queue policy is First In First Out (FIFO) coupled with the fair share of the locks that avoids starvation and provides fair sharing of the resources. This section exams the capacity when multiple virtual machines are run at a single node.
guests are located at a single Xen receiving machine. Every Xen guest run the same CBR traffic in every experiments. Each traffic is composed of 1000-byte payload UDP packets with a fixed interval determined by the aggregated throughput. Experiments finish when an aggregated 100k packets are sent.
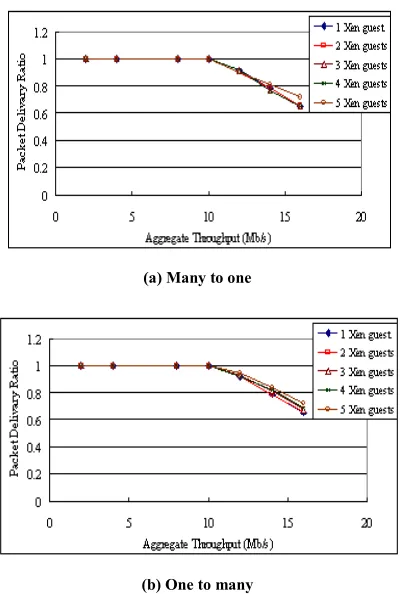
The first goal in this section is to understand how the number of Xen guests affects the network capacity. Figure 5 shows the packet delivery ratio with different numbers of Xen guests in both scenarios. The overall packet delivery ratios among different numbers of Xen guests are almost identical. This shows that the system can handle at least five concurrent virtual machines without introducing sig-nificant overhead. Moreover, in the one-to-many experi-ments, the packet delivery ratio slightly increases as the number of virtual machine increases. It is probably because running multiple applications slightly increases the packet genera-tion time. Therefore, the physical devices have longer time to handle each packet and in turn achieve higher delivery ratios.
(a) Many to one
(b) One to many
Fig. 5. Overhead introduced by Xen virtualization: packet delivery ratio as
a function of UDP CBR for multiple UDP flows generated at different virtual machines.
Another important issue is the fairness among the virtual systems when the network is fully loaded. Even though the number of virtual machine does not affect the aggregated throughput, the network resource may not be shared fairly. Figure 6 demonstrates the case of five concurrent virtual machines, where each line represents a different UDP flow. The packet delivery ratio for each UDP flow is defined as the packets received at the destination application layer divided
by the packets sent. When the traffic is under 10Mb/s, every sender attains close to 100% delivery. As the aggregate throughput increases, virtual machines start to contend for physical resources; consequently, all virtual machines suffer from similar percentage of packet loss. The maximum dif-ference of packet delivery ratio among all UDP flows in many-to- one experiments is 11%, where as the ratio is 6% in the one-to-many experiments. This shows that Xen pre-vents a single Xen guest from dominating the networking device when contention happens.
(a) Many to one
(b) One to many
Fig. 6. Xen fairness evaluation: packet delivery ratio for different Xen guest
pair while running 5 VMs in parallel.
To sum up, multiple Xen guests can utilize the bandwidth well if aggregated throughput is under 10Mb/s. When con-gestion happens, bandwidth is shared by all Xen guests with reasonable fairness.
5. Field Experiments
protocols. AODV is a reactive protocol, which allows it to perform better route selection than OLSR in a frequently changing topology [27]. This has been verified by numerous simulations and testbeds with limited mobility support. PepNet achieves the same conclusion in real world traffic, with fewer experimental resources.
5.1. Experimental Setup
The experiments were performed around the UCLA En-gineering IV building with eight different network confi-gurations described in the following subsections.
Table 3. Experiment Rounds Summary
Experiment Name AODV OLSR Interface Mobile Number
Round 1 X 1
Round 2 X 1
Round 3 X X 1
Round 4 X X 1
Round 5 X X 1
Round 6 X X X 1
Round 7 X X 2
Round 8 X X X 2
5.1.1. Xen Host Setup
Mactrace: Each Xen host ran a mactrace tool that broad-casts a hello beacon every 200 ms, which contains position and timestamp information. These hello beacons were used to construct the network connectivity matrix over time for best route investigations.
Tshark: Each Xen host ran tshark to log all packet sniffed at the wireless interface.
Synchronization: All the systems are synchronized via NTP. This allows temporal correlation among the trace logs with the precision of ten macro-seconds.
5.1.2. Xen Guest Setup
Routing Protocols: Each node, ran two Xen guests in ad-dition to the Xen host. One Xen guest ran an implementation of the ad hoc on demand distance vector routing (AODV) AODV-UU [28][29], and the other Xen guest used the Op-timized Link State Routing (OLSR) [30][31]. Tables 4 and 5 summarize the parameters of AODV and OLSR. These variables are based on the previous work in [16] and account for the vehicular scenario used in the experiments.
Table 4. AODV parameters
Hello message interval 500ms
Allow hello loss 2
Delete period 1s
Active route timeout 2s
Table 5. OLSR parameters
Hello message interval 500ms
Hello message validity time 1s
Topology Control (TC) message interval 1s
Topology Control (TC) message validity 2s
Network Traffic: A simple application generated a con-stant UDP stream of 50-byte data segments every 150ms. Each packet contained a packet sequence number and the timestamp when the packet was created. The traffic source and destination pairs are described in the next paragraph.
5.1.3. Topology and Interference Setup
Figure 7 shows the bird's-eye view of the physical to-pology setup. Four fixed nodes remained at the same place for all eight experiments. The antennas of these nodes were placed on top of a 1.5 meter stand to ensure good signal propagation. The mobile nodes were placed on vehicles and their antenna was placed on the top of the cars to avoid interference due to the automobile body. The four fixed nodes, represented by the {\it pin icon} in Figure \ref{fig_4}, were placed at the four corners of the building. The resulting rectangle was approximately 60 meters wide (East-West) and approximately 50 meters long (North-South). Each fixed node was in line of sight with the nodes placed at neighboring corners. Therefore, neighbor nodes were con-nected and diagonal connections are blocked by the build-ing.
Half of the experiments used two interference nodes in-dicated by the wave icon in Figure 7. These interference nodes generated layer-2 bursty broadcast traffic of random length uniformly distributed from 0 to 100 packets of ran-dom size uniformly distributed from 50 to 1000 bytes. After each burst, they idled for a random period of time uniformly distributed in the interval of [0,30] seconds.
Fig. 7. Bird’s-eye view of topology setting for all experiment rounds
5.1.4. Experiment Traffic Setup
the Xen guest which also ran AODV at the receiving ma-chine, and similarly with to OLSR.
In the single mobile node scenarios, the test traffic was generated from the mobile node and delivered to one of the four fixed nodes. After sending packet for two minutes, the UDP traffic paused for one minute, and then repeated the process to another fixed node in a round-robin manner. In the two mobile node scenario, both mobile nodes moved clockwise with different speeds. When two mobile nodes met, the faster mobile node overtook the slower one. The faster mobile node sent UDP stream to the slower mobile node for two minutes, paused for one minute, and then re-peated the same process. Each round lasted for 20 minutes, which contained seven 2-minute sub-sessions.
5.2. Experimental Result
This section covers three areas: (1) the mactrace tool showed the dynamics of the VANET experiment environ-ment, (2) sequential experiments with AODV and OLSR did not provide consistent performance comparisons, and (3) parallel experiments consistently provided comparable re-sults.
5.2.1. VANET Dynamics
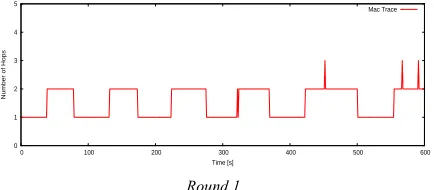
The network topology of the experiment is reflected by the optimal hop count, which is defined as the shortest hop count from one node to another. During the experiment, mactrace periodically broadcasted beacon packets. Every other node received the beacon packet and recorded the existence of a one-way connectivity at that time. Using the mactrace log, the network connectivity matrix was con-structed, and the shortest hop counts between any two nodes at any given time was obtained by running a shortest path algorithm.
Figure 8 shows the optimal hop count from the moving node to one fixed node in round 1 and round 2 for 10 minutes. Because the four fixed nodes formed a complete cycle, the theoretical optimal hop count is 2 hops. However, some uncontrollable factors such as other cars blocking the signal line of sight or random wireless noises interfered with the optimal route and resulted in unpredictable behavior. Ac-cording to Figure 8, the optimal hop count repeatedly al-ternated between 1 and 2, and occasionally reached 3 hops in both round 1 and round 2, the single-mobile-node scenarios. The result shows network topology looks considerably steady in these rounds.
Round 1
Round 2
Fig 8. Network connectivity: optimal hop count from mobile sender to one
fixed node over time for experiment round 1, 2
The two-mobile-node scenarios were more complicated, and the optimal hop count from the faster mobile node to the slower mobile node is shown in Figure 9. To quantify the difference between two rounds, 64% of the time in round 7 the optimal hop count was 1, while only 45% of the time in round 8 the optimal hop count was 1. Moreover, the topol-ogy change in round 8 happened more frequently than round 7. The optimal hop count in round 7 changed 58 times, while in round 8 changes it changed 84 times. If we consider a successful hop count change to be the one that lasts at least for 5 seconds, round 7 contained 6 successful hop count changes, while round 8 contained 13 successful hop count changes. This shows that even in a simple experiment en-vironment -- two cars circling four fixed nodes around a building --is still difficult to control the network topology.
Round 7
Round 8
Fig. 9. Network connectivity: optimal hop count from mobile sender to
another mobile receiver over time for experiment round 7, 8
5.2.2. Sequential Experiments
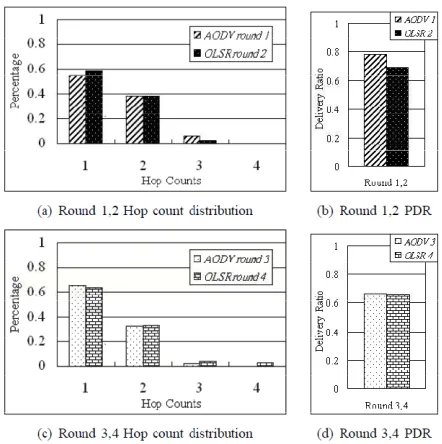
The experiment in rounds 1 through 4 study the perfor-mance comparison between AODV and OLSR, with and without the artificial interference signal. Experiment rounds 1 through 4 were run sequentially, and their results are shown in Figure 10. The performance metrics used here are the packet hop count distribution and the packet delivery ratio. The packet hop count is the number of hops that a successfully received packet takes to reach the destination. The packet delivery ratio is the total number of packets
0 1 2 3 4 5
0 100 200 300 400 500 600
Number of Hops
Time [s]
Mac Trace
0 1 2 3 4 5
0 100 200 300 400 500 600
Number of Hops
Time [s]
Mac Trace
0 1 2 3 4 5
0 100 200 300 400 500 600
Number of Hops
Time [s]
Mac Trace
0 1 2 3 4 5
0 100 200 300 400 500 600
Number of Hops
Time [s]
received divided by the total number sent.
Figures 10(a) and 10(c) show the packet hop count dis-tribution. In general, protocols with better route selection have a smaller hop count because they react to topology changes faster. Figure 10(a) shows that OLSR performed slightly better in hop count selection than AODV in a 20-minute experiment. On the other hand, 10(c) draws the opposite conclusion. The packet delivery ratio comparison for the first four rounds is shown in Figures 10(b) and 10(d) AODV had a better packet delivery ratio than OLSR, al-though in the first two rounds AODV performed 10% better and in the next two rounds AODV performed only 1% better. Therefore, even with considerably controlled mobility (one mobile node circling four fixed nodes), the environmental changes still increased experiment dynamics, and running single protocol experiments (no parallelization) for the purpose of evaluating alternate protocol was misleading. A traditional way to solve this problem is to ``even out" the external influences by repeating experiments multiple times with longer durations. However, performing real VANET experiments is costly.
Fig. 10. Non-parallel experiments: round 1 though 4
5.2.3. Parallel Experiments
This section shows that the experimental results of the four parallelized experiments provided better consistency than the sequential experiments.
Figure 11 shows the results of the parallel experiments in the-single-mobile node scenario, rounds 5 and 6. Figures 11(a) and 11(c) present the packet hop count distribution for both AODV and OLSR in experiments rounds 5 and 6, and Figures 11(c) and 11(d) show the packet delivery ratio. We note that AODV consistently outperformed OLSR in the single mobile node scenario because AODV exhibited better hop count selection and higher packet delivery ratio in both rounds. Moreover, this conclusion can be safely drawn only because both protocols experienced the same environment condition so the dynamic environment factors were
elimi-nated.
Fig. 11. Single mobile node parallel experiments: round 5 and 6
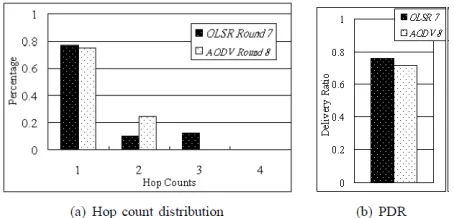
Next, consider the two-mobile-node scenarios that have uncontrollable connectivity patterns, as shown in Figure 8(b). The result in Figure 12 shows parallelized experiments still provided consistent results. Figure 12 shows the packet hop count distribution and the packet delivery ratio for both protocols in rounds 7 and 8. AODV still consistently out-performed OLSR both in terms of the hop count and the packet delivery ratio. This result shows parallel experiments delivered accurate result in a single experiment run even when the mobility pattern is uncontrolled.
Fig. 12. Two mobile node parallel experiments: rounds 7 and 8
8 was noisier than round 7 because the packet delivery ratio dropped by 15%. Suppose only protocol OLSR were eva-luated in round 7, and only AODV were evaeva-luated in round 8; then, after two 20-minute of experiments, OLSR would have outperformed AODV in both the packet delivery ratio and the hop selection, which would be a false conclusion, shown in Figure 13. This shows sequential experiments do not guarantee a controlled experiment environment, and paral-lelized experiments battle the uncontrollable experiment factors efficiently.
Fig. 13. False Evaluation: an incorrect result when two protocols running
in two sequential experiments are compared (OLSR Round 7/ AODV Round 8).
6. Conclusion and Future Work
A new virtual machine based testbed, PepNet, addresses the inconsistency issues in VANET performance evaluation. By running experiments concurrently, protocols or applica-tions encounter identical topology, channel condiapplica-tions, and external interferences, avoiding difficulties in reproducing identical environments. Besides, there are two additional benefits of running parallel experiments in virtual envi-ronment. First, virtual machines provide a complete oper-ating system so protocol implementations with different system requirements can be run in parallel. Second, expe-riments are performed with a single set of hardware, greatly reducing hardware cost. These benefits make virtualization a cost efficient way to conduct VANET experiments.
Another contribution of this paper is to understand the virtualization overhead so that experiments can be designed accordingly. Section IV shows that Xen can handle 10Mb/s traffic reliably. In addition, the checkpoint experiments show that the bottleneck is the wireless interface card lo-cated at the sender node. Our experiments also found the tshark error at the receiving virtual machine, which makes it hard to quantify the receiving node error rate. Experimen-tal results also show that when aggregate throughput does not exceed the threshold, Xen supports up to 5 parallel vir-tual machines without introducing significant overhead. It is our next goal to seek a solution for the high packet loss rate to improve the performance of virtual machines.
Finally, several field experiments demonstrated the im-portance of parallel experiments. With only two mobile nodes, the network topology is already quite complex and hard to reproduce. Sequential experiments in a simple sce-nario do not provide a consistent comparison result, while
parallel experiments provide consistency at all times. Our next goal is to perform medium scale experiments involving more than two vehicles in real urban environments and see whether parallel experiments still maintain consistency.
We plan to install multiple wireless cards in the Xen host, say WiMax, 3G and software defined radios, in addition to WiFi. This approach should enable opportunistic network-ing, with more sophisticated experiments for which paralle-lization will be critical.
Acknowledgements
To Be decided
References
[1] A. Festag, H. Hartenstein, A. Sarma and R. Schmitz, “FleetNet: Bringing carto-car communication into real world”, in Proc. 11th ITS World Congress, October 2004.
[2] M. Jerbi, S.-M. Senouci, M. Al Haj, “Extensive experimental characterization of communications in vehicular ad hoc networks within different environments”, in Proc. IEEE VTC 2007. doi:10.1109/WCNC.2008.577.
[3] R. Mangharam, J.J. Meyers, R. Rajkumar, D.D. Stancil, J.S. Parikh, H. Krishnan and C. Kellum, “A multi-hop mobile networking test-bed for telematics”, in Proc. SAE World Congress, 2005. citeseer doi: 10.1.1.65.9415.
[4] MyCarEvent Project “http://www.mycarevent.com/”.
[5] CVeT Testbed “http://www.vehicularlab.org/testbed.php”.
[6] C. Pinart, P. Sanz, I. Lequerica, D. Garc’?a, I. Barona, and D. S’anchez-Aparisi, “DRIVE: a reconfigurable testbed for advanced vehicular services and communications”, Tri-dentCom ’08, Innsbruck, Austria.
[7] Valery Naumov, Rainer Baumann and Thomas Gross, “An Evaluation of Inter-Vehicle Ad Hoc Networks Based on Realistic Vehicular traces”, MobiHoc ’06, May 22-25, 2006. doi:10.1145/1132905.1132918.
[8] E. Giordano, R. Frank, G. Pau, and M. Gerla, “Corner: a realistic urban propagation model for VANET”, in The Se-venth International Conference on Wireless On-demand Network Systems and Services (WONS), 2010. doi:10.1109/WONS.2010.5437133.
[9] K.C. Lee , S. Lee , R. Cheung , U. Lee and M. Gerla, “First Experience with CarTorrent in a Real Vehicular Ad Hoc Network Testbed”, in Proc. VANET MOVE, May 2007. doi:10.1109/MOVE.2007.4300814.
[10] J. Bernsen and D. Manivannan, “Unicast routing protocols for vehicular adhoc networks: A critical comparison and classification”, Pervasive and Mobile Computing 5 (2009) 1-18. doi:10.1016/j.pmcj.2008.09.001.
[11] C. Lochert, B. Scheuermann and M. Mauve, “Probabilistic Aggregation for Data Dissemination in VANETs”, VANET 2007:Proceedings of the 4th ACM International Workship on Vehicular Ad Hoc Networks. doi:10.1145/1287748.1287750.
hoc Networks Inter-Vehicle Geocast”, in Proc. 58th IEEE Vehicular Technology Conference, Orlando, USA, October 2003. doi:10.1109/VETECS.2003.1208832 .
[13] Y.C. Tseng, S.Y. Ni, Y.S. Chen, and J.P. Sheu, “The broadcast storm problem in a mobile ad hoc network”, Wirel. Netw., vol. 8, no. 2/3, pp. 153-167, Mar.-May 2002. doi:10.1023/A:1013763825347.
[14] CMU wireless emulator
“http://www.cs.cmu.edu/~emulator/”.
[15] ORBIT: Open-Access Research Testbed for Next-Generation Wireless Networks, “http://www.orbit-lab.org/”.
[16] Devashish Rastogi, Sachin Ganu, Yanyong Zhang, Wade Trappe, and Charles Graff, “A comparative study of AODV and OLSR on the ORBIT testbed”, Milcom 2007. doi:10.1109/MILCOM.2007.4455056
[17] APE testbed “http://apetestbed.sourceforge.net/”.
[18] R. S. Gray and D. Kotz, “Outdoor experimental comparison of four ad hoc routing algorithms”, MSWiM ’04. doi:10.1145/1023663.1023703.
[19] MIT ROOFNET “http://pdos.csail.mit.edu/roofnet/”.
[20] Berlin Roof Net (BRN)
“http://sar.informatik.hu-berlin.de/research/projects/2005-Be rlinRoofNet/berlin roof net.htm”.
[21] Microsoft Research: Mesh Networking “http://research.microsoft.com/en-us/projects/mesh/”.
[22] MadWifi project “http://madwifi-project.org/”.
[23] Xen “http://www.xen.org/”.
[24] Gentoo “http://www.gentoo.org/”.
[25] GPSD “http://gpsd.berlios.de/”.
[26] Wireshark “http://www.wireshark.org/”.
[27] P. Apparao, S. Makineni, D. Newell, “Characterization of network processing overheads in Xen”, VTDC ’06. doi:10.1109/VTDC.2006.3.
[28] AODV-UU “http://core.it.uu.se/core/index.php/AODV-UU”.
[29] RFC 3561: Ad hoc On-Demand Distance Vector (AODV) Routing.
[30] RFC 3626: Optimized Link State Routing Protocol (OLSR).