Design And Performance Analysis Of Subcarrier
Multiplexed Radio Over Fiber Optical
Transmission System
Kanchan Chaudhary, Dr. Kulwinder Singh MalhiAbstract : In this paper performance analysis of a subcarrier multiplexed (SCM) digital fiber optic transmission system is carried out in terms of BER, Q-factor and optical receiver sensitivity varying transmission SMF fiber length, bit rate, optical carrier power and number of multiplexed subcarriers. The SCM system design set-up employs low pass filter for optical detection of baseband signal and it is a comparatively simple and less costly design layout. The performance of the system is indicated in terms of BER and Q-factor by varying the transmission fiber length from 5 to 50 km. The reported results show BER and Q-factor are observed in a range 0.58 ×10⁻¹⁹ to 93.1 × 10⁻¹⁹ and 9.05 to 8.48 respectively. Similarly, by varying transmitted bit rate from 1 to 10 Gb/s BER and Q-factor are observed in a range 1.73×10⁻¹⁴ to 2.93×10⁻¹⁹ and 7.57 to 8.88 respectively. Similarly, analysis of transmitted input optical power 1 to 20 dB has been obtained Q-factor and BER in a range of 6.91 to 6.79 and 4.43 ×10⁻²⁰ to 1.94 ×10⁻²⁰ respectively. Furthermore, optical receiver sensitivity analysis is shown 10.23 to 8.34 dBm range by increasing number of RF subcarrier multiplexed subscribers 1 to 16. The indicated performance investigations are a novel contribution to the practical SCM RoF system design.
Keywords: Subcarrier Multiplexing (SCM), Radio Over Fiber (RoF), Phase Shift Keying (PSK), Optical Receiver sensitivity, Carrier to Noise Ratio(CNR).
————————————————————
1.
INTRODUCTION
An efficient capacity exploitation of optical fiber
transmission systems can be improved further by employing transmission multiplexing techniques such as wavelength division multiplexing (WDM) and time division multiplexing (TDM). The high speed WDM and specifically TDM optical system suffers from chromatic dispersion, non-linear crosstalk and polarization-mode dispersion (PMD) impairments. WDM technology uses low bit rates and power in each channel wavelength by spreading the transmission capacity into various channels. Further, to control the efficiency of bandwidth utilization, subcarrier multiplexing can be used. SCM has better spectral efficiency because multiple RF channels can be transmitted at a single optical channel wavelength. Optical subcarrier multiplexing (SCM) is a low frequency level multiplexing scheme where a number of signals at radio frequency (RF) range are multiplexed and resulting composite signal is further modulated on a high frequency optical carrier for transmission in a fiber. The RF signals are known as subcarriers and these can be modulated by information signals employing advanced modulation techniques due to availability of matured microwave technology. SCM has some advantage compared to other multiplexing WDM and TDM techniques. First of all, SCM is inherent broadcasting technique and is it is frequently employed for digital video broadcasting systems. SCM is flexible and provides upgradability in the design of broadband networks [7]. There is no need for synchronization between each channel and a high-speed network. SCM is relatively a simple technique and it has high receiver sensitivity. The total usable bandwidth is restricted by large modulation bandwidth of semiconductor laser and high speed response of photodiodes.
Subcarrier multiplexing (SCM) with wavelength division multiplexing (WDM) has been developed to increase the transmission capacity of existing optical communication system [1]. It has been find out that, SCM employing optical single side band OSSB modulation PSK at subcarrier level gives comparatively good performance improvement compare to ASK/FSK in terms of higher spectral efficiency and its demodulation [2]. It is possible to increase number of subscribers, bit rate, fiber length to further improve system performance [3]. Moreover, it has been analyzed that subcarrier multiplexing at various data rate provides high capacity transmissions at lower costs for Radio over Fiber (ROF) systems which enable fiber based wireless access system [4]. The improvement of BER can be done by using QAM modulation and components of ROF systems. The implementation of ROF technology and the WLAN of IEEE 802.11a standard using 64 QAM modulation provide more reliability by reducing BER as compared with IEEE 802.11a with wireless feeder network. This provides more flexibility in the case of future requirements such as other extension to the system to obtain more capacity and larger area coverage [8]. Researchers have find out that an optical beat Interference (OBI) limits the number of subcarriers that can be multiplexed in an optical channel while employing NRZ, Manchester line coding and Miller codes [10]. An analysis of comparative performance of the three line coding in an SCM-WDM system in which limitations of OBI can be reduced by employing miller
codes. The bidirectional radio over fiber (RoF)
communication system should be designed for different RF sub-carriers to observe impact of cross talk on system parameters i.e., bit error rate (BER), Q factor and signal to noise ratio (SNR). To reduce crosstalk among RF sub-carriers, the carrier frequency and channel frequency spacing are carefully chosen for simulative model of ROF system [5]. When numbers of channel are increased then level of crosstalk increases and degrades overall performance of simulative model and decreases the Q factor and increases BER. To investigate the performance of SCM optical transmission system, the paper has been organized as follows. In this introduction section 1 after
__________________
Kanchan Chaudhary is currently pursuing masters degree
programme in Department of Electronics & Communication Engineering Punjabi University Patiala, India, PH-01753046338. E-mail: [email protected]
Dr. Kulwinder Singh Malhi is currently working as Associate
3721
elaborating recent work various theoretical concepts are briefly discussed. Section 2 gives SCM system set-up design layout and description its various components with selected parameters. Further, Section 3, shows various results obtained by designed system set-up and under certain constraints and these are discussed with recent work from literature. Finally section 4, concludes the results and inferences are drawn. While investigating the performance of SCM system receiver sensitivity is main parameter at optical receiver and signal to interference
ratio. Moreover, according to power budgeting
considerations at which receiver sensitivity is defined as lowest power level which can detect RF signal and demodulate data. To achieve a minimum BER at Q = 6, minimum optical signal power required can be expressed in equation 1[9].
( )
where, receiver electrical bandwidth Be is determined by
the data rate per RF channel, x = 2 for PSK modulation, h is the Planck’s constant, F is the noise figure and mk/√ζ ≤
1/N is an identical modulation index for all RF channels in which 0 ≤ ζ ≤ 1 is the power suppression ratio of the carrier and mk is the normalized modulation index.
Further, system performance also depends on the SNR associated with the demodulated signals. In the case of SCM systems, the carrier-to-noise ratio (CNR) is parameter selected to represent SNR. The CNR is defined as the ratio of RMS optical carrier power to RMS noise power at the receiver and can be written as
( )
( )
Where m is the modulation index, R is the detector responsively, P is the average received optical power and σs , σT , σI, and σIMD are the RMS values of the noise
currents associated with the shot noise, thermal noise, intensity noise, and intermediation distortion respectively.
2.
Simulation Set-Up
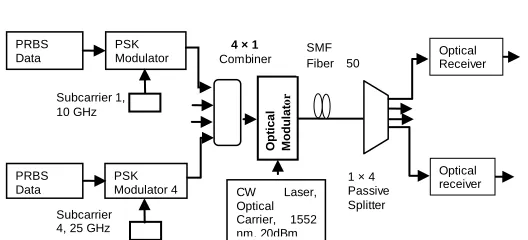
Figure 1: Simulation Set-Up of 4 channels SCM ROF Optical Transmission System
A simulation set-up shown in fig. 1 has been designed for four subcarrier multiplexed to generate a composite signal for optical fiber transmission system. At optical transmitter, four different pseudo random bit sequence (PRBS) data sources generate baseband signals at a bit rate of 1Gbps. These baseband data bit streams are PSK modulated individually on electrical modulators on microwave RF subcarriers having frequencies 10, 15, 20 and 25 GHz.
Each modulated subcarrier signals are passed through band pass Bessel filter to eliminate the unwanted frequencies. These filtered signals are then combined using electrical 4×1 power combiner and this combined composite signal is then MZ modulator phase modulated on optical carrier wave. Optical carrier wave is generated by a CW laser of frequency 1552.52 nm with a power of 20 dBm. This modulated carrier signal is transmitted through the single mode fiber of length 50 km. At other end of SMF fiber, an optical 1 × 4 passive power splitter split the PSK modulated signal in to four branches. To eliminate ASE noise, each branch signals are passed through a 50 GHz bandwidth Bessel band pass optical filter. Further to detect and demodulate the received optical signal incident on photo detectors which will convert these optical signals directly into electrical signals. LPFs are used to filter out the higher frequency components. And at the outputs of LPFs we will get data which was initially transmitted. Then at the receiver end an eye diagram analyzer has been used to investigate the performance of the system in terms of BER and Q-factors.
Table 1: Selected Parameters Values
S.
No. Parameter Selected Value 1. No of subcarriers 4
2. Subcarrier Frequencies 10, 15, 20 and 25 GHz
3. Transmitted Bit Rate 10 Gb/s 4. Optical light carrier
wavelength 1552.52 nm 5. Input optical power 20 dBm
6. Fiber length 50 km
7. Optical receiver PIN Photo diode 8. Responsivity 1 A/W
9. Bessel low pass filter
cut-off frequency 150 THz
Subcarrier 4, 25 GHz
CW Laser, Optical Carrier, 1552 nm, 20dBm PRBS Data source 1 PRBS Data source 4 PSK Modulator 1
4 × 1
Combiner PSK Modulator 4 Subcarrier 1, 10 GHz O p tic a l M o d u la t o r Optical Receiver 1 Optical receiver 4
3.
RESULTS AND DISCUSSION
The spectrum of MZM optically modulated signal, which is launched into 50 km SMF fiber for transmission, is shown in fig. 2. It is evident from it that the signal spectrum has peak value at 1552.52 nm wavelength and various associated peaks of different subcarriers.
Figure 2: Composite spectrum optical modulated signal
To analyze the system first of all, Q factor analysis has been carried out at various lengths of SMF transmission fiber in a range of 5 to 50 km and resulting values are tabulated as shown in table 2 as well as graphically presented in fig.3. It is observed that by varying the optical fiber link length Q-factor deteriorates from 9.05 to 8.48 by increasing the SMF fiber length due to transmission characteristics such as power attenuation and group velocity dispersion. Further, BER analysis of the link also indicated in table 2.
Figure 3: Q-factor Vs SMF length passive at Optical Splitter at Port 1.
Table 2: SMF Fiber length with BER and Q-Factor of received signal
S.No. SMF fiber Length (km)
BER of
received signal (x 10-19)
Q-Factor
1. 5 0.589 9.05
2. 10 4.69 8.88
3. 15 17.5 8.67
4. 20 38.7 8.58
5. 25 61.1 8.53
6. 30 78.4 8.50
7. 35 88.7 8.48
8. 40 93.3 8.48
9. 45 94.3 8.47
10. 50 93.1 8.48
It can be noticed that BER measured by BER analyzer of the received signal also increases around 0.58 ×10⁻¹⁹ to 93.1 × 10⁻¹⁹ with the variations SMF fiber length in the same range graphically shown in fig 4.
Figure 4: BER Vs SMF length passive at Optical Splitter at Port 1
This analysis indicates that the performance of a SCM system is satisfactory and subcarriers can be successfully detected at the optical receiver. Further, transmitted bit rate analysis has been presented in terms of BER and Q – factor. The SCM system bit rate is varied in a range of 1 to 10 Gb/s and resulting BER and Q-factor for the output at port 1 as shown in fig. 5 and fig.6. It has been observed BER deteriorates from 1.73×10⁻¹⁴ to 2.93×10⁻¹⁹ with the increased value of transmitted bit rate as shown in fig 5. Similarly there is also observed an increase in the Q-factor from 7.57 to 8.88 by increasing the optical bit rate value of system as shown in fig. 6. If the Q factor is higher then the error rate is low which improves the quality of the system.
3723
Figure 4: Q-factor versus Transmitted Bit Rate
Table 3: BER Vs Optical Input Optical Power
S. No. Input Power (dBm)
BER ( × 10-16)
CH1 CH2 CH3 CH4
1. 2 4.38 0.000589 9.72 0.000241 2. 4 0.00061 0.00046 1.14 0.000319
3. 6 0.0281 0.0175 108 0.000420
4. 8 0.131 0.0387 309 0.000523
5. 10 0.134 0.0611 181 0.000443
6. 12 0.183 0.0784 128 0.000321
7. 14 0.277 0.0887 102 0.000261
8. 16 0.422 0.0933 89.2 0.000227 9. 18 0.624 0.0943 81.4 0.000206 10. 20 0.877 0.0931 76.7 0.000194
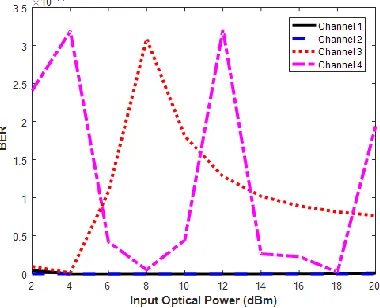
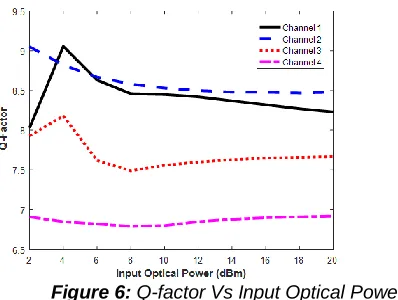
Furthermore, transmitted optical power analysis is carried out in terms of system performance metrics. The graphs in fig. 5-6 are plotted to analyze 4 channel SCM signals performance in terms of maximum Q-factor and minimum BER by varying the transmitted input power upto 20 dBm . It shows that BER will be always around zero for output at port 1 and 2 whereas it varies maximum for port 3 from 9.72×10⁻¹⁶ to 76.7×10⁻¹⁶ and for port 4 from 2.14×10⁻¹² to 1.94 × 10⁻¹² as shown in fig 5.
Figure 5: BER versus Input Optical Power
Table 4: Q-Factor With Optical Input Optical Power
S. No.
Input Power (dBm)
Q- factor
CH1 CH2 CH3 CH4
1. 2 8.03 9.05 7.93 6.91
2. 4 9.055 8.82 8.18 6.85
3. 6 8.63 8.67 7.62 6.82
4. 8 8.46 8.58 7.49 6.79
5. 10 8.45 8.53 7.56 6.8
6. 12 8.42 8.5 7.6 6.85
7. 14 8.37 8.48 7.63 6.88
8. 16 8.32 8.48 7.65 6.9
9. 18 8.27 8.47 7.66 6.91
10. 20 8.23 8.48 7.67 6.92
Figure 6: Q-factor Vs Input Optical Power.
Further , optical receiver sensitivity at receiver output have been investigated with varying number of RF subcarriers to make composite microwave modulating signal to be modulated on optical carrier. Table 5 and fig. 7 present receiver sensitivity at number of RF subcarrier from 1 to 16.
Table 5: Optical receiver sensitivity with Number RF carriers
S. No. No. of RF Subcarriers
Optical Receiver Sensitivity (dBm)
1 1 10.231
2 2 10.233
3 3 10.083
4 4 9.631
5 5 9.798
6 6 9.582
7 8 9.464
8 10 8.688
9 12 8.503
10 16 8.366
Figure 7: Optical receiver sensitivity with number of RF subcarriers Multiplexed
It can be observed that receiver sensitivity at the output decreases from 10.23 to 8.34 dBm by increasing the number of RF carriers from 1 to 16. This receiver sensitivity degradation performance effects due to optical inter modulation beat noise; chromatic dispersion and nonlinear crosstalk’s increase with number of RF carriers. But minimum 8.34 dBm power range of sensitivity for 16 RF
carriers is higher than minimum required value for PIN photodiode optical detection.
IV. CONCLUSION
In this work a design and performance analysis of subcarrier multiplexed (SCM) Radio over fiber (RoF) optical communication system has been carried out under different parameters such as transmission SMF fiber length, bit rate and optical modulated power in terms of BER and Q-factors. Firstly, results presented show that, Q-factor and BER deteriorates from 9.05 to 8.48 and from 0.58 ×10⁻¹⁹ to 93.1 × 10⁻¹⁹ respectively of the received signal by varying
SMF transmission fiber length in a range of 5 to 50 km. Similarly, Q-factor and BER improve in range of from 7.57 to 8.88 and from 1.73×10⁻¹⁴ to 2.93×10⁻¹⁹ respectively by increasing transmitted bit rate in range of 1 to 10 Gb/s. Furthermore, performance deteriotare Q-factor and BER improve in a range of from 6.91 to 6.79 and 4.43 × 10⁻²⁰ to 1.94 × 10⁻²⁰ respectively by varying the transmitted input optical modulated power from 1 to 20 dBm. This
performance analysis shows that investigations
deterioration and improvement are very helpful for a design of the high capacity SCM system in the modern day society. In spite of the above, a optical receiver sensitivity analysis also has been performed of the SCM system by varying the number multiplexed subcarriers which would be a big insight for its working and capacity handling of high transmitted traffic load. The analysis indicates the optical receiver sensitivity degrades from 10.23 to 8.34 dBm by varying number of multiplexed RF subcarrier 1 to 16. Thus, it clearly shows that performance of the SCM system can be enhanced with optimum fiber length typically greater than 50 km, for bit rate 10 Gb/s and optical power 20 dBm. Furthermore the investigated system performance is quite satisfactory in terms of receiver sensitivity and RF subcarrier greater 16 can be employed to be multiplexed in electrical domain before modulating on optical carrier light wave. The results presented here show a comparatively better performance to the previous work reported in the literature [3]. Further, in future work of the system, design considerations such as group velocity dispersion, finer nonlinearities can be included and system can be analyzed for higher value of investigated design parameters.
REFERENCES
[1] A. Jha, S. Agarwal, V. Paul and S Sugumaran, ―Performance analysis of WDM and SCM using available modulation techniques,‖ in International Journal for Scientific Research and Development, vol. 2, no.1, 2014.
[2] S. Revathi and G. Aarthi, ―Performance analysis of Wave Length Division and Sub Carrier Multiplexing using different modulation techniques,‖ International Journal of Engineering Research and Applications (IJERA), vol. 1, no. 2, 2014.
[3] J. Kumar, M. Bharti and Y. Singh, ―Effect of signal direct detection on Sub Carrier Multiplexed radio over fiber system,‖ International Journal of Advanced Research in Computer and Communication Engineering, vol. 3, no. 1, January 2014.
3725
systems,‖ International Journal of Advanced Research
in Electronics and Communication Engineering
(IJARECE), vol. 2, no.10, Oct. 2013.
[5] S. Singh and A.l Singh, ―Simulative analysis of influence of RF sub carriers on performance of 10 GHz-band bidirectional radio over fiber (RoF) system,‖ Journal of Scientific and industrial Research, vol.6, pp. 21-26 Jan. 2010.
[6] R. Hui, B. Zhu, R. Huang, C. T. Allen, K. R. Demarest and D. Richards,― Subcarrier Multiplexing for high-speed optical transmission,‖ Journal Of Lightwave Technology, vol. 20, no. 3, March, 2002.
[7] Aparna R. and S. A. Chandran ―Performance Analysis of Optical Communication System using Wavelength Division and Sub Carrier Multiplexing,‖ International
Journal of Engineering Research & Technology (IJERT), vol. 4, no. 01, January, 2015.
[8] S. Elfaki, I. Khide, M. Omer, F. Almomen and A. Abduallah, ―Evaluation of Bit Error Rate (BER) in WLAN IEEE 802.11a with Radio over Fiber (RoF) downlink system,‖ 978-1-4577-1169-5/11, International conference on high capacity optical networks and emerging technologies, IEEE 2011.
[9] G.P. Agrawal,‖ Fiber Optic Communication system,‖ John Wiley & Sons Inc., New York, 3rd Edition, 2002. [10] M. S. Reza, M. M. Hossain, A.A. Chowdhury, S. M. S