FORMULATION, CHARACTERIZATION AND EVALUATION OF
SUSTAINED RELEASE NIFEDIPINE CAPSULE.
1
Kanika Arora*, 1Meenu Nagpal, 1Upendra K. Jain, 2R. C. Jat, 3Dr.Suman Jain
1
Department of Pharmaceutics, Chandigarh College of Pharmacy, Landran, Mohali. 2
Department of Pharmaceutics, ShriRam College of Pharmacy, Banmore, Morena. 3
School of Studies, Jiwaji University, Gwalior.
ABSTRACT
The present work was aimed at exploitation of hydrophobic polymer Ethyl Cellulose for sustained delivery of Nifedipine, further, at achieving sustained release for the period of 12 hours. Five different formulations of nifedipine matrix granules with different amounts of the polymer ethyl cellulose and drug in the ratio of 1:1, 2:1, 3:1, 4:1 and 5:1 were prepared by wet granulation and the resultant granules were filled in size „2‟ hard gelatin capsules. The FT-IR spectra of the pure drug and formulation F3 indicated no chemical interactions between the drug and carrier used. The resultant granulations exhibited acceptable particle size distribution and good flow properties. Capsules prepared by using these granulations exhibited desirable pharmacotechnical properties. The average particle size of granules was found to be in the range of 500-841μm. The results of dissolution study of formulations F1, F2, F3, F4, F5 showed 84.77% in 6 hrs, 89.63% in 8 hrs, 89.57% in 12 hrs, 58.96% in 12 hrs and 52.14% in 12 hrs respectively. And therefore, formulation F3 with drug – polymer ratio 1:3 was found to be most promising formulation as it showed sustained release (89.57%) as well as maintained excellent matrix integrity during the period of 12 hr study. The optimized formulation (F3) selected from the % drug release profiles was fitted into various kinetic models to know the mechanism of drug release from this formulation. The best fit release kinetic model was found to be Higuchi for F3, which indicated release of the drug by difussion from matrix type formulation. Drug release study supported the study hypothesis that as a result of formation of a nifedipine molecular dispersion, nifedipine dissolution inside the matrix was no longer the rate-limiting step for drug release, and the
Volume 3, Issue 10, 1063-1087. Research Article ISSN 2277– 7105
Article Received on 27 September 2014,
Revised on 23 Oct 2014, Accepted on 18 Nov 2014
*Correspondence for
Author
Kanika Arora
Department of
Pharmaceutics,
Chandigarh College of
Pharmacy, Landran,
drug diffusion in matrix through the channels formed by dissolution of lactose became the slowest step instead. Indeed, the results offered formulation researcher a cheaper option that incurs no additional cost that may arise if a material is to be replaced because of the need to improve on response parameters such as dissolution and drug release. The results o f the present study indicate that the granules prepared using ethyl cellulose could be used for the sustained release of the drug. Therefore, it was also concluded that Ethyl cellulose can be successfully used to modulate drug release of poorly water soluble drug Nifedipine in sustained release inert matrices.
KEYWORDS: Nifedipine, sustained – release, ethyl cellulose, molecular dispersion,
enhanced solubility.
INTRODUCTION
the supposed granules [6] having a diameter between 0.5 and 2.5 mm [7] was filled into hard shell gelatin capsule.
MATERIALS AND METHOD
Chemicals and Reagents
Nifedipine was procured from Suchem Laboratories, Ahemdabad, Ethyl cellulose was supplied CDH (P) Ltd, New Delhi and other ingredients used like lactose, dichloro methane, ethanol, maize starch, talc, etc were of analytical grade.
Preformulation Studies
Physical description - In evaluating the physical properties of the Nifedipine, its colour was
observed.
Identification of the Drug
Infrared red spectroscopy (FTIR-8400) - The infrared spectra of the procured samples were obtained on a Fourier transform Infrared spectrophotometer [(FTIR-8400) Shimadzu, Japan] in order to identify them by comparing their spectra with that of the respective reference standards.
Procedure: The samples were first ground gently in a mortar and mixed with KBr in the ratio
of 1:10. Scans were obtained at a resolution of 2 cm−1, over a frequency range of 4000 to 400 cm−1. [8]
Loss on Drying (at 105 °C) for 2 hrs – This parameter was tested to calculate the moisture
content of the samples.
Procedure: 1 gm of the sample was weighed accurately. A glass-stoppered shallow
weighing bottle that has been dried for 30 minutes under the same conditions to be employed in the determination was tared. The test specimen was put in the bottle, the cover was replaced and the bottle and the contents were weighed accurately. The loaded bottle was placed in the drying chamber (LOD Oven) by removing the stopper and leaving it also in the chamber. The test specimen was dried at 105 °C and for 2 hrs. [9]
Note: Upon opening the chamber close the bottle promptly and allow it to come to room
Calculation
W2 - W3
% Loss on drying = --- x 100 W2 - W1
Where,
W1 = Weight of the empty bottle in grams.
W2 = Weight of the bottle with sample in grams (Before drying)
W3 = Weight of the bottle with sample in grams. (After drying) – As time specified.
Physico-chemical Properties
Melting point -
The sample was loaded into a sealed capillary and heated electrically via a heating block controlled by a digital temperature controller. Samples in capillaries were inserted from the top and observed from the eyepiece which has a magnifier. And the melting temperature range of the sample was recorded by recording the thermometer reading. [10]
Solubility - Different solvents were prepared according to the procedure given in I.P. Procedure: Drug was added in excess in 3 ml of each solvent (acetone, methylene chloride,
chloroform, ethyl acetate, methanol, ethanol and water in separate test tubes .The test tubes were kept in ultrasonicator for 15 minutes and on mechanical shaker for 6 hrs. for equilibration. After 6hrs contents of each test tube were filtered, suitably diluted and analysed for the drug content using UV spectroscopy. [11]
Flow Properties –
Bulk density: Apparent bulk density was determined by placing pre-sieved samples in to a
graduated cylinder and measuring the volume and weight as it is. Bulk density = weight of powder/ volume of powder
Tapped density: Tapped density was determined by USP method II. Sample was filled in
100 ml graduated cylinder of tap density tester which was operated for fixed number of taps until the powder bed volume has reached a minimum, thus was calculated by formula: Tapped density = weight of powder/ tapped volume of packing
Angle of Repose: Angle of repose of the samples was determined by the funnel method
allowed to flow down on a graph paper fixed on a horizontal surface and angle of repose was calculated using the formula,
Tan θ = D/ 2h Where, h and D are height and diameter of the pile respectively.
Flow of Powders with Angle of Repose values
Angle of repose (degrees) Type of flow < 20 Excellent
20-30 Good
30-34 Passable* > 40 Very poor *May be improved by glidant
Partition coefficient - Partition coefficient of nifedipine was determined at 37 ± 0.5 °C by taking 10 ml of octanol which was saturated with 10 ml of phosphate buffer (pH7.2) by shaking with externally driven magnetic stirrer. After shaking the system remained undisturbed for half an hour. About 10 mg of drug was added to this solution and was shaken on wrist action mechanical stirrer. Two layers were separate through separating funnel and filterer through Whatman grade filter, and the amount of nifedipine solubilized, was determined by measuring the absorbance at 338 nm against reagent blank through double beam UV/Vis spectrophotometer (Shimadzu) in both the solution. Partition coefficient was determined as ratio of concentration of drug in octanol to the concentration of drug in phosphate buffer (pH 7.2) and the value were reported as log P.
Concentration of drug in non aqueous phase Ko/w = –––––––––––––––––––––––––––––– Concentration of drug in aqueous phase
Drug- excipient compatibility study: Fourier Transform Infrared Spectroscopy (FT-IR)
FT-IR spectroscopy was carried out to check the compatibility between the drug and the polymer.FTIR, was performed onsamples of nifedipinepure drug(A), solid admixture of nife dipineandethylcellulose(B).The IR Spectra of the test samples were obtained using KBr disk method.
Procedure: For this the samples were first ground gently in a mortar and mixed with KBr in
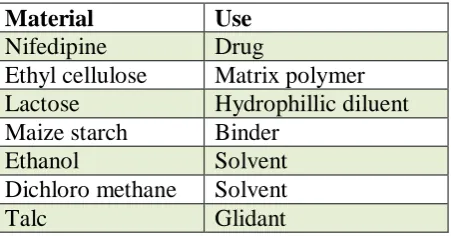
Formulation Design
Formulation ingredients
Material Use
Nifedipine Drug
Ethyl cellulose Matrix polymer Lactose Hydrophillic diluent Maize starch Binder
Ethanol Solvent
Dichloro methane Solvent
Talc Glidant
Five different formulations of nifedipine matrix granules with different amounts of the polymer ethyl cellulose (6.67 %, 13.33 %, 20.00 %, 26.67 % and 33.33 %) were designed and prepared. The granules were prepared using ethyl cellulose with the drug in the ratio of 1:1, 2:1, 3:1, 4:1 and 5:1. Five (5) different batches of granules with different ratios of polymer (Table 1) were prepared by the wet granulation method.
[image:6.595.187.413.112.230.2]
Table 1. - Composition of sustained release Nifedipine granules
Ingredients Formulation Code
F1 F2 F3 F4 F5
Nifedipine (mg) 20 20 20 20 20
Ethyl cellulose (mg) 20 40 60 80 100
Lactose (mg) 195 175 155 135 115
Dichloro methane q.s. q.s. q.s. q.s. q.s.
Ethanol q.s. q.s. q.s. q.s. q.s.
Maize Starch (mg) 60 60 60 60 60
Sun set yellow (mg) 0.15 0.15 0.15 0.15 0.15
Talc (mg) 5 5 5 5 5
Total weight (mg) 300 300 300 300 300
Preparation of Granules
Step 1: Dry powder screening and blending- All the ingredients were weighed accurately according to the formulation batch and passed through a 35-mesh sieve. Nifedipine (active ingredient), ethyl cellulose (polymer) and lactose (filler) were mixed in a cubic mixer (Erweka, Germany).
Step 2:Granule preparation
solution of maize starch dissolved in ethanol-dichloro methane in the ratio of 1:1 v/v q.s. The resulting granules were dried in the Glatt at 40ºC for 30 minutes.
Step 3 :Dry Sifting – The dried granules were made to pass through sieve 20# and 30# mesh
and granules retained on 30# mesh were collected
Filling of Capsules
The collected granules were filled into size “2” hard gelatin capsules to obtain 20 mg Nifedipine / capsule.
Evaluation Study of Blend
Description: The blend was physically checked for colour, uniformity of blending, absence
of lumps and foreign particles.
Loss on Drying (at 105 C) for 2 hrs – To calculate the moisture content of the blend, 1 gm of
the blend was weighed accurately. A glass-stoppered shallow weighing bottle that has been dried for 30 minutes under the same conditions to be employed in the determination was tared. The blend was put in the bottle, the cover was replaced and the bottle and the contents were weighed accurately. The loaded bottle was placed in the drying chamber (LOD Oven) by removing the stopper and leaving it also in the chamber. The blend was dried at 105 °C and for 2 hrs [9].
Calculation
W2 - W3
% Loss on drying = --- x 100 W2 - W1
Where,
W1 = Weight of the empty bottle in grams.
W2 = Weight of the bottle with blend in grams(Before drying) W3 = Weight of the bottle with blend in grams. (After drying)
Bulk density: Apparent bulk density was determined by placing pre-sieved drug excipient
Tapped density: Tapped density was determined by USP method II. The blend was filled in
100 ml graduated cylinder of tap density tester which was operated for fixed number of taps until the powder bed volume has reached a minimum, thus was calculated by formula
Tapped density = weight of blend/ tapped volume of packing
Angle of Repose: Angle of repose of the blend was determined by the height cone method. A
funnel was fixed to a desired height and the blend was filled in it. It was allowed to flow down on a graph paper fixed on a horizontal surface and angle of repose was calculated using the formula, Tan θ = D
2h
Where, h and D are height and diameter of the pile respectively.
Blend Uniformity: Blend uniformity was determined to confirm the uniform mixing of the active ingredient (nifedipine) in the blend.
Standard preparation: Accurately weighed 50 mg nifedipine working standard was transferred in 100 ml volumetric flask. To it 50 ml methanol was added and From the above solution, 2 ml of the solution was pipette out into 25ml volumetric flask and the volume was made up by methanol.
Sample Preparation: Accurately weighed 600 mg (equivalent to 2 dosage units) was taken and dissolved in 20ml of methanol using a 100ml volumetric flash. This was sonicated for about 10 min or more until a clear solution is obtained. The flask was then made up to volume with more methanol, and the solution was filtered through what man No. 1 filter paper. 5ml of the filtrate was again taken & diluted to 50ml with methanol. Similarly 9 other samples were prepared.
Procedure: The standard and sample preparations were filtered through Whatman filter
paper grade 1 at each step and the absorbance was read at 350 nm on Ultra – violet spectrophotometer using methanol as blank.
Calculation
% Nifedipine
WS = Weight of standard preparation
P = Potency of nifedipine working standard
Dissolution (Nifedipine) by UV
Chemicals and Reagents Required: Potassium dihydrogen phosphate, sodium hydroxide, potassium chloride, concentrated hydrochloric acid, potassium bipthalate and polysorbate 80. Preparation of Buffer pH 1.2 (HCl – KCl) : Accurately weighed 14.9 g of potassium chloride was dissolved in 500 ml water, to which 13 ml of concentrated HCl was added and the prepared solution was diluted to 4 lt with water. The pH of the solution was checked and it should be 1.2 + 0.2. 4 g of polysorbate 80 was dissolved in the buffer.
Preparation of Potassium Bipthalate Buffer pH 7.2: Accurately weighed 40.84 g of potassium bipthalate was dissolved in 500 ml water, to which 60 ml of 0.2 M sodium hydroxide was added and the prepared solution was diluted to 4 lt with water. The pH of the solution was checked and it should be 4.2 +0.2. 4 g of polysorbate 80 was dissolved in the buffer.
Preparation of Phosphate Buffer pH 4.2: Accurately weighed 27.2 g of potassium dihydrogen phosphate was dissolved in 500 ml water, to which 60 ml of 0.2 M sodium hydroxide was added and the prepared solution was diluted to 4 lt with water. The pH of the solution was checked and it should be 7.2 + 0.2. 4 g of polysorbate 80 was dissolved in the buffer.
Standard preparation: Accurately weighed 50 mg nifedipine working standard was transferred in 100 ml volumetric flask. To it 50 ml methanol was added and sonicated to dissolve, and the remaining volume was made up with methanol. From the above solution, 2 ml of the solution was pipette out into 100 ml of the respective buffers (ph1.2, 4.2 and 7.2) and filterd through whatman filter paper grade 1.
simultaneously 10 ml of fresh buffer was added to each jar and the instrument was run again for 2 hrs. After completion of 2 hrs, 10 ml aliquot was withdrawn from each jar and simultaneously 10 ml of fresh buffer was added to each jar and the instrument was run again for 4 hrs. . After 4 hrs, 10 ml aliquot was withdrawn from each jar.
Procedure: The study was performed in USP drug release apparatus II Paddle type
(Electrolab TDT 06L) in various release media i.e. simulated gastric fluid of pH 1.2 for 1st hour, mixture of simulated gastric and intestinal fluid of pH 4.2 for 2nd and 3rd hours and simulated intestinal fluid of pH 7.2 for subsequent hours (12 hrs.). The rotation speed of paddle was kept at 50 rpm, and the temperature was maintained at 37.5 ± 0.5 °C.300 mg blend was inserted in each assembly At pre determined time intervals, 10 ml aliquots were withdrawn and analyzed by UV-.Vissible spectrophotometer (UV 1601 PC, Shimadzu Scientific Instruments, Columbia, MD, USA) at a wavelength of 338 nm. using respective dissolution medias as blank.
Process Parameters
Medium Buffer
Volume 500 ml
Apparatus USP Apparatus II
Speed 50 r.p.m
Time 12 hrs.
Temperature 37 + 0.5 °C
Sampling interval 2, 3, 6, 8 and 12 hrs.
Calculation
% Drug release
Where, AT = Absorbance of sample preparation
AS = Absorbance of standard preparation WT = Weight of sample preparation WS = Weight of standard preparation
P = Potency of nifedipine working standard
Drug and excipients interaction study:- Fourier Transform Infrared Spectroscopy (FT-IR)
in order to detect the existence of interactions between nifedipine and hydrophobic or hydrophilic excipients in the granulation.
Procedure: The samples were first ground gently in a mortar and mixed with KBr before
being formulated into granules. Scans were obtained at a resolution of 2 cm−1, over a frequency range of 4000 to 400 cm−1.
Assay: By UV Spectroscopy
Standard preparation: Accurately weighed 50 mg nifedipine working standard was transferred in 100 ml volumetric flask. To it 50 ml methanol was added and sonicated to dissolve, and the remaining volume was made up with methanol. From the above solution, 2 ml of the solution was taken in 25 ml volumetric flask making up the volume with methanol and the solution was filterd through whatman filter paper grade 1.
Sample Preparation: Accurately weighed 300 mg of the blend was taken and dissolved in
20ml of methanol using a 50ml volumetric flash. This was shaken vigorously for about 15Min or more until a clear solution is obtained. The flask was then made up to volume with more methanol, and the solution was filtered through what man No. 1 filter paper. 5ml of the filtrate was again taken & diluted to 50ml with methanol.
Procedure: The standard and sample preparations were filtered through Whatman filter
paper grade 1 at each step and the absorbance was read at 350 nm on Ultra – violet spectrophotometer using methanol as blank.
Calculation
Nifedipine (mg/300 mg blend)
% Nifedipine
Where, AT = Absorbance of sample preparation AS = Absorbance of standard preparation WT = Weight of sample preparation WS = Weight of standard preparation
Evaluation Study of the Finished Product (Capsule)
Description: Randomly selected 10 capsules were unlocked and their contents were placed on a white sheet of paper and observed for the nature of filled material and colour.
Uniformity of Weight: 20 capsules were randomly selected from each batch, weighed indivdually and thereafter their average weight was calculated. Not more than two of the individual weights should deviate from the average weight by + 7.5% and none should deviate from + 15.0%. The maximum and the minimum deviation were calculated using the following formula
Maximum Deviation = max. weight – avg. weight of twenty capsules X 100 avg. weight of twenty capsules
Minimum deviation = min. weight – avg. weight of twenty capsules X 100 avg. weight of twenty capsules
Uniformity of Net Content: 20 capsules were randomly selected from each batch and unlocked one by one to record the filled content weight indivdually and thereafter their average weight was calculated. Not more than two of the individual weights should deviate from the average weight by + 7.5% and none should deviate from + 15.0%.
Maximum Deviation = max. net content – avg. net content of twenty capsules X 100 avg. net content of twenty capsules
Minimum deviation = min. net content – avg. net content of twenty capsules X 100 avg. net content of twenty capsules
Flow Properties of granules
Bulk density: Apparent bulk density was determined by placing pre-weighed granules in to a
graduated cylinder and measuring the volume and weight as it is. Bulk density = weight of granules/ poured volume of powder
Tapped density: Tapped density was determined by USP method II. Pre-weighed granules
were filled in 100 ml graduated cylinder of tap density tester which was operated for fixed number of taps until the granular bed volume has reached a minimum, thus was calculated by formula: Tapped density = weight of granules/ tapped volume of packing
Angle of Repose: Angle of repose of the granules was determined by the height cone
2h
Where, h and D are height and diameter of the pile respectively.
Carr’s Index: Percentage compressibility or Carr‟s index (CI) is based on the poured density
and tapped density, the percentage compressibility of the granules was computed using the Carr‟s compressibility index by the formula,
Carr‟s index (%) = poured density-tapped density/ poured densityX100
Flow of Powders with Carr’s Index values
Carr’s index (%) Type of flow
5-15 Excellent
12-16 Good
18-21 Fair to passable*
23-35 Poor
33-38 Very poor
> 40 Extremely poor *May be improved by glidant
Hausner’s ratio: Hausner‟s ratio was calculated using the formula,
Hausner‟s ratio = poured density tapped density
Flow of Powders with Hausner’s Ratio values
Values Comments
Less than 1.25 Good flow Greater than 1.5 Poor flow
Between 1.25-1.5 Addition of glidant normally improves the flow
Particle size distribution (% Retained) –
Dry Sieving Method was applied to analyze the particle size distribution. For this analysis nested column of 20#, 30#, 35#, 40# and 60# mesh sieves was taken and placed in a mechanical shaker. The sieves were arranged in the ascending order to obtain coarest sieve on the top and each lower sieve in the column had smaller openings than the one above. An accurately weighed ammount of granules (50 mg) were poured into the top sieve which has the largest screen openings. The shaker was put on for 10 min and after the shaking was complete the material on each sieve was weighed to calculate the % Retained.
Drug - Excipient Compatibility Study: Fourier Transform Infrared Spectroscopy (FT-IR):
The infrared spectra of the nifedipine, ethyl cellulose, lactose and the prepared granules were obtained on a Fourier transform Infrared spectrophotometer [(FTIR-8400) Shimadzu, Japan] in order to detect the existence of interactions between nifedipine and hydrophobic or hydrophilic excipients in the granulation.
Procedure: The samples were first ground gently in a mortar and mixed with KBr. Scans
were obtained at a resolution of 2 cm−1, over a frequency range of 4000 to 400 cm−1 and compared with that of standards
Drug content
Standard preparation: Accurately weighed 50 mg nifedipine working standard was transferred in 100 ml volumetric flask. To it 50 ml methanol was added and sonicated to dissolve, and the remaining volume was made up with methanol. From the above solution, 2 ml of the solution was pipette out into 25ml volumetric flask and the volume was made up by methanol.
Sample Preparation: One capsule was randomly selected and unlocked and the granules were crushed and powdered, using a mortal & pestle. The amount of this finely powder granules equivalent to 20mg of Nifedipine was taken and dissolved in 50ml of methanol using a 100ml volumetric flash. This was shaken vigorously for about 15Min or more until a clear solution is obtained. The flask was then made up to volume with more methanol, and the solution was filtered through what man No. 1 filter paper. 5ml of the filtrate was again taken & diluted to 50ml with methanol. Similarly 9 other samples were prepared.
Procedure: The standard and sample preparations were filtered through Whatman filter
paper grade 1 at each step and the absorbance was read at 350 nm on Ultra – violet spectrophotometer using methanol as blank.
Calculation
% Nifedipine
P = Potency of nifedipine working standard
Assay: By UV Spectroscopy
Standard preparation: Accurately weighed 50 mg nifedipine working standard was transferred in 100 ml volumetric flask. To it 50 ml methanol was added and sonicated to dissolve, and the remaining volume was made up with methanol. From the above solution, 2 ml of the solution was taken in 25 ml volumetric flask making up the volume with methanol and the solution was filterd through whatman filter paper grade 1.
Sample Preparation: Twenty capsules were randomly selected and unlocked and the granules were crushed and powdered, using a mortal & pestle. The amount of this finely powder granules equivalent to 20mg of Nifedipine was taken and dissolved in 20ml of methanol using a 50ml volumetric flash. This was shaken vigorously for about 15Min or more until a clear solution is obtained. The flask was then made up to volume with more methanol, and the solution was filtered through what man No. 1 filter paper. 5ml of the filtrate was again taken & diluted to 50ml with methanol.
Procedure: The standard and sample preparations were filtered through Whatman filter
paper grade 1 at each step and the absorbance was read at 350 nm on Ultra – violet spectrophotometer using methanol as blank.
Calculation
Nifedipine (mg/capsule)
% Nifedipine
Where, AT = Absorbance of sample preparation
AS = Absorbance of standard preparation WT = Weight of sample preparation WS = Weight of standard preparation
P = Potency of nifedipine working standard
In – vitro Drug Release
Preparation of Potassium Bipthalate Buffer pH 7.2 : Accurately weighed 40.84 g of potassium bipthalate was dissolved in 500 ml water, to which 60 ml of 0.2 M sodium hydroxide was added and the prepared solution was diluted to 4 lt with water. The pH of the solution was checked and it should be 4.2 +0.2. 4 g of polysorbate 80 was dissolved in the buffer.
Preparation of Phosphate Buffer pH 4.2: Accurately weighed 27.2 g of potassium
dihydrogen phosphate was dissolved in 500 ml water, to which 60 ml of 0.2 M sodium hydroxide was added and the prepared solution was diluted to 4 lt with water. The pH of the solution was checked and it should be 7.2 + 0.2. 4 g of polysorbate 80 was dissolved in the buffer.
Standard preparation: Accurately weighed 50 mg nifedipine working standard was transferred in 100 ml volumetric flask. To it 50 ml methanol was added and sonicated to dissolve, and the remaining volume was made up with methanol. From the above solution, 2 ml of the solution was pipette out into 100 ml of the respective buffers (ph1.2, 4.2 and 7.2) and filterd through whatman filter paper grade 1.
Sample preparation: One unit was placed in each of the six dissolution vessels containing
500 ml of the dissolution medium of buffer ph 1.2, dissolution parameters were set and process was started. After 2 hrs, 10 ml aliquot was withdrawn from each jar and the whole buffer solution was filtered through Whatman filter paper grade 1. The residue left over the filter papers were transferred into respective empty six vessels which were refilled by 500 ml of pH 4.2 buffer and the instrument was again started for 1 hour. After completion of 1 hr, 10 ml aliquot was withdrawn from each jar and the buffer solutions were filtered through Whatman filter paper grade 1. The residue left over was transferred into respective vessels which were refilled by 500 ml of pH 7.2 buffer and the instrument was restarted for 3 hour. After completion of 3 hrs, 10 ml aliquot was withdrawn from each jar and simultaneously 10 ml of fresh buffer was added to each jar and the instrument was run again for 2 hrs. After completion of 2 hrs, 10 ml aliquot was withdrawn from each jar and simultaneously 10 ml of fresh buffer was added to each jar and the instrument was run again for 4 hrs. . After 4 hrs, 10 ml aliquot was withdrawn from each jar.
Procedure: The study was performed in USP drug release apparatus II Paddle type
hour, mixture of simulated gastric and intestinal fluid of pH 4.2 for 2nd and 3rd hours and simulated intestinal fluid of pH 7.2 for subsequent hours (12 hrs.). The rotation speed of paddle was kept at 50 rpm, and the temperature was maintained at 37.5 ± 0.5 C. Single unit was inserted in each assembly at pre determined time intervals, 10 ml aliquots were withdrawn and analyzed by UV-. Vissible spectrophotometer (UV 1601 PC, Shimadzu Scientific Instruments, Columbia, MD, USA) at a wavelength of 338 nm. Using respective dissolution medias as blank.
Process Parameters
Medium Buffer
Volume 500 ml
Apparatus USP Apparatus II
Speed 50 r.p.m
Time 12 hrs.
Temperature 37 + 0.5 °C Sampling interval 2, 3, 6, 8 and 12 hrs.
Calculation
% Drug release
Where, AT = Absorbance of sample preparation
AS = Absorbance of standard preparation WT = Weight of sample preparation WS = Weight of standard preparation
P = Potency of nifedipine working standard
Determination of release kinetics: To analyze the mechanism of release and release rate kinetics of the formulation, the data obtained were fitted into Zero order, First order, Higuchi matrix, and Peppa‟s model. Based on the r-value, the best-fit model was selected.
RESULT AND DISCUSSION
Table 3 - Physico-Chemical Parameters of Procured Samples
Sr. No. Sample P C
+ S. D
Solubility (mg/ml) B.D
(g/cm3) + S. D
T.D(g/cm3) + S. D DCM
+ S. D
Ethanol + S. D
1 Nifedipine 173+ 0.56 16 0+
0.42 17+ 0.56 1.45+ 0.01 1.53+ 0.01
2 Ethyl
Cellulose 248+ 0.27
11
5.8+0.19 14.5+0.56 1.69+ 0.10 1.85+ 0.12 3 Lactose 202.8+0.11 10
8.4+0.14
10
3.3+0.4 1.53+ 0.02 1.61+ 0.03 M. P – Melting Point
D C M – Dichloromethane B. D – Bulk Density T. D – Tapped Density
Each value represents the mean ± standard deviation
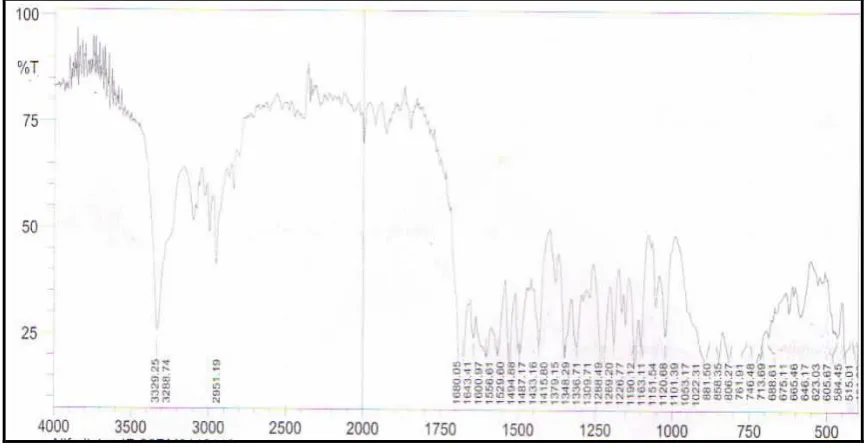
Figure 1- Infrared Spectra of Nifedipine and Excipients mixture
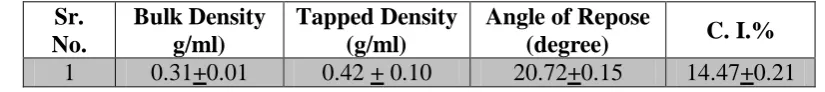
[image:18.595.81.515.341.565.2]Table 4: Evaluation of the Blend Sr. No. Bulk Density g/ml) Tapped Density (g/ml)
Angle of Repose
(degree) C. I.%
1 0.31+0.01 0.42 + 0.10 20.72+0.15 14.47+0.21 Each value represents the mean ± standard deviation, n=6
The prepared capsules were subjected to preliminary characterization such as uniformity of weight and uniformity of drug content and the evaluated parameters were within acceptable range for all the five formulations (Table 5).
Table 5 - Uniformity of Weight & Net Content
Formulation Average Weight + S. D Average Net Content + S. D
F1 299.47 + 0.56 300.45 + 0.77
F2 301.71 + 0.82 299.97 + 0.54
F3 300.06 + 0.46 300.12 + 0.19
F4 299.94 + 0.68 289.65 + 0.95
F5 299.42 + 0.42 301.03 + 0.77
Each value represents the mean ± standard deviation
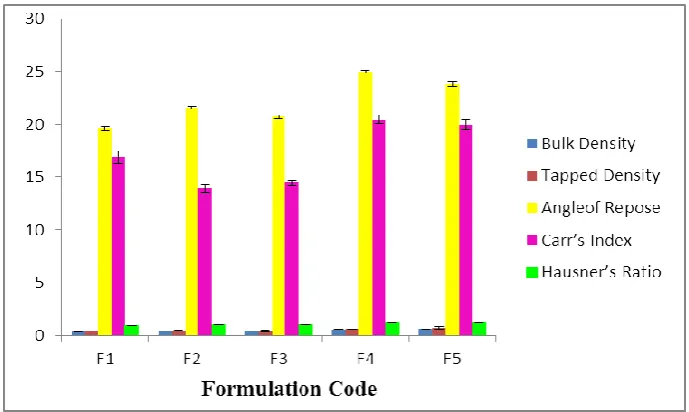
Granules of all the five formulations were also evaluated for physicochemical parameters bulk density, tapped density, angle of repose, Carr‟s index and Hausner‟s number. The bulk density and tapped density of various formulations ranged from 0.37 – 0.60 g/ml and 0.40 – 0.71 g/ml respectively..The granules showed acceptable angle of repose ranged between 19.65° and 24.99°, low Carr‟s index values (14.47 – 20.46 %) indicating good-fair flow properties. Also the granules showed acceptable Hausner‟s ratio ranged from 0.96 – 1.23. (Table-6 and Figure 2)
Table 6: F1 – F5 Physical Parameters
F
or
mul
ati
on Bulk Density
+ S.D.(g/ml)
Tapped Density + S.D. (g/ml)
Angle of Repose + S.D. (degree)
C. I + S.D. %
Hausner’s Ratio +S.D.
Figure 2 - Physical Parameters of Various Formulations
The particle size distributions of granules are shown in (Table 7 and Figure 3) which depicts the granule size range within 800 – 500 um.
Table 7 - Particle Size Distribution of Various Formulations
Sieve no.
Size (mm)
Size (μm)
% Retained
F1+ S. D F2+ S. D F3+ S. D F4+ S. D F5+ S. D 20 0.841 841 0.30+0.02 0.17+0.12 0.2+0.10 0.31+0.11 0.26+0.10 30 0.6 600 74.19+0.1 75.21+0.1 75.06+0.1 70.98+0.1 73.56+0.1 35 0.50 500 24.65+0.1 23.73+0.1 24.09+0.1 27.54+0.1 24.75+0.1 40 0.400 400 0.49+0.21 0.89+0.11 0.65+0.12 1.11+0.10 1.43+0.12
60 0.250 250 0.37+0.10 - - 0.06+0.11 -
[image:20.595.143.459.527.721.2]Each value represents the mean ± standard deviation
The FT-IR spectra of the pure drug and formulation F3 indicated that characteristics peaks of Nifedipine were not altered without any change in their position after successful entrapment in the matrix, indicating no chemical interactions between the drug and carrier used. The percentage drug content for different granular formulations indicated the uniformity in drug content as shown in (Table – 8).
Table 8: F1 – F5 % Drug Content
Sr. No. Formulation Code % Drug Content + S. D
1 F1 98.72 + 0.10
2 F2 100.05 + 0.01
3 F3 99.83 + 0.01
4 F4 97.08 + 0.10
5 F5 101.12+ 0.02
Each value represents the mean ± standard deviation
Assay for the optimized formulation (F3) confirmed the presence of 99.74% of the nifedipine in each capsule, which was within the permissible limits of the label claim.
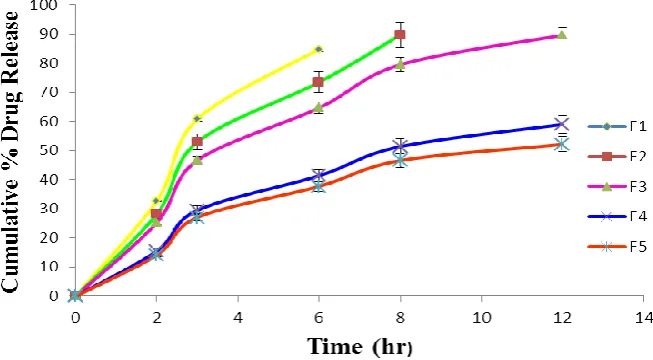
The results of dissolution study of formulations F1, F2, F3, F4, F5 showed 84.77% in 6 hrs, 89.63% in 8 hrs, 89.57% in 12 hrs, 58.96% in 12 hrs and 52.14% in 12 hrs respectively (Table-9 and figure-4). And therefore, formulation F3 with drug – polymer ratio 1:3 was found to be most promising formulation as it showed sustained release (89.57%) as well as maintained excellent matrix integrity during the period of 12 hr study. Hence formulation F3 was selected as the optimized formulation.
Table 9 - % Release of Various Formulations
Sr. No. Time (hr) % Release + S. D
F1 F2 F3 F4 F5
1 0 0 0 0 0 0
2 2 32.67+3.50 28.19+4.10 25.27+3.40 15.49+4.18 14.12+4.10 3 3 60.79+4.15 52.91+3.50 46.63+4.10 29.48+3.64 27.04+3.28 4 6 84.77+3.66 73.46+3.44 64.62+3.19 41.35+3.71 37.71+3.71 5 8 89.63+2.90 79.46+4.55 51.34+2.80 46.52+4.55
6 12 89.57+2.99 58.96+4.10 52.14+3.43
Figure 4 – Comparison of % Drug Release of Various Formulations
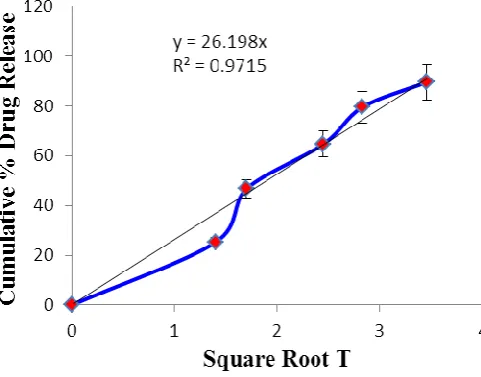
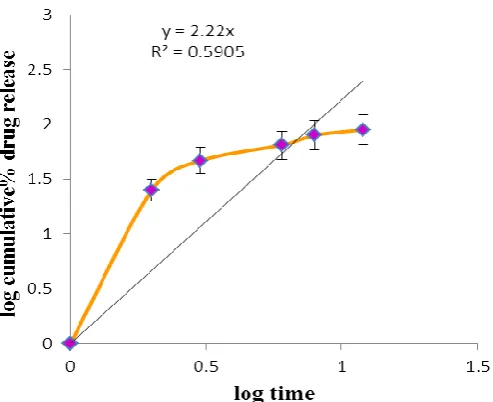
[image:22.595.137.464.75.255.2]The optimized formulation (F3) selected from the % drug release profiles was fitted into various kinetic models to know the mechanism of drug release from this formulation. The model that best fitted the release data was evaluated by regression coefficient (r2). The best fit release kinetic model was found to be Higuchi for F3 formulation (Table-10 and figure-5,6,7and8) which indicated release of the drug by difussion from matrix type formulation. This means that specific narrow channels are produced in the matrix due to lactose erosion, through which the release of the drug takes place. Use of lactose as soluble filler (pore former), is preferable in designing inert matrices of sparingly soluble drugs. Drug release study indicated that nifedipine release was by diffusion from the insoluble matrix, which supported the study hypothesis that as a result of formation of a nifedipine molecular dispersion, nifedipine dissolution inside the matrix was no longer the rate-limiting step for drug release, and the drug diffusion in matrix through the channels formed by dissolution of lactose became the slowest step instead. The results of the present study indicate that the granules prepared using ethyl cellulose could be used for the sustained release of the drug.
Table 10 - Fitting Data of the Release Rate Profile of F3 Formulation
Sr. No. Release Models R2
1 Zero Order 0.836
2 First Order 0.702
3 Higuchi 0.971
Figure 5 - Zero Order Plot of F3 Formulation
Figure 6 - First Order Plot of F3 Formulation
[image:23.595.170.411.524.712.2]Figure 8– Peppas Plot of F3 Formulation
CONCLUSION
The present work was aimed at exploitation of hydrophobic polymer Ethyl Cellulose for sustained delivery of Nifedipine, further, at achieving sustained release for the period of 12 hours. The ethyl cellulose granules of Nifedipine were successfully prepared by wet granulation technique and confirmed that it is a good method for preparing Nifedipine loaded matrix granules for its higher percentage yield. Five different formulations of nifedipine matrix granules with different amounts of the polymer ethyl cellulose with the drug in the ratio of 1:1, 2:1, 3:1, 4:1 and 5:1 were prepared successfully.
REFERENCES
1. Brahmankar DM, Jaiswal SB. Biopharmaceutics and Pharmacokinetics: Pharmacokinetics. 2nd ed. Vallabh Prakashan, 2009: 399-401.
2. Lee VHL. Controlled Drug Delivery Fundamentals and Applications: Influence of drug properties on design. 2nd ed, 1987; 16-25.
3. Wani MS et al. Controlled Release System-A Review, 2008; 6.
4. Ho WH, Lee HLV. Sustained Drug Delivery Fundamentals and Applications: Design and fabrication of oral controlled release drug delivery system. 2nd ed, 1987; 373-420.
5. Brahmankar HA, Jaiswal SB, Biopharmaceutics and Pharmacokinetics A Treatise, Vallabh Prakashan, 2000, 348-357 and 337.
6. Shaji J, Chadawar V, Talwalkar P. Multiparticulate Drug Delivery System. The Indian Pharmacist, 2007; 6(60): 21-28.
7. Tang E. S.K., Chan L.W, Heng P.W.S. Coating of Multiparticulates for Sustained Release, Amer J Drug Delivery, 2005; 3(1): 17-28.
8. Shahwal kumar Vimal, Dr. Dubey B.K, Bhoumick Mithun. (Preformulation study of Levofloxacin). International Journal of Advances in Pharmaceutics, 2012; 1 (1).
9. Gupta MM, Saini TR. (Preformulation parameters characterization to design, development and formulation of vancomycin hydrochloride tablets for psudomembranous colitis). International journal of pharmaceutical research and development, 2009;1(9): 1-7 10.Brown, R. J. C. & R. F. C. (Melting Point and Molecular Symmetry). Journal of
Chemicall Education, 2000; 77 (6): 724.
11.Bergström Christel A. S, Norinder Ulf, Luthman Kristina, Artursson Per. (Experimental and Computational Screening Models for Prediction of Aqueous Drug Solubility). Pharmaceutical Research, 2002; 19(2): 182-188.
12.Narang AS, Desai D, Badawy S. (Impact of excipient interactions on solid dosage form stability). Pharm Res, 2012; 29(10): 2660–2683.