ORIGINAL RESEARCH
ADULT BRAIN
MRI Quantitative T2* Mapping to Predict Dominant
Composition of In Vitro Thrombus
X R. Bourcier,X R. Pautre,XM. Mirza,XC. Castets,XJ. Darcourt,XJ. Labreuche,XL. Detraz,XH. Desal,X J.-M. Serfaty, and XC. Toquet
ABSTRACT
BACKGROUND AND PURPOSE: MR imaging quantitative T2* mapping, which provides information about thrombus composition and specifically the red blood cell content, may be obtained in the setting of acute ischemic stroke before treatment. This could be useful to adapt the endovascular strategy. We aimed to analyze the red blood cell content of in vitro thrombi in relation to the thrombus-T2* relaxation time.
MATERIALS AND METHODS: Thirty-five thrombus analogs of different compositions were scanned with an MR imaging quantitative T2* mapping sequence. Two radiologists, blinded to thrombus composition, measured the thrombus-T2* relaxation time twice at an interval of 2 weeks. Quantitative histologic evaluations of red blood cell content were performed. Inter- and intraobserver reproducibility of the thrombus-T2* relaxation time was assessed by calculating intraclass correlation coefficients. Finally, a Spearman product moment corre-lation between the thrombus-T2* relaxation time and red blood cell content was performed.
RESULTS:The median thrombus-T2* relaxation time was 78.5 ms (range, 16 –268 ms; interquartile range, 60.5 ms). The median red blood cell content was 55% (range, 0%–100%; interquartile range, 75%). Inter- and intraobserver reproducibility of the thrombus-T2* relaxation time was excellent (⬎0.9). The Spearman rank correlation test found a significant inverse correlation between thrombus-T2* relaxation time and red blood cell content (⫽ ⫺0.834,P⬍.001).
CONCLUSIONS: MR imaging quantitative T2* mapping can reliably identify the thrombus red blood cell content in vitro. This fast, easy-to-use sequence could be implemented in routine practice to predict stroke etiology and adapt devices or techniques for endovas-cular treatment of acute ischemic stroke.
ABBREVIATIONS:RBC⫽red blood cell; SVS⫽susceptibility vessel sign; TT2*RT⫽thrombus-T2* relaxation time
S
udden occlusion of an intracranial artery by a thrombus rep-resents the pivotal event in anterior acute ischemic stroke. Consequently, the primary goal of acute stroke treatment is to restore perfusion by lysing the thrombus with intravenous bolysis and/or retrieving the thrombus with mechanicalthrom-bectomy.1The red blood cell (RBC) content may be especially critical to tailor the endovascular treatment. As demonstrated by Hashimoto et al,2 the interaction between the stent-retriever struts and the thrombus is likely dependent on the number of RBCs in the thrombus.3Hence a first-line imaging-screening pro-tocol that can provide the proportion of RBCs in the whole thrombus would be helpful when planning a treatment strategy. In this field, the T2* sequence offers acquisition times suited to the context of emergency acute ischemic stroke. The susceptibility vessel sign (SVS) on T2* MR imaging is defined by a hypointense signal, exceeding the diameter of the contralateral artery, located at the site of the thrombus.4A positive SVS (SVS⫹) correlates with an RBC-dominant thrombus, whereas a lack of SVS (SVS⫺) indicates a fibrin-dominant thrombus.3
However, a binary assessment of thrombus composition (either SVS⫹or SVS⫺) may not reflect the complex nature of thrombi in which different regions may have different content of RBCs.5-7Moreover, SVS⫹can be difficult to determine in
Received August 8, 2018; accepted after revision October 21.
From the Departments of Neuroradiology (R.B., R.P., L.D., H.D.) and Cardiac and Vascular Imaging (J.-M.S.), Hoˆpital Rene´ et Guillaume Laennec, Centre Hospitalier Universitaire de Nantes, Nantes, France; Neuravi Thromboembolic Initiative (M.M.), Galway, Ireland; Siemens Healthineers France (C.C.), Saint-Denis, France; Depart-ment of Neuroradiology (J.D.), Hoˆpital Purpan, Centre Hospitalier Universitaire de Toulouse, Toulouse, France; Department of Biostatistics (J.L.), Universite´ de Lille, Centre Hospitalier Universitaire Lille, Lille, France; and Department of Pathology (C.T.), Hoˆtel Dieu, Centre Hospitalier Universitaire de Nantes, Nantes, France. Jean-Michel Serfaty and Claire Toquet contributed equally to this work. Please address correspondence to Romain Bourcier, MD, PhD, Service de Neurora-diologie, Centre Hospitalier Universitaire Guillaume et Rene´ Laennec, Boulevard du Professeur Jacques Monodm, 44 093 Nantes, France; e-mail:
[email protected], romain.bourcier@chu-nantes
clinical practice because some thrombi may show a hypointense signal with a diameter equal to or slightly above that of the con-tralateral artery. Last, the diagnostic accuracy of the SVS to deter-mine RBC content varies dramatically among MR imaging ma-chines.8 Because T2* maps are commonly used to assess the cardiac and liver iron load in patients with thalassemia,9,10 mea-suring the thrombus T2* relaxation time (TT2*RT) could provide quantitative insight into thrombus composition rather than a qualitative evaluation using the SVS.11In this study, we aimed to analyze the RBC content of in vitro thrombi in relation to the thrombus-T2* relaxation time and to examine the intra- and in-terobserver agreement of the TT2*RT measurements.
MATERIALS AND METHODS
Blood Collection and Thrombus Formation
Detailed methods for blood collection and thrombus formation were previously published.12In brief, ovine blood was obtained from a licensed facility (Ash Stream, Hollymount, Ireland). Seven different thrombi analog types were created, with 5 replicate thrombi for each type. To separate the whole-blood constituents, we performed centrifugation, and coagulation was generally initiated following the addition of a calcium chloride solution to the blood components. Erythrocyte, plasma, and white cell content were con-trolled by volume in the precoagulated solution. Finally, thrombi were prepared with different ratios of RBCs and fibrin. Clotted ma-terial was allowed to mature for approximately 30 minutes to 1 hour at 37°C. Then, thrombi were formed in either a static or dynamic environment and mixed with citrated plasma, thrombin, or platelets to promote thrombus retraction. Of note, the thrombus-creation results show that the environment influences thrombus composi-tion. Specifically, even with the same initial volume and constituents of blood, a thrombus created in static conditions had a vastly differ-ent final histologic composition than the dynamic thrombus. To
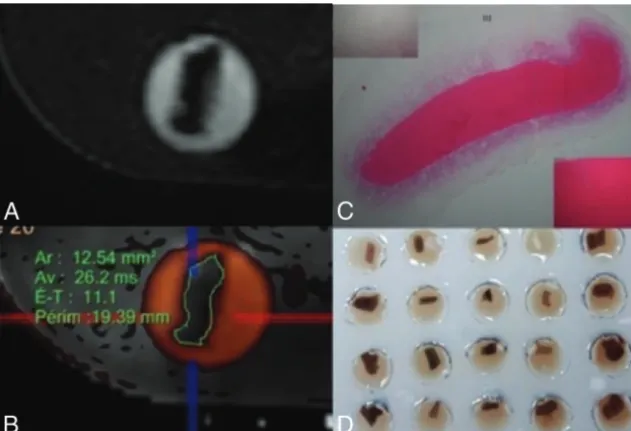
simulate realistic blood conditions and represent the wide range of human thrombus compositions, we used both types of environmental conditions to cre-ate thrombi. They were suspended in a physiologic serum within an MR imag-ing– compatible agarose matrix (Fig 1D).
MR Imaging Analysis
Each thrombus was placed in a vial 4 cm deep and 8 mm wide, filled with physio-logic serum. The thrombi were fully sub-merged at the bottom of the vials but were not embedded in the agarose gel. Thirty-five different thrombi were scanned si-multaneously in an MR imaging machine. Experiments were performed on a 1.5T MR imaging unit (Magnetom Aera; Sie-mens, Erlangen, Germany) equipped with a system capable of 50 mT/m-1 maximum strength and 200 mT-1.s-1 maximum slew rate. A volume coil was used for exci-tation, while a head/neck coil composed of 20 receiver channels was used for signal reception.
A quantitative T2* mapping sequence based on multi-gra-dient-echo was used with the following imaging parameters: TR, 442 ms; 12 different TEs: 3.30, 4.72, 6.19, 9.12, 13.08, 17.04, 20.98, 24.92, 28.86, 32.80, 36.74, 40.68 ms; slice thick-ness, 3 mm; gap between slices, 0.3 mm; FOV, 260⫻260 mm; flip angle, 20°; matrix, 205⫻256; voxel size, 1.3⫻1.3⫻ 3 mm3; pass band, 930 Hz; acquisition time, 2 minutes and 32
seconds. We performed a 3D-CISS sequence with the following parameters: TR, 6.09 ms; TE, 2.81; section thickness, 0.5 mm; intersection gap, 0 mm; FOV, 190⫻154 mm; flip angle, 62°; matrix, 320⫻240; voxel size, 0.3⫻0.3⫻0.3; pass band, 300 Hz; acquisition time, 2.49 minutes.
The TT2*RT values were measured after coregistration with 3D-CISS images to visualize the boundaries of the thrombi and manually select an ROI to include the entire thrombus on an axial slice. The software automatically provided a mean TT2*RT value in milliseconds (in the ROI), the SD, and the size of the area in square millimeters.
After the MR imaging acquisition, the thrombus analogs were immediately embedded in paraffin for histologic analysis. The measurements by 2 radiologists (a junior radiologist and an expe-rienced neuroradiologist) blinded to the histologic composition of the thrombi were performed in 2 sessions 2 weeks apart to examine inter- and intraobserver reliability.
Histologic Analysis
Immediately after the MR imaging acquisition, the thrombi were fixed in a 10% formalin solution. Formalin-fixed speci-mens were then embedded in paraffin, cut into 7-m-thick sections, and stained with hematoxylin-eosin. Two experi-enced pathologists without knowledge of the laboratory-an-nounced thrombus composition and the imaging findings per-FIG 1. A, MR images of 3D-CISS analog thrombi.B, MR images of coregistered T2 mapping and
[image:2.594.57.373.47.262.2]formed the histologic evaluation independently. Discordant results were re-evaluated and were resolved by consensus. We identified the different components of the thrombi: fibrin/ platelet aggregations, RBCs, and rarely found white blood cells. Slides were scanned and analyzed using NDP.view software (https://ndp-view.software.informer.com/). First, a low-power-field examination was used to identify pure fibrin clots (⬎95% fibrin), pure RBC clots (⬎95% RBCs), and heterogeneous clots. Preliminary evidence suggested that 2 pathologists working inde-pendently could reproducibly evaluate a 10% change in RBC con-tent. Hence, we devised a simple scaling system (Fig 2) based on a 10% threshold that had a stepwise incremental increase in RBC content for this semiquantitative analysis. When the thrombus was heterogeneous, a 2-step procedure was devised. First, the RBC-dominant areas were evaluated by a semiquantitative anal-ysis using a lattice composed of 10⫻10 squares at a high-power field. Second, the proportion of the RBC component was calcu-lated as the ratio (percentage) of selected dominant RBC areas to the entire thrombus area. A 10% incremental scale was again applied.
Statistical Analysis
MR imaging quantitative T2* mapping results are expressed as median, range, and interquartile range due to the non-normal distribution. Normality of distributions was assessed using histo-grams and the Shapiro-Wilk test. Inter- and intraobserver repro-ducibility of the TT2*RT measurements was assessed by calculat-ing intraclass correlation coefficients. The intraclass correlation coefficients were estimated using a 2-way random effects model (absolute agreement). Intraclass correlation coefficient values of
⬍0.5, between 0.5 and 0.75, between 0.75 and 0.9, and ⬎0.90 were inter-preted as poor, moderate, good, and ex-cellent reproducibility, respectively.13 The mean of the TT2*RT values (4 readings) was used in descriptive and correlation analyses. The correlation between TT2*RT values and histologic RBC content was assessed by calculat-ing the Spearman rank correlation () coefficient. Ninety-five percent confi-dence intervals for intraclass correla-tion coefficients andvalues were ob-tained using bootstrap methods (2000 bootstrap samples). All analyses were computed using R statistical and computing software (Version 3.5.1; http://www.r-project.org/).
RESULTS
A total of 35 thrombi were histologically processed and analyzed. Inter- and intraobserver reproducibility of the TT2*RT measurements was excellent, with an intraclass correlation coeffi-cient of 0.915 (95% CI, 0.783– 0.981) for interobserver reproducibility at the first session, 0.944 (95% CI, 0.814 – 0.991) for interobserver reproducibility at the second session, 0.977 (95% CI, 0.961– 0.988) for intraobserver reproducibility of the junior radiologist, and 0.982 (95% CI, 0.967– 0.990) for intraobserver reproducibility of the senior neuroradiologist.
The median TT2*RT value was 78.5 ms (range, 16 –268 ms; interquartile range, 60.5 ms). The median TT2*RT SD was 28.5 ms (range, 6 – 84 ms; interquartile range, 25.5 ms). The median TT2*RT area that reflects the cross-sectional size of the thrombi was 26 mm2(range, 17– 67 mm2; interquartile range, 23.3 mm2).
The median RBC content was 55% (range, 0%–100%; interquar-tile range, 75%).
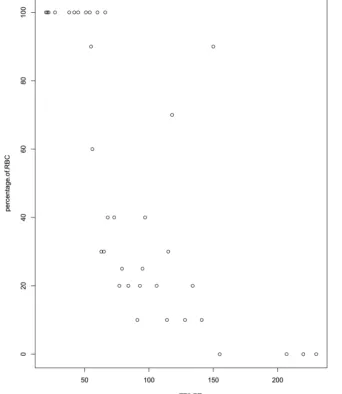
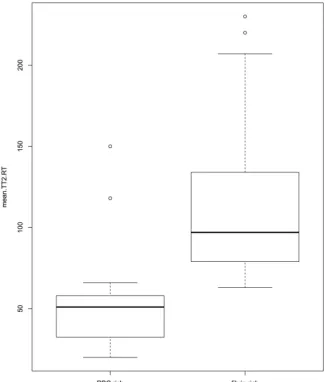
A strong negative correlation between TT2*RT and RBC con-tent was found, with a correlation coefficient of⫺0.834 (95% CI, ⫺0.659 to⫺0.915) (Fig 3). For fibrin-dominant thrombi, the median TT2*RT value was 104.25 ms (range, 63–230 ms; inter-quartile range, 61.9 ms), whereas for the RBC thrombi, the me-dian TT2*RT value was 54 ms (range, 20 –150 ms; interquartile range, 45.9 ms) (Fig 4).
As shown inFig 3, the scatterplot of RBC content against TT2*RT revealed an outlier (90% RBC content, TT2*RT of 150 ms) with a substantial interobserver discordance (reader 1: TT2*RT of 80⫾25 ms; reader 2: TT2*RT of 153⫾163.5 ms), representing a 63% variation between observers. Histologic analysis indicated a 90% RBC content with a central area mostly composed of RBCs. However, a large fibrin-rich halo surrounded the thrombus. This unusual “2-layered” thrombus created discordance and misinterpretation due to inconsis-tently measured areas in either the RBC or fibrin-rich layers (Fig 1C).
[image:3.594.56.376.46.304.2]DISCUSSION
We found an inversely proportional correlation between the thrombus RBC content measured by histology and the TT2*RT value using MR imaging with in vitro thrombi. This new and short MR imaging sequence requires⬍3 minutes for acquisition and has excellent intra- and interobserver agreement, providing a re-liable quantitative biomarker for dominant thrombus composi-tion detectible in routine clinical practice.
Randomized controlled trials have demonstrated the superiority of bridging therapy over best medical care for patients with con-firmed large-vessel occlusion but without providing any information on thrombus composition.14-18 However, studies on human thrombi retrieved from patients with anterior acute ischemic stroke have revealed varying compositions.5,6Because the 2 major compo-nents of thrombi are RBC and fibrin, the fibrin proportion is roughly the inverse of the RBC content5,6,19(eg, if the RBC content is 20%, the fibrin content will be around 80%, and conversely). When one engages a thrombus with a stent retriever or aspiration catheter, op-timal outcomes are likely best achieved when the entire thrombus can be retrieved in 1 pass without losing any fragments. A fibrin-rich thrombus can be difficult to engage and may adhere to the vessel
wall; on the other hand, a weakly orga-nized RBC-rich thrombus can be prone to fragmentation.20,21
Thus, MR imaging can offer a quan-titative approach to measuring throm-bus composition. The SVS has been studied in the literature on ischemic stroke treated by intravenous thrombol-ysis or endovascular means with end points defined either in terms of recan-alization or functional outcome.11,22-25 However, the qualitative evaluation of the SVS (either⫹or⫺) limits its ability to assess the complex and variable com-position of thrombi. As previously dem-onstrated, a linear variation of the RBC/ fibrin ratio is observed in samples of retrieved thrombi.3,5,6Furthermore, the diagnostic accuracy of the SVS to predict thrombus composition varies according to the MR imaging machine.8This vari-ation seems to be a crucial pitfall for any extensive use of the SVS in large multi-center studies. The appearance of the SVS is related to technical parameters such as TE, voxel size, and magnetic field.26Given these limitations, the SVS should be read in relation to a precise T2* map calculated using several TRs with highly controlled imaging parame-ters. Indeed, a gradient-echo sequence is commonly used to identify brain hem-orrhage, but the parameters of this se-quence are not optimized for the detec-tion and characterizadetec-tion of a thrombus. In this study, we acquired 12 different echo sequences, from 3.30 to 40.68 ms, allowing us to precisely measure T2* on tissue with both high and low T2*.
Hence, a quantitative imaging method might be a useful way of analyzing thrombus composition more precisely. A study found that acute intramural hematoma due to cerebral artery dissection could be determined more accurately on T2* quantification mapping.27 One recent study analyzed the performance of T2* mapping (com-pared with SVS) to detect thrombi.28The TT2*RT value has also been found to be related to the number of attempts to reach success-ful recanalization after endovascular treatment, but the correlation between TT2*RT and the histologic composition of the thrombus has never been analyzed.11In our study, we used distinct thrombus analogs varying in composition, ranging from RBC-dominant to fi-brin-dominant.12This model of thrombus creation holds promise for translational research on thrombus composition and permeabil-ity.29Using in vitro thrombi provides the opportunity to validate the capacity of the sequence to predict the proportion of RBCs. Thus, in vitro thrombi are more relevant than ex vivo thrombi for 2 main reasons: First, our study required thrombi with a composition rang-ing from extremely RBC-rich to fibrin-only, correspondrang-ing to the FIG 3. Semiquantitative evaluation (10% steps) of the red blood cell content in the thrombi and
[image:4.594.52.394.51.445.2]wide range of thrombi encountered in clinical practice, some of which can be very difficult to retrieve. In particular, fibrin-rich thrombi are difficult to remove with traditional stent-retriever meth-ods; hence, there is a need to predict these types of thrombi. Second, the use of intravenous thrombolysis before thrombus extraction can modify the thrombus characteristics. In particular, thrombi retrieved after substantial chemical and mechanical manipulations are likely to be vastly dissimilar to the original occlusion.
Our study has several limitations. First, the results of TT2*RT might depend on the magnetic field homogeneity and susceptibility differences between the thrombus and the medium surrounding it. To test the influence of these parameters, one would need to repeat the measurements with thrombi positioned in different orientations. This was not done in our study; the thrombi were randomly placed within their vials. As a consequence, during the MR imaging acqui-sition, the long axis of the thrombi had multiple directions either in the direction of the phases or the frequency, just like the blood vessels in vivo. Moreover, to limit the effect of heterogeneities on images, we performed a 3D shim before each acquisition, allowing a narrow water-frequency peak. This adjustment only takes 30 seconds, is fully compatible with use in routine clinical practice, and allows the ro-bustness and precision of the T2* value to be substantially improved.
Then, a critical point is that the 1.5T Sie-mens unit offers the possibility of shorten-ing or lengthenshorten-ing the interecho intervals. Thus, in the sequence presented here, we concentrated the echoes around 30 ms for optimal accuracy. However, the T2* value is also dependent on magnetic field strength, and the next step is to analyze the inter-MR imaging machine agreement for this sequence. Last, one can argue that sus-ceptibility-weighted imaging sequences could be useful for detecting intracranial thrombi. This is most likely the case be-cause these sequences are more sensitive to the RBC content, but they may not effi-ciently predict the proportion of RBCs in the thrombus. Furthermore, because of the longer TEs, the susceptibility-weighted imaging requires a longer acquisition time, which can be detrimental in the con-text of acute ischemic stroke.
CONCLUSIONS
An MR imaging quantitative T2* map-ping sequence that records the TT2*RT can reliably identify the thrombus RBC content in vitro. TT2*RT values are in-versely related to the RBC content of thrombi. This new short MR imaging se-quence provides a quantitative biomarker of thrombus composition accessible in clinical routine. Normalization of the MR imaging quantitative T2* map-ping sequence between MR imaging vendors should be considered in the future if large multicenter studies aim to include information on thrombus composition before me-chanical thrombectomy.
ACKNOWLEDGMENTS
We thank Siemens and Neuravi for their nonfunded, scientific support and Nick Barton for language editing.
REFERENCES
1. Goyal M, Menon BK, van Zwam WH, et al; HERMES collaborators. Endovascular thrombectomy after large-vessel ischaemic stroke: a meta-analysis of individual patient data from five randomised tri-als.Lancet2016;387:1723–31CrossRef Medline
2. Hashimoto T, Hayakawa M, Funatsu N, et al.Histopathologic anal-ysis of retrieved thrombi associated with successful reperfusion af-ter acute stroke thrombectomy.Stroke2016;47:3035–37CrossRef Medline
3. Brinjikji W, Duffy S, Burrows A, et al.Correlation of imaging and histopathology of thrombi in acute ischemic stroke with etiology and outcome: a systematic review.J Neurointerv Surg2017;9:529 –34 CrossRef Medline
4. Rovira A, Orellana P, Alvarez-Sabín J, et al.Hyperacute ischemic stroke: middle cerebral artery susceptibility sign at echo-planar gradient-echo MR imaging.Radiology2004;232:466 –73CrossRef Medline
[image:5.594.55.381.47.430.2]5. Liebeskind DS, Sanossian N, Yong WH, et al.CT and MRI early vessel signs reflect clot composition in acute stroke.Stroke2011; 42:1237– 43CrossRef Medline
6. Marder VJ, Chute DJ, Starkman S, et al.Analysis of thrombi re-trieved from cerebral arteries of patients with acute ischemic stroke.Stroke2006;37:2086 –93CrossRef Medline
7. Boeckh-Behrens T, Schubert M, Fo¨rschler A, et al.The impact of histological clot composition in embolic stroke.Clin Neuroradiol
2016;26:189 –97CrossRef Medline
8. Bourcier R, De´traz L, Serfaty JM, et al.MRI interscanner agreement of the association between the susceptibility vessel sign and histologic composition of thrombi.J Neuroimaging 2017;27:577– 82CrossRef Medline
9. Hanneman K, Nguyen ET, Thavendiranathan P, et al.Quantification of myocardial extracellular volume fraction with cardiac MR imag-ing in thalassemia major. Radiology 2016;279:720 –30 CrossRef Medline
10. Gandon Y, Olivie´ D, Guyader D, et al.Non-invasive assessment of hepatic iron stores by MRI. Lancet 2004;363:357– 62 CrossRef Medline
11. Bourcier R, Brecheteau N, Costalat V, et al.MRI quantitative T2* mapping on thrombus to predict recanalization after endovascular treatment for acute anterior ischemic stroke.J Neuroradiol2017;44: 241– 46CrossRef Medline
12. Duffy S, Farrell M, McArdle K, et al.Novel methodology to replicate clot analogs with diverse composition in acute ischemic stroke.
J Neurointerv Surg2017;9:486 –91CrossRef Medline
13. Koo TK, Li MY.A guideline of selecting and reporting intraclass correlation coefficients for reliability research.J Chiropr Med2016; 15:155– 63CrossRef Medline
14. Goyal M, Demchuk AM, Menon BK, et al; ESCAPE Trial Investiga-tors.Randomized assessment of rapid endovascular treatment of ischemic stroke.N Engl J Med2015;372:1019 –30CrossRef Medline 15. Campbell BC, Mitchell PJ, Kleinig TJ, et al; EXTEND-IA
Investiga-tors.Endovascular therapy for ischemic stroke with perfusion-im-aging selection.N Engl J Med2015;372:1009 –18CrossRef Medline 16. Berkhemer OA, Fransen PS, Beumer D, et al.A randomized trial of
intraarterial treatment for acute ischemic stroke.N Engl J Med2015; 372:11–20CrossRef Medline
17. Jovin TG, Chamorro A, Cobo E, et al; REVASCAT Trial Investigators. Thrombectomy within 8 hours after symptom onset in ischemic stroke.N Engl J Med2015;372:2296 –306CrossRef Medline 18. Saver JL, Goyal M, Bonafe A, et al; SWIFT PRIME Investigators.
Stent-retriever thrombectomy after intravenous t-PA vs. t-PA alone in stroke.N Engl J Med2015;372:2285–95CrossRef Medline 19. Boeckh-Behrens T, Kleine JF, Zimmer C, et al.Thrombus histology
suggests cardioembolic cause in cryptogenic stroke.Stroke2016;47: 1864 –71CrossRef Medline
20. Fennell VS, Setlur Nagesh SV, Meess KM, et al.What to do about fibrin rich “tough clots”? Comparing the Solitaire stent retriever with a novel geometric clot extractor in an in vitro stroke model.
J Neurointerv Surg2018;10:907–10CrossRef Medline
21. Machi P, Jourdan F, Ambard D, et al.Experimental evaluation of stent retrievers’ mechanical properties and effectiveness.J Neuro-interv Surg2017;9:257– 63CrossRef Medline
22. Soize S, Batista AL, Rodriguez Regent C, et al.Susceptibility vessel sign on T2* magnetic resonance imaging and recanalization results of mechanical thrombectomy with stent retrievers: a multicentre cohort study.Eur J Neurol2015;22:967–72CrossRef Medline 23. Naggara O, Raymond J, Domingo Ayllon M, et al.T2* “susceptibility
vessel sign” demonstrates clot location and length in acute ischemic stroke.PLoS One2013;8:e76727CrossRef Medline
24. Kimura K, Sakamoto Y, Iguchi Y, et al.Clinical and MRI scale to predict very poor outcome in tissue plasminogen activator patients.
Eur Neurol2011;65:291–95CrossRef Medline
25. Aoki J, Kimura K, Shibazaki K, et al.Location of the susceptibility vessel sign on T2*-weighted MRI and early recanalization within 1 hour after tissue plasminogen activator administration. Cerebro-vasc Dis Extra2013;3:111–20CrossRef Medline
26. Hodel J, Rodallec M, Gerber S, et al.Susceptibility weighted mag-netic resonance sequences “SWAN, SWI and VenoBOLD”: techni-cal aspects and clinitechni-cal applications[in French].J Neuroradiol2012; 39:71– 86CrossRef Medline
27. Kato A, Shinohara Y, Yamashita E, et al.Usefulness of R2* maps generated by iterative decomposition of water and fat with echo asymmetry and least-squares estimation quantitation sequence for cerebral artery dissection.Neuroradiology2015;57:909 –15CrossRef Medline
28. Shinohara Y, Kato A, Yamashita E, et al.R2* map by IDEAL IQ for acute cerebral infarction: compared with susceptibility vessel sign on T2*-weighted imaging.Yonago Acta Med2016;59:204 – 09 Medline