An Experimental Exploration of Segmentation
Techniques for Modi Script
Bhumika Solanki
School of Computer Science & I.T D.A.V.V, Indore
Maya Ingle
School of Computer Science & I.T D.A.V.V, Indore
ABSTRACT
The segregation of image is most significant phase to identify borderline information of an image effectively. As various degradation exists in an image such as distorted pixel value, blurring in an image, poor luminance etc that affects the visual representation of an image. Using segmentation techniques, we attempts to improve the content of an image and make it clear for representation. There exist various edges and clustering based segmentation techniques such as perwitt, roberts, canny, sobel and K-means clustering that assist in segregating distortion information from a Modi character image to great extent. The comparative analysis of these segmentation techniques based on some performance parameters is performed to segment Modi character components. As a result, K- means clustering technique shows more appropriate outcome for segregating Modi numerals efficiently.
Keywords
Perwitt, roberts, canny, sobel edge based segmentation techniques and K-means clustering
1.
INTRODUCTION
The partition of an image has prominent importance in computer vision applications as it transforms an image into non homogenous format. It deals with the classification, identification and detachment of the apparent sections of digitized image that resemble to the physical components of an image. The central portion of an image is segregated from background area to detect structural features of an object effectively. The segregated image can be merged/ split to easily identify object for image analysis and clear representation. In case of image segmentation, recognition of separated portions of image such as ranges, positions, strokes, boundaries has been identified. There exist numerous image segmentation techniques that are classified as threshold based, fuzzy based, neural network based segmentation techniques etc. The efficiency of segmentation techniques depends on promptness, proficient matching of outline attributes of image, enhancement of contour connectivity etc [1]. The expectation-maximization algorithm has been executed to segregate handwritten character of Kannada scripts that involves the combination of Gaussian function and achieves 85.5% accuracy rate [2]. To segment text from English, Kannada and Tamil scripts the Stroke Width Transform (SWT) and Grab cut algorithm has been implemented. It signifies the resemblance among pixel values in any region of image as well as incoherence occurs among edges of image while achieving 79% precision rate [3]. However, there lays an abundant scope of segmenting contextual information from Modi script image as well as improving efficiency of an image to great extent.
This paper intends to analyze the performance of various existing segmentation techniques for Modi character
components. Section 2 deals with two classes of segmentation techniques available to measure the features of pixel value of Modi images and its neighborhood regions. The segmentation techniques assist in segregating similar/ dissimilar characteristics of pixel value to represent object within an image. In Section 3, some performance parameters such as Mean Square Error (MSE), Peak to Signal Noise Ratio (PSNR), Structural Content (SC) and Structural Similarity Index of Image (SSIM) are discussed in detail. Performance parameters contribute to enlighten efficiency of segmented image to pronounced magnitude. The comparative analysis of segmentation techniques for Modi images based on performance parameters are shown in Section 4. This comprehensive performance analysis signifies effective segmentation technique accustomed to represent clear identification of object efficiently. At last, Section 5 pertains with conclusion and future scope.
2.
EXISTING SEGMENTATION
TECHNIQUES
The chief task of image segmentation is to partition an image into fixed disconnected sections that comprised of constant and identical characteristics such as intensity, shade, quality, consistency etc. The execution of segmentation techniques depends on two crucial factors namely; resemblance as well as disruption in order to segments an image. The segregation of image depends on rapid transformation in intensity portion of grey level values of an image. Further, division of merely that pixel value is executed that are similar in certain manner [4]. The image segmentation categorized into several portions namely; edge based segmentation, threshold based segmentation, region based segmentation, cluster based segmentation, feature based segmentation etc. The object within an image is segmented by identifying boundary section of image, creating cluster/ groups of similar attributes, detecting region of interest etc [5]. The two image segmentation techniques namely; edge based and clustering based segmentation techniques are discussed as follows:
2.1
Edge Based Segmentation Techniques
boundaries. It represents alignments of image along with discrete transformations in an image more precisely [7]. Several existing edges based segmentation techniques have been discussed as follows:
2.1.1
Canny Edge Based Segmentation
Canny edge based segmentation technique used to identify robust and fragile edges of central objects of an image in coherent arrangement. It intends to determine number of existing object presents in an image as well as detach crucial physical properties from objects easily. Significantly, it conserves the structural and contextual attributes of chief entity of an image while reducing the unrelated information such as frisking and distortion exists in an image. The operation of Canny technique is based on multi-stage algorithm. This operation is enforced on an image for segregating central object. The identification of extensive variety of changes occurs among boundary areas of objects in an image to separate pixel values [7]. However, the operational Canny function is used to detach noisy elements from objects of image deprived of disturbing operational attributes of edges of an image. The local gradient G(x, y) and edge direction ⍺ (x,y) is computed based on Canny operation that are shown in Eq. (1) and Eq. (2) as follows:
G(x,y)= [Gx + Gy]1/2 … (1)
⍺(x,y)=
… (2)
where Gx and Gy are the first order derivate as gradient of
image f (x, y). Further, ⍺(x, y) yields to detect edges in the gradient magnitude of an image. The standard (3*3) masks for Gx and Gy for an image are represented in Eq. (3) with pixels (x, y) as follows:
and … (3)
2.1.2
Sobel Edge Based Segmentation
Sobel edge based segmentation technique is executed as discrete discrepancy operator that changes each neighbourhood pixel with central region to construct an image accentuating edges. Using sobel function, user efficiently produces the enhanced estimations of gradient values that occur among boundary region of an image. In order to extract identifiable edges of object of an image, the value of gradient becomes extremely high. It is assumed as distinct differential function to highlight areas of improved spatial frequency. Also, sobel function is used to execute two dimensional spatial extents on image that resembles to edge content of an image effectively. Further, the operation of sobel function are executed on two (3x3) kernels. However, one kernel approximates gradient value in the x- direction whereas other estimates the range of gradient in the y- direction appropriately. The input image is convolved with both kernels to estimate the results of convolution derivatives in horizontal and vertical transformation [8]. At each point of an image, the gradient magnitude G may be approximated using Eq. (4) as follows:
… (4)
where Gx and Gy are gradients value among x and y direction of kernel of an image. The (3*3) masks for an image f (x, y) are represented in Eq. (5) as follows:
and
… (5)
2.1.3
Prewitt Edge Based Segmentation
Prewitt edge based technique is acquainted to enhance the intensity value from deepest to dimmest region by evaluating degree, extent and alignment of edges of an image. The execution of prewitt operation is resembled to sobel function whereas prewitt technique generates certain noisy effects. The local edge alignment of each single pixel is detected by evaluating the concentrated reaction of group of convolution kernels. The convolution process constructs the (3x3) mask in order to detect the discontinuities exists in grey level value of an image. The generated mask are placed along x and y direction of image subsequently. The centre of mask is convolved on each pixel value to detect incoherence on the edges of an image. In contrast to sobel technique, prewitt edge based technique never abides certain prominence on the pixels presents nearer to centre of the mask. The prewitt operation executes on two kernels among horizontal and vertical directions as Gx and Gy. The summations of two kernels in both directions suggest the intensity of the gradient in the current pixel value [9]. The prewitt operation is expressed in Eq. (6) as follows:
G= |Gx| + |Gy| … (6)
The standard (3*3) masks for both horizontal and vertical direction of an image f (x, y) are indicated in Eq. (7) as follows: and …(7)
2.1.4
Roberts Edge Based Segmentation
The operation of roberts edge based technique is assumed as discrete process to evaluates the two dimensional spatial gradient extent on an input image. It emphasizes on the portions consuming better spatial frequency range to reduce discontinuity occur on the edges of an image. The functioning of Roberts operator relies on cross format based algorithm method where edges among horizontal and vertical direction are identified exclusively. The discrete value for each image is computed depending on sum of squares of diagonal differences between two contiguous intensity ranges exist in both direction. The edges extracted from an image represent difference in intensity of grey level values. Further, the detached edges in resultant image show concrete divergence in the strength of boundary regions. Pixel values at each region of output image indicate the projected magnitude value of two dimensional spatial inclination of input image at that particular portion [10]. The gradients G is computed among both directions Gx and Gy that are expressed in Eq. (8) as follows:
… (8)
The masks designed for roberts technique are computed among x and y direction as shown in Eq. (9):
and … (9)
2.2
Clustering Based Segmentation
Technique
Clustering technique ascertain the collection of related pixel values based on features and attributes of object of an image. The input image involves one or more region of interest in order to segments chief object from image deprived of disturbing its feature. The operations of cluster technique are executed on an image based on certain rules to classify pixels value for constructing cluster effectively. Several clusters are created by assembling pixel values that perceive maximum similarity. The extents of generated clusters have been escalated with increase in similarity among designed clusters [11]. There exist various categories of clustering based segmentation techniques namely; Hierarchical clustering, Fuzzy C-means clustering, K-means clustering etc. Although, the K-means clustering technique is based on unsupervised learning process that is discussed as follows:
2.2.1
K-Means Clustering Segmentation
The procedure of K- Means clustering technique assist in dividing pool of objects from an image into some k groups/ clusters. It has been used to explore existing clusters in an image based on least squares partitioning concept. The cluster k is represented as positive integer number in order to classify certain objects into clusters based on some attributes and features. The selection of number of cluster objects from input image is identified to segregate range of pixel values as well as determines the mean value of objects for each cluster. Subsequently, it is used to determine the proximity of central cluster object cj that is the mean computed for each cluster
from n data point xi lies in nearby cluster designed.Therefore,
using clustering process user randomly selects points that are near to central cluster. The process has been repeated till the aggregate of squares among cluster error encloses lowered value [12]. The appropriate functioning of k-means algorithm J is expressed in Eq. (10) as follows:
J=
… (10)
where
represents intra distance. It emphasis on computing compression of the obtained clusters groups among data point xi and cluster central point cj. The experimental results of these segmentations techniques for Modi character components are shown in Table 1.
3.
PERFORMANCE PARAMETERS
FOR COMPARISION
The main aim lies at the comparative analysis of segmentation techniques in view of Modi character components. The relative study perceives existing level of discontinuities and similarity among boundary region of an image. Some performance parameters namely; MSE, PSNR, SC and SSIM are extensively enforced on Modi character images. These parameters are recognized as effective measure to analyze the amount of discontinuity/ incoherence exists in an image. The desired performance parameters are deliberated in this section as follows:
3.1
Mean Square Error (MSE)
It measures average of the squares of values that is difference between predictor and what is being approximate. In general, it covers non- negative values for an image. Although, the computed value that are closer to zero represents effective outcome [13]. MSE is the aggregate square difference
between the projected and the primitive image presented in Eq. (11) as follows:
MSE =
2...(11) where (m x n) is the range in the image and f is represented as the matrix data of primitive image where g is shown as the matrix data for segmented image. Thus, lower values of MSE indicate effective segmentation.
3.2
Peak Signal to Noise Ratio (PSNR)
Peak to Signal Noise Ratio yields fraction of maximum power of a signal and the power of segmented image that affects the quality of image impression. PSNR is indicated in the scale of logarithmic decibel as well as measured as peak deviation of an image. The standard format for PSNR comprises of two dimensional matrices. The dimension of segmented image matrix and original image matrix must be identical to achieve accurate results [13]. It is defined in Eq. (12) as follows:
PSNR = 20 *
… (12)
where, MAXf shows the maximum value of signal. The signal
value for MAXf is considered as 255 where pixels are shown as
8 bits per sample. It is noticed that higher value of PSNR represents segmented image more precisely.
3.3
Structural Similarity Index of Image
(SSIM)
It determines the deprivation of intensity pixel values based on some transition occur in an image and certain decisiveness present in an image. It is cast off as metric where it enumerates the eminence of image correctly [14]. The value for SSIM is computed for identical images x and y of size (n*n) expressed in Eq. (13) as:
SSIM(x, y) =
… (13)
where µx calculates the average of x image whereas µy
represents the average value computed for y image. On the other hand, σ2
x shows the computed variance for image x and σ2
y represents the variance value calculated for y image. σxy is
estimated covariance value for two identical images. In order to cast off the division value by weak denominator, c1 are
treated as the variable (k1L)2 and c2 as (k2L)2 respectively. The
values for k1 and k2 are set default as 0.01 and 0.03
correspondingly.
3.4
Structural Content (SC)
It is assumed as a metric that determine the amount of resemblances midst input and formed image. SC contrasts with the process of arranging the pixel in an image spatially. It is castoff to identify the extent of nearness among two digitized images effectively. It reveals that greater value of SC indicates the deprived quality of image [15]. The value for SC is evaluated for two images are expressed in Eq. (14) as follows:
SC =
… (14)
4.
COMPARATIVE ANALYSIS OF
SEGMENTATION TEXHNIQUES
The implementation of various existing edge based and cluster based segmentation techniques has been performed on 168 samples of Modi character images to segregate crucial structural information. A comparative performance analysis of segmentation techniques has been accomplished to isolate disjointed pixel values from Modi character image. The performance of segmentation techniques are evaluated on the basis of some measures such as MSE, PSNR, SC and SSIM on images. It measures the amount of segregated information in terms of intensity of pixel from an image. Moreover, highest value for PSNR shows most appropriate segmented value for two given images. Although, the lowest segmented values for MSE, SSIM and SC indicate the amount of segregation among strength of pixel value of two images effectively. Therefore, it is apparent that segmentation techniques having highest PSNR and lowest MSE, SSIM and SC value shows ratio of segregation information in effective way. Several remarks have been witnessed for estimating performance of segmentation technique that is illustrated in Table 2. The graphical representations of performance of various techniques based on measures are shown in Fig.1. Some of the observations are identified for segmentation techniques on the basis of parameters in terms of cases as follows:
Case I: Performance Analysis of Modi Vowels
In this scenario, the maximum PSNR value achieved as 50.42 and minimum values for MSE, SC and SSIM are gained as 0.59, 1.001 and 0.99 for ‘ई’ vowel based on clustering technique. Furthermore, using sobel edge based technique for segmenting ‘आ’ vowel the values of PSNR, MSE, SSIM and SC are indicated as 28.9, 83.76, 0.015 and -0.003 respectively. Also, the maximum value for PSNR are shown as 28.92 and the minimum value for MSE, SC and SSIM are represented as 83.5, 0.019 and 0.009 for ‘आ’ vowel using canny edge based technique correspondingly. With the usage of prewitt technique, the values for performance parameters are gained as 83.71, 28.9, 0.015 and -0.003 for ‘ई’ vowel. Also, the values for performance parameters using roberts edge based technique are specified as 28.92, 83.44, 0.019 and -0.006 for ‘ई’ vowel. As a result, K-means clustering technique indicates more appropriate segmented value for ‘ई’ vowel with regard to edge based techniques.
Case II: Performance Analysis of Modi Consonants In this case, the maximum value for PSNR gained as 28.90 and minimum value for MSE, SC and SSIM achieves as 83.86, 0.013 and 0.001 using prewitt edge based segmentation technique for ‘ढ’ consonant. Further, the segmented values on the basis of roberts edge based segmentation technique for ‘ढ’ consonant are shown by highest PSNR value as 28.92 and lowest MSE, SC and SSIM values gained as 83.44, 0.019 and -0.002. Also, with the usage of K-means clustering technique for ‘र’ consonant the values achieved by performance parameters are 49.98, 0.8, 1 and 0.992 respectively. Similarly, using canny edge based technique the calculated values for PSNR, MSE, SC and SSIM are represented as 28.91, 83.54, 0.017 and 0.005 for ‘ढ’ consonant respectively. Also, with usage of sobel edge based technique the values achieved as 28.9, 83.94, 0.012 and -0.002 for ‘ढ’ consonant individually.
Thus, using K-means clustering technique ‘र’ consonant is segmented properly based on results of performance parameter.
Case III: Performance Analysis of Modi Numerals Under this case, using K-means clustering the values for PSNR, MSE, SSIM and SC are gained as 50.72, 0.55, 1 and 0.994 for ‘१’ numeral individually. With the usage of canny edge based technique, the maximum value for PSNR achieved as 28.92 whereas minim value for MSE, SC and SSIM are shown as 84.13, 0.012 and 0.005 for numeral ‘८’. Further, the values achieved by PSNR, MSE, SC and SSIM using prewitt edge based technique are 28.88, 84.23, 0.009 and -0.001 correspondingly for numeral ‘८’. Using sobel edge based technique the values of PSNR, MSE, SSIM and SC are represented as 28.9, 83.94, 0.012 and -0.002 for ‘०’ numeral. Moreover, the values of performance parameters using roberts edge based technique are indicated as 28.9, 83.72, 0.017 and -0.004 for ‘०’ numeral. Thus, using K-means clustering method Modi numeral images are segregated in more efficient manner.
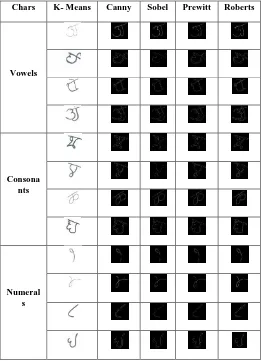
Table 1: Experimental Images of Segmentation Techniques on Modi Characters
Chars K- Means Canny Sobel Prewitt Roberts
Vowels
Consona nts
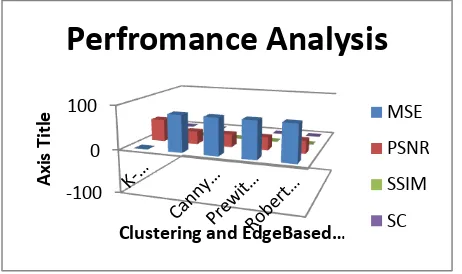
[image:4.595.298.559.321.682.2]Fig1: Performance Analysis of Segmentation Techniques based on Parameters
Table 2: Performance Analysis of Existing Segmentation Techniques on Modi Characters
-100 0 100
A
xi
s Ti
tle
Clustering and EdgeBased …
Perfromance Analysis
MSE
PSNR
SSIM
SC
Chars Modi chars
K- Means Clustering Canny Edge based Segmentation
Sobel Edge based
Segmentation
Prewitt Edge based
Segmentation
Roberts Edge based Segmentation
MSE PSNR SC SSIM MSE PSNR SC SSIM MSE PSNR SC SSIM MSE PSNR SC SSIM MSE PSNR SC SSIM
Vowels
0.59 50.42 1.001 0.99 83.57 28.91 0.018 0.008 83.75 28.9 0.015 -0.003 83.71 28.9 0.015 -0.003 83.44 28.92 0.019 -0.002
0.71 49.6 1.001 0.991 83.5 28.92 0.019 0.009 83.76 28.9 0.015 -0.003 83.75 28.8 0.015 -0.002 83.51 28.91 0.018 -0.005
0.75 49.4 1 0.993 83.82 28.9 0.014 0.003 84.13 28.89 0.01 0.002 84.12 28.88 0.01 0.002 83.73 28.9 0.015 0.001
0.93 48.47 1.001 0.992 83.65 28.91 0.016 0.007 83.89 28.89 0.013 -0.001 83.51 28.89 0.013 -0.001 83.5 28.91 0.018 -0.003
Cons
0.8 49.98 1 0.992 83.79 28.89 0.014 0.007 84.11 28.88 0.01 -0.002 84.1 28.88 0.011 -0.001 83.68 28.9 0.027 -0.004
0.67 49.89 1.001 0.988 83.86 28.89 0.014 0.007 83.94 28.9 0.012 -0.002 83.99 28.88 0.012 -0.002 83.72 28.9 0.017 -0.004
0.74 49.46 1.002 0.991 83.7 28.9 0.016 0.003 83.94 28.89 0.013 0.003 83.94 28.89 0.013 0.003 83.59 28.91 0.016 0.002
0.79 49.18 1 0.992 83.54 28.91 0.017 0.005 83.92 28.89 0.013 0.004 83.86 28.9 0.013 0.001 83.44 28.92 0.019 -0.006
Nums
1.09 50.71 1 0.995 84.13 28.92 0.012 0.005 84.23 28.88 0.009 -0.001 84.23 28.88 0.009 -0.001 84.04 28.89 0.012 -0.003
0.55 50.72 1 0.994 84.03 28.89 0.012 0.005 84.27 28.87 0.009 -0.001 84.27 28.87 0.009 -0.001 83.96 28.89 0.012 -0.003
0.63 50.16 1 0.994 84.16 28.88 0.01 0.002 84.28 28.87 0.009 0.002 84.28 28.87 0.009 0.002 84.09 28.88 0.011 0.002
5.
CONCLUSION
Segmentation stage assists in separating characteristics and contextual information from input image. Several edges based and clustering based segmentation techniques are executed on Modi character components that segment pixels value of image effectively. Four performance parameters are deliberated to analyze the performance of segmentation techniques irrespective of statistical differences. As a result, K-means clustering depicts efficient outcome in terms of segmenting ‘ई’ vowel as well as to segregate ‘र’ consonant efficiently in comparison to edge based technique. Hence, the most appropriate results are represented for segmenting ‘१’ numeral using K-means clustering in comparison with Modi vowels and consonants.
6.
REFERENCES
[1] Muhammad Waseem Khan, “A Survey: Image Segmentation Techniques”, International Journal of Future Computer and Communication, Vol. 3, No. 2, April 2014.
[2] C. Naveena and V.N. Manjunath Aradhya, “Handwritten Character Segmentation for Kannada Scripts”, IEEE World Congress on Information and Communication Technologies, November 2012.
[3] Jay H. Bosamiya, Palash Agrawal, Partha Pratim Roy and R. Balasubramanian “Script Independent Scene Text Segmentation using Fast Stroke Width Transform and GrabCut”, IEEE Asian Conference on Pattern Recognition, pp. 151-155, 2015.
[4] Naveen Tokas, Shruti Karkra and Manoj Kumar Pandey, “Comparison of Digital Image Segmentation Techniques- A Research Review”, International Journal of Computer Science and Mobile Computing, Vol. 5, Issue. 5, pp.215-220, May 2016.
[5] Manjula K. A, “Edge Detection as an Effective Technique in Image Segmentation for Image Analysis”, International Journal of Computer Science Trends and Technology, Vol. 2, Issue 4, pp. 126-131, December 2014.
[6] Sonam Saluja, Aradhana Kumari Singh, Sonu Agrawal, “A Study of Edge-Detection Methods”, International Journal of Advanced Research in Computer and Communication Engineering, Vol. 2, Issue 1, pp. 994-999, January 2013.
[7] Ali Abdo Mohammed Al-Kubati, Jamil A. M. Saif and Murad A. A. Taher, “Evaluation of Canny and Otsu Image Segmentation”, International Conference on Emerging Trends in Computer and Electronics Engineering, pp. 23-25, March 2012.
[8] Yuqin Yao, “Image Segmentation Based on Sobel Edge Detection”, International Conference on Advanced Materials and Computer Science, Vol.5, pp. 141-144, 2016.
[9] P. Sujatha and K. K. Sudha, “Performance Analysis of Different Edge Detection Techniques for Image Segmentation”, Indian Journal of Science and Technology, Vol. 8, No. 14, pp. 1-6, July 2015.
[10]Jaskirat Kaur, Sunil Agrawal and Renu Vig, “A Comparative Analysis of Thresholding and Edge Detection Segmentation Techniques”, International Journal of Computer Applications, Vol. 39, No. 15, pp. 29-34, February 2012.
[11]Dibya Jyoti Bora and Anil Kumar Gupta, “Clustering Approach towards Image Segmentation: An Analytical Study,” International Journal of Research in Computer Applications and Robotics Vol.2, Issue 7, pp. 115-124, July 2014.
[12]Preeti Panwar, Girdhar Gopal and Rakesh Kumar, “Image Segmentation using K-means clustering and Thresholding”, International Research Journal of Engineering and Technology, Vol. 3, Issue. 5, pp. 1787-1793, May 2016.
[13]Bhumika Solanki and Maya Ingle, “Performance Evaluation of Thresholding Techniques on Modi Script”, IEEE International Conference on Advanced Computation and Telecommunication, December 2018.
[14]Yusra A. Y. Al-Najjar and Der Chen Soong, “Comparison of Image Quality Assessment: PSNR, HVS, SSIM, UIQI”, International Journal of Scientific & Engineering Research, Vol. 3, Issue 8, pp. 1-5, August 2012.