Trace Level Arsenic Quantification through Methyl Red
Bromination
Malingappa Pandurangappa*, Kempahanumakkagaari Suresh Kumar
Department of Studies in Chemistry, Central College Campus, Bangalore University, Bangalore, India Email: *[email protected]
Received March 28, 2011; revised April 25, 2011; accepted May 2, 2011
ABSTRACT
A simple protocol has been developed for the quantification of trace level arsenic through methyl red bromination. The proposed method is based on the oxidation of arsenic(III) to arsenic(V) by the bromine and the residual bromine’s reac-tion with methyl red to form colorless bromo methyl red. As the concentrareac-tion of arsenic increases, the bleaching of the dye decreases due to bromine consumption. Measuring the intensity of the unreacted methyl red at 515 nm forms the basis of arsenic quantification. The molar absorptivity of this method has been found to be 2.25 × 10³ L/mol/cm. The
method obeys Beer’s law in the concentration range 0 - 0.25 µg/mL. The Sandell sensitivity and the limit of detection (LOD) were found to be 0.03 µg/mL/cm2 and 0.03 µg/mL respectively. The relative standard deviation has been found
to be 0.35% at 1.0 µg/mL. The reaction conditions have been optimized and the interference due to various common cations and anions were studied. The proposed method has been successfully applied to the determination of trace level arsenic in various environmental samples like water, soil and vegetable samples.
Keywords: Arsenite; Arsenate; Methyl Red; Bromination; Environmental Samples
1. Introduction
Arsenic is highly toxic and it has been identified as a public health problem due to its severe toxicity even at low exposure level and it is wide spread in the environ- ment [1]. This element has been classified as a group A carcinogen by USEPA (United States Environmental Protection Agency) as well as IARC (International agency for Research on Cancer) [2]. Living organisms are gen- erally exposed to this element primarily through food and water. The chronic exposure to arsenic can cause a vari- ety of adverse health effects like respiratory, cardiovas- cular, genotoxic, mutagenic and carcinogenic effects as well as dermal changes like melanosis, leukomelanosis and hyperkeratosis [2,3]. The major sources of this ele- ment include pigments, insecticides, herbicides, indus- trial production of metals, burning of coal and fossil fuels. Arsenic compounds are used in wood preservatives, glass manufacture, alloys, electronics, catalysts, feed additives and veterinary chemicals. Recent clinical investigations reveal that it can be used as in vitro antileukemic drug in the form of (2-phenyl-[3,2,1]dithiaarsolan-4-yl) methanol [4]. Arsenic contamination in natural water is a world wide problem and it has become a challenge for its re- moval for the scientists in recent years. It has been re- ported as ground water contaminant in several countries
including Mexico, Argentina, Poland, Canada, Hungary, Japan, Bangladesh and West Bengal of India [5-7].
The primary maximum contaminant level (MCL) for total arsenic in drinking water set by USEPA and World Health Organization (WHO) is as low as 10 ppb [8]. Knowledge of the speciation of arsenic in natural waters is an important task because the bioavailability, physio- logical and toxological effects of arsenic depend on its chemical form. Some arsenic species identified in water are arsenite, arsenate, monomethyl arsenic acid, dimethyl arsenic acid etc. Speciation analysis involves the use of analytical methods that can provide information about the concentration of the different physico-chemical forms of the element and total concentration in the sample. Spe- ciation of arsenic in environmental samples has gained very significance in recent years as the impact of toxic effects of arsenic are related to its oxidation state. The arsenic generally occur in the environment in different oxidation states such as As(V), As(III), As(0) and As(-III). Among these, As(III) is reported to be 25 - 60 times more toxic than As(V) and several hundred times more toxic than organo arsenicals [9]. This might be due to As(III) which can not be easily adsorbed or precipitated from natural waters because of its stability and solubility compared to As(V). Arsenic(III) ability to react with sul-fahydryl groups thereby increasing the residence time in
the body may be the reason, however organo arsenicals will get excreted easily out of the body. These facts indi-cate that monitoring As(III) at trace level would be of priority and also a challenging task to develop simple protocols for its quantification. Speciation of arsenic in water as well as in other environmental samples at trace level has been given a significant focus by the scientific community in recent years [2].
A wide variety of analytical methods for arsenic quan- tification have been reported. Among them, atomic ab-sorption spectrophotometry (AAS) [10], Inductively Cou- pled Plasma (ICP), HPLC [11] are popular, but these methods require either expensive instrumentation or ge- neration of highly toxic arsine gas. Other methods such as voltammetry [12], neutron activation analysis [13], X- ray fluorescence [14], differential pulse polarography [15], Ion chromatography [16] methods etc., are not used in routine analysis. Moreover the viability of many of these techniques to separate and determine arsenic spe- cies suffers because of time consuming or relatively complicated sample preparation procedures. Some of the spectrophotometric reagents used for arsenic determina-tion include silver diethyldithiocarbamate in which toxic arsine gas was generated and also toxic organic solvents like pyridine/chloroform have been used. The original arsenomolybdenum blue method is highly sensitive but it suffers severely from silicate and phosphate interfer- ences [17]. Complexation of arsenomolybdate with cate- chol or thiol and its subsequent ion pair formation with triphenylmethane or fluorescent dye facilitates the extra- ction of resulting complex into organic layer [18]. Though these methods are highly sensitive but they involve the use of organic solvent like benzene which is highly car-cinogenic in nature. Hence there is a need to develop a simple and sensitive method to quantify trace level arse-nic from a variety of environmental matrices.
Here in we report a sensitive and simple method for the determination of different forms of arsenic mainly trivalent and pentavalent ionic forms based on the reac-tion of arsenic with bromine and the subsequent reacreac-tion of residual bromine with methyl red dye to give a color-less bromomethyl red. The proposed method has been successfully applied to determine trace level arsenic from water, soil and vegetable samples.
2. Material and Methods
2.1. Instrumentation
Absorbance measurements were made using a Shimadzu scanning spectrophotometer (model UV-3101PC) with 1 cm quartz cuvettes and all pH measurements were car- ried out using Control Dynamics digital pH meter (model APX 175). ICP-AES analysis was carried out using Jobin
Yvon Horiba ICP-AES (model Ultima 2).
2.2. Chemicals and Reagents
All chemicals used were of analytical grade. Distilled water distilled by Gram-miniquartz distillation unit was used. Sulfuric acid, nitric acid, hydrochloric acid, per- chloric acid and hydrogen peroxide (30%) all purchased from Merck (AR grade) were used. Analar grade sodium arsenite, sodium arsenate, ascorbic acid, potassium io-dide, potassium bromide, potassium bromated and me- thyl red were procured from SD Fine-Chem. Limited, Mumbai. Stock solutions of arsenic III and V (1000 ppm) were prepared by dissolving appropriate quanties of so-dium arsenite and soso-dium arsenate using double distilled water. Working standards solutions were prepared by appropriate dilution of stock solution. Sulphuric acid (4.25 M) was prepared by diluting 59 mL of concentrated acid into 250 mL. Methyl red (0.01%) was prepared by dissolving 0.1 g of the dye in 1 mL of 4.25 M sodium hydroxide and diluting it to 100 mL. 10 mL of this so- lution was diluted to 100 mL after acidifying it by adding 1 mL of 4.25 M sulphuric acid. Bromate-bromide mix- ture for bromine generation was prepared by dissolving 0.05 g of potassium bromate and 0.5 g of potassium bromide and diluting to 500 mL with water. To generate 0.014 mM of bromine, 40 ml of 4.25 M sulphuric acid was added to 10 mL of above bromate-bromide mixture and diluted to 100 mL. Ascorbic acid (1%) was prepared weekly by dissolving 1 g in 100 mL distilled water and stored in refrigerator. Potassium iodide (10%) was pre- pared by dissolving 10 g of salt in 100 mL distilled wa- ter.
2.3. Sample Collection
2.3.1. Arsenic in Water Samples
The ground water contamination with arsenic mainly depends on the nature of soil as well as the human acti- vity within that region. Arsenic based paints have been extensively used in painting clay idols throughout the world. These idols were submerged in the waters of lakes or specified ponds after their procession during the selec- tive festival season in India and some other parts of the world. When these clay idols were submerged the water bodies as well as the soil sludges gets contaminated with arsenic. The water samples from these ponds or lakes (contaminated lake) were collected and analyzed for ar- senic content.
2.3.2. Arsenic in Soil Samples
from contaminated lake bed were analyzed.
2.3.3. Arsenic in Vegetable Samples
The plant uptake capacity for arsenic depends mainly on the level of arsenic present in the soil as well as the use of arsenic contaminated water. So the arsenic content in the tomato leaves and spinach leaves collected from the field were analyzed for their arsenic content.
2.4. Procedures
2.4.1. Recommended Procedure
Aliquots of standard arsenic(III) solutions (overall con-centration should be in the range 0.05 - 0.25 μg/mL) were transferred into 10 mL calibrated flasks. Then 3 mL of 0.014 mM bromine solution and 1.2 mL of 4.25 M sulphuric acid were added to these flasks and the reaction mixture was shaken gently. Then 0.4 mL of 0.01% methyl red was added and diluted up to the mark with distilled water. The absorbance values were measured at 515 nm against a reagent blank.
2.4.2. ICP-AES Method
The arsenic content in the natural samples have been determined by the ICP-AES technique in order to com-pare the results of the proposed method. Aliquots of standard arsenic(III) solutions (concentration range 0.01 - 1.0 μg/mL) were transferred into 10 mL calibrated flasks and made up to the mark with distilled water and ana-lyzed by the ICP-AES method for the construction of calibration plot.
2.5. Sample Preparation Protocols
2.5.1. Arsenic in Spinach Leaves (Spinacea oleracea)
The spinach leaves were dried under sun light and grinded into fine powder. 100 g of the powdered and sieved sample was placed in a beaker. 10 mL each of nitric acid and sulfuric acids were added and heated to 100˚C for 20 min in fume hood. The solution was cooled and 10 mL of perchloric acid was added and heated again in fume hood for 5 min. until the dense fumes of sulphur dioxide disappear completely. The sample was then cooled and 1 mL of HCl was added to remove any heavy metal ions present in the sample. The solution was heated for 15 min and washed with distilled water. Then it was transferred to a 50 mL volumetric flask and diluted to the mark with distilled water. Aliquots of 5 mL of the sample were used for the estimation of As(III) and As(V) ana-lyzed by the recommended procedure as well as by ICP- AES method [19].
2.5.2. Arsenic in Tomato Leaves (Lycopersicum esculentum)
About 100 g of tomato wet leaves were acid digested by
following the procedure given above and the solution was diluted to 100 mL. This solution was evaporated to reduce the volume to 10 mL for preconcentration of As. Arsenic species i.e. trivalent and pentavalent forms from these vegetable samples were estimated by following the procedure described as above [20].
2.5.3. Arsenic in Water Samples
Water samples from tube wells as well as ponds were collected in polyethylene containers. The collected water samples were filtered using whatman filter paper to re- move any suspended matter and analyzed for arsenic(III) by the proposed as well as standard methods. Similarly another aliquot of water sample was treated with few drops of potassium iodide (10%) in presence of hydro-chloric acid (5 M HCl) to reduce pentavalent arsenic to trivalent form. Then total arsenic content was analysed and the liberated iodine was destroyed by the addition of ascorbic acid. The difference between these two mea- surements provide As(V).
2.5.4. Arsenic in Soil Samples
2.5.4.1. Agricultural Soil
Soil samples collected from agricultural field were milled to break the lumps and sieved. The sieved samples were grinded to make it more homogeneous powderded form. Then 1 g of powdered sample was weighed and trans- ferred into 100 mL beaker. To this 2 mL of water in which 0.5 gram of KOH pellets dissolved were added and the mixture was heated on hot plate until the water evaporates and fuses for 2 min. Then it was diluted up to 50 mL. 5 mL aliquot of diluted sample solution was used to determine As by following the procedure given as above [20].
2.5.4.2. Soil Sludge
3. Results and Discussion
The bromine reacts with the methyl red dye to form col-orless bromomethyl red. The reaction of bromine with dye has been quantitative in acidic condition. Hence this property has been exploited to develop a simple and sen-sitive method for the quantification of arsenic at trace level. Initial studies were carried out by oxidizing As(III) to As(V) by the bromine and the residual bromine has been made to react with methyl red dye to form bromo substituted dye which was colorless. Due to the increase in the As(III) concentration the consumption of bromine increases which causes the decrease in the bromination of the dye. Hence the absorbance of the methyl red in-creases proportionately with the arsenic concentration. Preliminary studies were carried out by taking 25 mL calibrated flasks containing 5 mL of 0.014 mM of bro-mine and 3 mL of 4.25 M sulfuric acid. 10 µg of arsenic (III) was added and gently shaken for one minute fol-lowed by the addition of 1 mL of 0.01% of methyl red solution. Then it was made up to the mark with distilled water and the absorbance values were measured against the reagent blank at 515 nm. The experimental parame-ters like bromine concentration, reaction acidity, dye con- centration, the effect of interfering ions in the determina-tion of arsenic by the brominadetermina-tion of methyl red was op-timized to get the maximum sample absorbance and mini- mum blank value.
3.1. Effect of Reaction Acidity
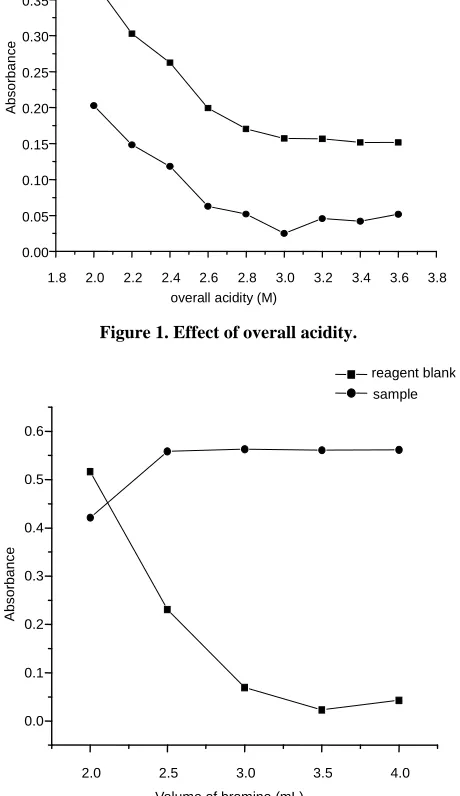
The bromination reaction of methyl red to form colorless bromomethyl red was quantitative in acidic medium. Hence sulphuric acid was used to provide the required acidity in order to optimize the bromination of the dye. Varying volumes of 4.25 M sulphuric acid were used to provide an overall acidity ranging from 1.8 to 3 M in 10 mL of the solution. In these experiments, 2 mL of bro-mine, varying volumes of 4.25 M sulfuric acid, 1 µg of arsenic solution and 0.4 mL of (0.01%) dye were added. The absorbance of the solutions was measured at 515 nm. Constant absorbance value for the sample with minimum blank was observed in the acidity range between 2.8 to 3.6. Hence an overall acidity of 3 M was maintained by the addition of 1.5 mL of 4.25 M sulfuric acid (Figure 1).
3.2. Effect of Bromine
The effect of bromine concentration was studied using 0.014 mM bromine solution. The bromine solution was prepared by using bromate-bromide mixture and sul-phuric acid. In order to establish the optimum concentra-tion of bromine required for the reacconcentra-tion was studied by taking 1.5 mL of 4.25 M sulphuric acid and varying volumes of 0.014 mM bromine, 1 µg of arsenic solution
and 0.4 mL of dye (0.01%) in 10 mL volumetric flasks. The measured absorbance values were found to be con-stant in the bromine concentration range between 2.5 - 4.0 mL. Hence 3 mL of bromate-bromide mixture was sufficient enough to provide the required bromine to brominate the dye to form colorless dye (Figure 2).
3.3. Effect of Reaction Time and Temperature
The bromination of methyl red was instantaneous and the reaction was carried out at room temperature, hence the variation of time for the bromination of methyl red was studied up to 30 min. There was no variation in the sam-ple absorbance value during the time interval studied, hence the effect of reaction time on sample absorbance has not been described here.
1.8 2.0 2.2 2.4 2.6 2.8 3.0 3.2 3.4 3.6 3.8 0.00
0.05 0.10 0.15 0.20 0.25 0.30 0.35 0.40
sample reagent blank
A
bs
or
banc
e
overall acidity (M)
2.0 2.5 3.0 3.5 4.0
[image:4.595.310.536.286.477.2]0.0 0.1 0.2 0.3 0.4 0.5 0.6
Figure 1. Effect of overall acidity.
k sample reagent blan
A
bsor
b
ance
Volume of bromine (mL)
[image:4.595.309.539.317.715.2]3.4. Effect of Foreign Species
400 450 500 550 600 0.0
0.1 0.2 0.3 0.4 0.5 0.6 0.7 0.8
b - 0.10 ''
e
d
c
b
a
e - 0.25 '' d - 0.20 '' c - 0.15 '' a - 0.05 μg arsenic
Ab
so
rb
a
n
ce
e
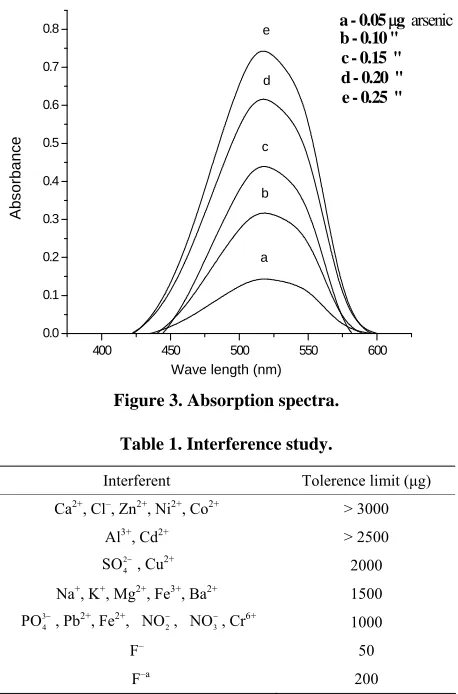
In order to evaluate the suitability of the proposed me- thod for the determination of arsenic species in water samples, the interference study was carried out. The in- terfering ions were added in the form of their respective salts to find the interference. Initially the interference of several anions like chloride, fluoride, sulfate, nitrate, nitrite, phosphate was studied. The tolerance limit for chloride was found to be 3000 µg, where as for all other ions except fluoride was 1000 µg. The interference due to fluoride was overcome by precipitating as silver fluo- ride and removing through centrifugation up to 200 μg level. The tolerance limits of various cations like calcium, magnesium, ferrous, ferric iron and other toxic metal ions like lead and chromium were studied. The tolerance limit for calcium was above 3000 µg, where as for mag-nesium, ferrous, ferric iron, lead and chromium was up to 1000 µg level. The effect of other cations like, zinc, ni- ckel, cobalt, aluminium, cadmium, copper, potassium and silver were also studied. The tolerance limits of various cations and anions were given in Table 1.
d
b
s
or
ba
nc
e c
b
A
a
3.5. Species Responsible for Color
Bromine oxidizes arsenic(III) to arsenic(V) and the re-sidual bromine reacts with the methyl red forming color-less bromomethyl red. As the arsenic concentration in-creases, the residual bromine concentration decreases there by the decrease in the bromomethyl red formation. Hence the absorbance of the dye linearly increases with the increase in arsenic concentration. The absorbance of the unreacted methyl red has been measured at 515 nm and it was correlated with the arsenite concentration (Scheme 1 & Figure 3).
3.6. Analytical Merits of the Method
The proposed method is simple and doesn’t require any extraction step to lower the detection limit unlike other methods. It has least interference from common ionic species like phosphate, chloride, fluoride etc. The San-dell sensitivity and the limits of detection of the method were found to be 0.03 µg/mL/cmand 0.03 µg/mL re- spectively. The method obeyed Beer’s law in the con- centration range 0 - 0.25 µg/mL. The sensitivity and de- tection limit of the method is very good and can be used as an alternative method to estimate the arsenic at trace level (Table 2). The proposed method has been com-
pared with some of the reported methods (Table 3).
3.7. Application Study
In order to check the validity of the proposed method, it has been applied to determine arsenic levels from natural samples like water samples, soil samples and vegetable
[image:5.595.310.539.82.429.2]Wave length (nm)
Figure 3. Absorption spectra.
Table 1. Interference study.
Interferent Tolerence limit (μg) Ca2+, Cl–, Zn2+, Ni2+, Co2+ > 3000
Al3+, Cd2+ > 2500 2
4
SO−
3 4
PO−
2
NO− 3
NO−
, Cu2+ 2000
Na+, K+, Mg2+, Fe3+, Ba2+ 1500
, Pb2+, Fe2+, , , Cr6+ 1000
F– 50
F–a 200
aTreated with AgNO
3 before adding bromine solution to precipitate fluoride
[image:5.595.306.538.477.550.2]as silver fluoride and it was removed by centrifugation.
Table 2. Analytical features of the proposed method.
Parameters Proposed method
Linear range (µg/mL) 0.05 - 0.25 Limit of detection (µg/mL) (3 σ, n = 5) 0.03
Sandell sensitivity (µg/mL/cm2) 0.03
Relative standard deviation (%) (n = 5) at(0.1 µg) 0.35
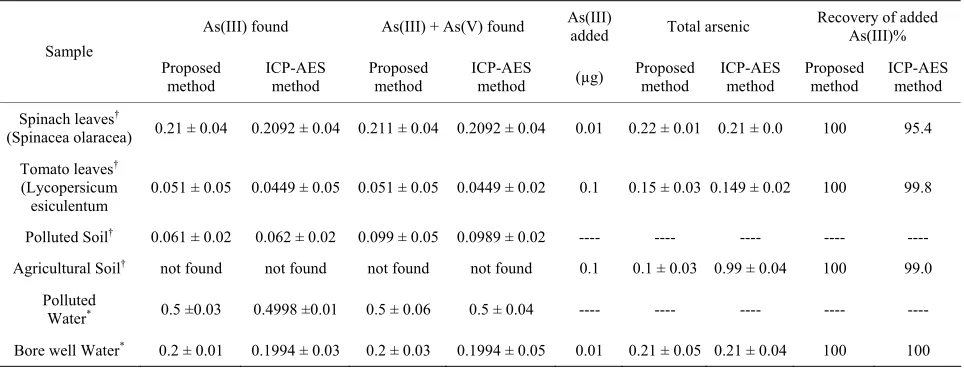
samples. The efficiency of the % recovery of the spiked samples were also carried out. The results obtained by the proposed method are in good agreement with the re- sults of the ICP-AES method (Table 4).
4. Conclusion
Scheme 1. Species responsible for color.
Table 3. Comparison of the proposed method with other methods.
S.No. Reagent Wavelength (nm) Linear range (μg/mL) absorptivity Molar (L/mol/cm)
Remarks References
1 Ammonium molybdate 460 1 - 30 ---- Phosphate, silicate, interfere severely [17] 2 4-Dimethylamino benzaldehyde 460 1 - 25 2.5 × 10³ Extraction needed, low color stability [22]
3 N-phenylbenzohydroxamic acid 410 0.37 - 8.0 1.1 × 10⁴ Toxic reagent, CHCl
3 is used for extraction [23]
4 N, N’-diphenylbenzamidine 395 0.5 - 8.0 7.9 × 10³ Toxic reagent, CHCl
3 is used for extraction [24]
5 Methyl red 515 0.05 - 0.25 2.25 × 10³ Simple protocol, no extraction, high color
[image:6.595.58.540.365.549.2]stability, less interference [Proposed method]
Table 4. Determination of arsenic from different environmental samples.
As(III) found As(III) + As(V) found As(III) added Total arsenic Recovery of added As(III)% Sample
Proposed method
ICP-AES method
Proposed method
ICP-AES
method (µg)
Proposed method
ICP-AES method
Proposed method
ICP-AES method
Spinach leaves†
(Spinacea olaracea) 0.21 ± 0.04 0.2092 ± 0.04 0.211 ± 0.04 0.2092 ± 0.04 0.01 0.22 ± 0.01 0.21 ± 0.0 100 95.4
Tomato leaves†
(Lycopersicum esiculentum
0.051 ± 0.05 0.0449 ± 0.05 0.051 ± 0.05 0.0449 ± 0.02 0.1 0.15 ± 0.03 0.149 ± 0.02 100 99.8
Polluted Soil† 0.061 ± 0.02 0.062 ± 0.02 0.099 ± 0.05 0.0989 ± 0.02 ---- ---- ---- ---- ----
Agricultural Soil† not found not found not found not found 0.1 0.1 ± 0.03 0.99 ± 0.04 100 99.0
Polluted
Water* 0.5 ±0.03 0.4998 ±0.01 0.5 ± 0.06 0.5 ± 0.04 ---- ---- ---- ---- ----
Bore well Water* 0.2 ± 0.01 0.1994 ± 0.03 0.2 ± 0.03 0.1994 ± 0.05 0.01 0.21 ± 0.05 0.21 ± 0.04 100 100
†Concentration in µg/g; *Concentration in µg/mL.
REFERENCES
nic from bore well water and soil samples. The proposed method was also applied to determine trace level arsenic in vegetable samples like spinach leaves and tomato. The results obtained by the proposed method have been in good agreement with the results obtained by the ICP- AES method.
[1] F. Colangelo, R. Cioffi, M. Lavorgna, L. Verdolotti, L. E. Munoz and S. P. Almero, “Analysis and Speciation of Ar- senic by Stripping Potentiometry: A Review,” Talanta, Vol. 65, No. 3, 2005, pp. 613-620.
doi:10.1016/j.talanta.2004.07.034
[2] B. K. Mandal and K. T. Suzuki, “Arsenic round the World: A Review,” Talanta, Vol. 58, No. 1, 2002, pp. 201-235.
5. Acknowledgements
[3] B. Pesch, U. Ranft, P. Jakubis, M. J. Nieuwenhuijsen, M. Vega, L. Deban, R. Pardo and G. Gonzalez, “Determina-tion of Copper and Arsenic in Refined Beet Sugar by Strip- ping Voltammetry without Sample Pretreatment,” Analyst, Vol. 123, No. 4, 1998, pp. 743-747.
The authors acknowledge the financial support and award of the fellowship to KS by the University Grants Commission (UGC), New Delhi, India. The authors thank Mr. Vijayarajulu, Geological Survey of India, Govt.
Astier, “(2-Phenyl-[1, 3, 2]dithio-arsolan-4-yl)-methanol Derivatives Show in Vitro Antileukemic Activity,” Jour-nal of Organometallic Chemistry, Vol. 691, No. 5, 2006, pp. 1081-1084.
[5] X. Dai and R. G. Compton, “Detection of As(III) via Oxidation to As(V) Using Platinum Nano Particles Modi- fied Glassy Carbon Electrodes: Arsenic Detection without Interference from Coppe,” Analyst, Vol. 131, No. 4, 2006, pp.516-521. doi:10.1039/b513686e
[6] D. Das, A. Chatterjee, B. K. Mandal, G. Samanta, D. Charkroborty and B. Chanda,“Arsenic in Ground Water in Six Districts of West Bengal, India: The Biggest Arse-nic Calamity in the World Part 2. ArseArse-nic Concentration in Drinking Water, Hair, Nails, Urine, Skin-Scale and Liver Tissue (Biopsy) of the Affected People,” Analyst, Vol. 120, No. 3, 1995,pp. 917-924.
[7] P. L. Smedley and D. G. Kinniburgh, “A Review of the Source, Behavior and Distribution of Arsenic in Natural Waters,” Applied Geochemistry, Vol. 17, No. 5, 2002, pp. 517-568.
[8] K. Subrata, S. Kumar, M. Mandal, T. Pal and A. Pal, “Spec- trophotometric Determination of Arsenic via Arsine Gen-eration and in Situ Colour Bleaching of Methylene Blue (MB) in Micellar Medium,” Talanta, Vol. 58, No. 5, 2002, pp. 935-942. doi:10.1016/S0039-9140(02)00434-4 [9] M. Burguera and J. L. Burguera, “Analytical Methodol-
ogy for Speciation of Arsenic in Environmental and Bio-logical Samples,” Talanta,Vol. 44, No. 9, 1997, pp. 1581- 1604. doi:10.1016/S0039-9140(97)00064-7
[10] R. K. Anderson, M. Thompson and E. Culbard, “Selec-tive Reduction of Arsenic Species by Continuous Hydride Generation. Part I. Reaction Media,” Analyst, Vol. 111, No. 10, 1986, pp. 1143-1152.
doi:10.1039/an9861101143
[11] C. T. Tye, S. J. Haswell, P. O. Neill and K. C. C. Ban-croft, “High-Performance Liquid Chromatography with Hydride Generation/Atomic Absorption Spectrometry for the Determination of Arsenic Species with Application to Some Water Samples,” Analytica Chimica Acta,Vol. 169, 1985, pp. 195-200.
[12] R. I. Mrzljak, A. M. Bond, T. J. Cardwell, R. W. Cattrall, O. M. G. Newman, B. R Champion and J. Hey, “Efficient Procedures for the Voltammetric Determination of Total Arsenic in Zinc and Cadmium Plant Electrolyte Process Streams and in Industrial Effluents,” Analyst, Vol. 119, No. 5, 1994, pp. 1051-1056.
[13] E. Steinnes, “A Two-Group Separation Scheme for the Determination of Eleven Trace Elements in Biological Material by Neutron Activation Analysis,” Analytica Chimica Acta, Vol. 78, No. 2, 1975, pp. 307-331
[14] R. R. Brooks, D. E. Rayan and H. Zang, “Atomic Ab-sorption Spectrometry and Other Instrumental Methods for Quantitative Measurements of Arsenic,” Analytica Chimica Acta, Vol. 131, 1981, pp. 1-16.
[15] F. T. Henri and T. M. Thorpe, “Determination of Arsenic (III), Arsenic(V), Monomethyl Arsonaate, and Dimethyl Arsinate by Differential Pulse Polarography after Separa-tion by Ion Exchange Chromatography,” Analytical Che- mistry,Vol. 52,1980, pp. 80-83.
[16] A. A. Ammann, “Arsenic Speciation Analysis by Ion Chro- matography—A Critical Review of Principles and Appli-cations,” Science Research, Vol. 2, No. 1, 2011, pp. 27- 45.
[17] D. K. Gullstrom and M. G. Mellon, “Spectrophotometric Determination of Arsenic and Tungsten as Mixed Heter-opoly Acids,” Analytical Chemistry, Vol. 25, No. 12, 1953, pp. 1809-1813.
[18] T. Pal, N. R. Jana and T. K. Sau, “Determination of Arse-nic in Aqueous Samples with Solvent Extraction of Ion Associates,” Analytical Proceedings Including Analytical Communications, Vol. 32, No. 9, 1995, pp. 369-370. [19] H. D. Revanasiddappa, B. P. Dayananda and T. N. K.
Kumar, “A Sensitive Spectrophotometric Method for the Determination of Arsenic in Environmental Samples,” Environmental Chemistry Letters, Vol. 5, No. 3, 2007, pp. 151-155.
[20] G. P. Sunitha and V. K. Gupta, “A New System for the Spectrophotometric Determination of Arsenic in Envi-ronmental and Biological Samples,” Analytica Chimica Acta, Vol. 408, No. 1-2, 2000, pp. 111-115.
[21] T. Cherian and B. Narayana, “A New Spectrophotometric Method for the Determination of Arsenic in Environ-mental and Biological Samples,” Analytical Letters, Vol. 38, No. 13, 2005, pp. 2207-2216.
[22] E. Kavlentis, “Spectrophotometry Determination of Arse-nic(III) and Antimony(III) by Means of Isonicotinoyl Hy- drazones of 4-Dimethylaminobezaldehyde (4-Dbih) and 2-Hydronap-hthaldehyde (2-Hnih),” Analytical Letters, Vol. 20, No. 12, 1987, pp. 2043-2047.
[23] Y. K. Agarawal and S. K. Patke, “Extraction and Spec-trophotometric Determination of Arsenic in the Environ- ment,” International Journal of Environmental Analytical Chemistry,Vol. 8, 1980, pp. 157-162.