A Distributed Energy Efficient Query Processing
in Self-Organized Wireless Sensor Networks
Abstract—Spatial query execution is an essential functionality of a sensor network. Redundancy within a sensor network can be exploited to reduce the communication cost incurred in execution of such queries. Any reduction in communication cost would result in an efficient use of battery energy, which is very limited in sensors. One approach to reduce the communication cost of a query is to self-organize the network, in response to a query, into a topology that involves only a small subset of the sensors sufficient to process the query. In this paper, we design an efficient algorithm for the above problem of self-organization of a sensor network into an optimal logical topology, to reduce energy consumption, in response to a query. We introduce the EEDSOSC algorithm, a new Energy Efficient Distributed Self-organization approximation algorithm for Optimal Sensor Cover that produces a near-Optimal Sensor Cover with minimum consumed energy, minimum connected sensor cover and less message communication overhead. The performance of algorithm is tested for both dense and sparse sensor networks. Through extensive simulations, we have shown that our designed technique result in substantial energy savings in a sensor network. Moreover, experiments have been conducted on networks with different sensors transmission radius, different query sizes, and different network configurations. All experimental tests are evaluated using simulations and the experimental results showed that the proposed approach results in a significant communication cost reduction and an energy-efficient near-optimal connected sensor cover. Compared with other techniques, the results demonstrated a significant improvement of the proposed technique in terms of energy-efficient query cover with lower communication cost.
Index Terms—wireless sensor network, query cover, energy consumption, redundancy
I. INTRODUCTION
Wireless sensor networks are often deployed for passive data-gathering or monitoring in geographical region. A sensor network [1]-[4] consists of sensor nodes with short range radios and on-board processing capability each sensor can also sense certain physical phenomena such as light, temperature, vibrations, or magnetic field around its location. The purpose of a sensor network is to process some high-level sensing
Manuscript received March 21, 2007.
M. A. Hamza is with the College of Management and Technology, Arab Academy for Science and Technology, P.O. 1029, Alexandria., EGYPT (e-mail: [email protected]).
S. M. Youssef is with the Computer Engineering Department, College of Engineering & Technology, Arab Academy for Science and Technology, P.O. 1029, Alexandria., EGYPT (phone:203-5622366; fax: 203-562-0245; e-mail: [email protected]).
S. F. Fayed is with the Computer Engineering Department, College of Engineering & Technology, Arab Academy for Science and Technology, P.O. 1029, Alexandria., EGYPT (e-mail:[email protected]).
network by selecting the optimal subset of sensors that is sufficient to process a given query. The rest of the paper is organized as follows. In Section II, we define and formulate the problem under investigation. In section III, we introduce a new distributed self-organization algorithm for efficient query cover in WSN and present the design and analysis of the proposed work. Section IV presents the simulation results and comparisons depicting the performance of our proposed algorithm, conclusions are presented in section V.
II. FORMULATION OF THE PROBLEM
Given a query Q over a sensor network, select an optimal set of sensors that satisfy the conditions of coverage as well as connectivity, i.e., selecting a minimum number of sensors that are sufficient to answer the query such that: 1) the sensing region of the selected set of sensors cover the entire geographical region of the query, 2) the selected set of sensors form a connected communication graph where there is an edge between any two sensors that can directly communicate with each other, and 3) The selected set of sensors should form a minimum cover-size connected communication graph, so that they can form a logical routing topology for data gathering and transmission to the query source. In addition, (4) query processing must incorporate energy awareness into the system to extend the lifetime of the sensor nodes and network by reducing the total energy consumption. This is fulfilled by assigning a weight to every sensor in the network according to the amount of energy it consumes. During the selection of sensors into the cover the factor of energy consumption is taken into consideration by choosing the sensor with the minimum weight, i.e. minimum consumption of energy, because this guarantee a higher cover life time which is more suitable for long running queries. Further more, the required algorithm needs to reduce the number of exchanged messages for coordination and minimize the computation load on the sensor nodes.
[image:2.595.367.497.324.444.2]A sensor network is modeled as a set N of a large number of sensors, |N|, distributed randomly in a geographical region. Each sensor has a unique identifier (ID) Viand is capable of sensing a well-defined convex region SR around itself called
sensing region. Each sensor also has a radio interface and can communicate directly with some of the sensors around it. Each sensor node has a different energy consumption attribute, the lower the consumption attribute the higher the sensor survivability. The sensor network is represented with an undirected graph G with set of vertices V and set of edges E. The sensor network consists of |N| sensor nodes. If two sensors can communicate directly then they are connected with a virtual edge, i.e. their sensing disks intersects (connection edge). A Query Q in a sensor network asks for the summarization of some sensed data/events over some time window and geographical region, which is a subset of the overall region covered by the sensing regions of all the sensors in the network. A query is typically run multiple times, possibly, for different time windows
III. THE PROPOSED ENERGY-EFFICIENT DISTRIBUTED SELF-ORGANIZATION ALGORITHM FOR OPTIMAL
SENSOR COVER (EEDSOSC)
In this section, a new Energy-Efficient Distributed Self- organizing algorithm is proposed with Optimal Sensor Cover that produces a near-Optimal Sensor Cover with minimum cover-size, less message communication overhead and minimum energy consumption. The network is assumed to have sensor nodes with different energy consumption capabilities. In this section, we present an alternate modified distributed approach that uses a lower number of messages and can scale well for large dense networks with the least consumption of energy, while maintaining a guarantee an upper-bound on the size of the connected sensor cover delivered by the applied algorithm.
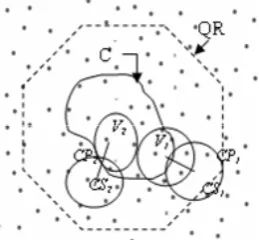
It is assumed that every sensor is capable of sensing a well defined convex region around itself and can communicate directly with some of the sensors around it if the distance between them is within the transmission radius t. Fig. 1 illustrates an example of a query region QR and the region covered by C.
Figure 1 Geographic query region QR inside the network’s boundary.
Candidate sensors:CS1 and CS2; associated candidate paths: CP1
and CP2; cover: C.
Given a current cover Ci, the control is distributed over the
set B of boundary sensors for the selection of the next candidate sensors. This selection of the next candidate sensors will be based on boundary node’s local neighborhood information of the current cover. Our proposed algorithm goes through the following sequence of stages:
(1) Choosing the boundary sensors: at each iteration of the
algorithm, the set B will be updated with the new boundary sensors by checking the location of every sensor Ci in the
current cover C with respect to the center of the cover. If C i
falls within a certain threshold range then it will be considered a boundary sensor and added to the set B. The threshold range is between Min_Boundary_dist and Max_Boundary_dist. As illustrated in Fig. 2, all sensors that lie between boundary thresholds are defined as boundary sensors.
not give any additional uncovered areas to be added to the cover). Adding these candidate sensors to the cover will just increase the redundancy of sensors and waste energy.
Figure 2 The cover C and the boundary sensors that will be selected in
B; Sensors in B broadcasts VCS messages to the neighbor sensors
(2) Finding possible Candidate sensors: Every sensor BL in the updated set B broadcasts a View Candidate Sensors (VCS)
message to all the neighbor sensors, Vi
∉
C, falling at adistance not less than Boundary_Dist_threshold. We choose this threshold to eliminate the number of broadcasted messages to sensors having nearly the same sensing regions as other sensors in C (i.e. reducing the consumption of energy by keeping sensors that will not add any gain to the cover inactive). The VCS message contains the ID of the originating sensor of the message.
(3) Collecting Candidate paths: Any sensor Vi receives a
VCS message checks to see if it is a new candidate sensor, i.e., if Vi’s sensing region intersects with the sensing region of
some sensor in the boundary sensors set. Moreover, it checks whether the minimum distance between it and all other sensors in C is greater than or equals to the Dist_threshold to avoid redundancy. This will eliminate the redundancy of sensors having the same sensing region in the selected cover. If Vi is a
candidate sensor CSi, it unicasts a KEepAlive (KEA) message
to the originating sensor of the VCS message informing that it is one of the candidate sensors. The KEA message contains the candidate path connecting CSi to some sensor in C.
(4) Choosing the most beneficial candidate path/sensor: Every sensor BL in B, which was the originator of the VCS
messages in the current stage, collects all the KEA messages sent to it by the candidate sensors. The fitness of every candidate path contained in each received KEA message is calculated. After finding the fitness of all candidate paths in this stage, the sensor with the highest fitness is added to the cover.
(5)Check for query coverage: The above process repeats until the selected set of sensors C covers the entire query region in the sensor network. One of the most principle features of the EEDSOSC algorithm is that the Boundary_Dist_threshold is dynamically adapted. The algorithm starts with an initial setting for the Boundary_Dist_threshold. Then, at each iteration in which the candidate set returns empty, the
Boundary_Dist_threshold is decreased and the candidate selection process is repeated. This adaptive selection mechanism allows the EEDSOSC approach to dynamically adapt for different network distributions and density.
IV. EXPERIMENTAL RESULTS
Experiments have been conducted to illustrate the efficiency of the proposed algorithm. A simulator is constructed to evaluate the performance and compare with other algorithms in terms of average consumed energy, communication overhead and solution cover size. We ran our algorithms on randomly generated sensor networks wherein a certain number of sensor nodes |N| are placed randomly in an area of 100×100 unit square. All sensor nodes have a circular sensing region of radius rs associated with them. The size of rectangular region, number of nodes |N|, sensing radius rs, and transmission
radius t are input parameters of the simulator.
We vary the network size |N| from 100 to 800 (which provides substantial redundancy) randomly placed sensors. Also, we vary the transmission radius t of sensor nodes from 10 to 20 units. The query region is a circular region of radius
rqwithin the rectangle area. Experiments have been conducted
with different generated query radius (rq=10, 15, 20, …, 50).
Each sensor node has a different energy consumption attribute, the lower the consumption attribute the higher the sensor survivability. Sensors have a sensing region of radius rs = 10.
This range of parameters allows us to study the performance for sparse to dense networks. Our experiments with lower values of t and |N| showed that the network was too sparse that a connected sensor cover did not exist (Query Not Covered (QNC)). For t > 10, the sensors with intersecting sensor disks are reachable within one hop (i.e. link radius
r=2). Thus, one set of experiment for t> 10 is sufficient. The algorithm computes the total energy consumption of the selected cover (En), the number of messages transmitted during the algorithm (a measure of the communication overhead of the algorithm), and the size of the connected sensor cover constructed, for a given set of input parameters. Let D be the number of messages needed to compute a connected sensor cover and c be the size of the computed connected sensor cover. Query source is randomly selected sensor. Furthermore, we compare the performance of our proposed EEDSOSC algorithm with the centralized and decentralized greedy algorithms [4].
Let c be the cover size returned by the decentralized greedy algorithm and let cc be the cover size returned by the
centralized greedy version. Fig. 3 illustrates the change in the ratio c/cc versus t. The figure depicts excellent performance of
the decentralized approximation algorithm relative to the greedy centralized one. The ratio c/cc always remains close to
the ideal value of 1. Thus the optimizations induced in the decentralized approximation algorithm to reduce communication cost do not impact the c/cc ratio, which
remains close to the ideal. Moreover, for dense WSN (high |N|
Figure 3 Cover size ratio of the distributed versus. centralized (c / cc )
Note that c is very small relative to the network size |N|, except for low |N| and t when the communication graph is very sparse and there is low redundancy in the network. A random network for some low values of t and |N| may not have a connected communication graph with high probability.
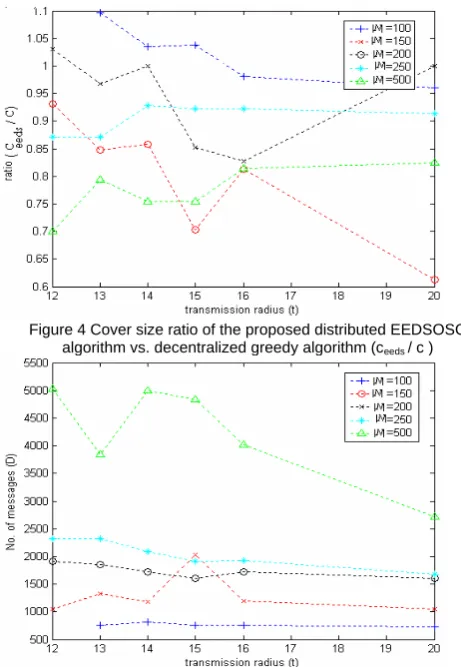
Let ceeds be the size of the connected sensor cover returned
by the proposed EEDSOSC algorithm and c is the sensor cover returned by the decentralized greedy algorithm. Fig. 4 plots the ratio ceeds/c versus t for different network sizes. Since
the ratio is almost less than or close to 1, the new distributed EEDSOSC algorithm, which depicts excellent performance in consumed energy reduction and in reducing the number of messages, either is combined with reducing the cover size or does not impact the ceeds/c ratio, which remains close to the
ideal. Moreover, Fig. 5 illustrates the performance of the decentralized greedy algorithm in terms of the number of messages, D. It plots D versus t for various values of network size.
Fig. 6 plots the ratio between the number of messages of EEDSOSC and the decentralized greedy query cover algorithm versus t, for different network sizes. It is observable from the chart that there is a dramatic decrease in the number of messages for the proposed EEDSOSC algorithm compared to the decentralized greedy query cover version for different network configurations and different t values. Moreover, for large dense networks (large |N| and high values of t) the improvement is noticeable. It is observable from Fig. 6 that the ratio is more less than 1.
Let Eneeds be the total energy consumption of the query cover produced by the proposed EEDSOSC algorithm, and
Endsbe the total energy consumption of the query cover using
[image:4.595.303.534.82.416.2]the distributed minimum-size cover algorithm (DSOSC), where the DSOSC is another version of our proposed algorithm in which the sensor nodes energy consumption are not considered in the candidate selection for minimum query cover. This version is implemented to illustrate a fair comparison with such algorithms that do not consider the sensor energy consumption factors.
Figure 4 Cover size ratio of the proposed distributed EEDSOSC algorithm vs. decentralized greedy algorithm (ceeds / c )
Figure 5.The performance of the decentralized greedy algorithm in terms of number of messages D. The graph illustrates the number of
messages D versus t, for different WSN sizes.
[image:4.595.46.268.84.240.2]Figure 6 The relation between the number of messages of EEDSOSC and Decentralized greedy algorithm, for different network sizes.
[image:4.595.306.525.440.601.2]Figure 7-(a) The total energy consumption of query cover, for a network of size 250, for various transmission radius t.
Figure 7-(b) The total energy consumption of query cover, for a network of size 500, for various transmission radius t.
Fig. 8-(a) plots the ratio Eneeds/Ends versus t for different
network sizes. Since the ratio is almost less than or close to 1, the new distributed EEDSOSC algorithm, which depicts excellent performance in reducing the number of messages, is combined with a great reduction in the energy consumption of the query cover.
Let Ceeds be the sensors cover size produced by the
EEDSOSC algorithm, and Cds is the cover size produced by
[image:5.595.46.275.77.428.2]DSOSC.
Figure 8 Comparison between EEDSOSC and DSOSC for different network sizes and transmission radius t;(a) shows the ratio Eneeds/Ends;
(b) shows the ratio ceeds/cds
As shown from fig. 8-(b), cover size returned by the EEDSOSC is not much higher than that returned by DSOSC. The ratio ceeds/cds remains approximately close to 1.
As observed from fig. 8-(a) and fig. 8-(b), while there is a great reduction the total energy consumption using the EEDSOSC, the optimizations induced in the algorithm to reduce energy consumption do not impact the ceeds/cds ratio,
[image:5.595.307.522.82.238.2]which remains close to the ideal. Moreover, for dense WSN (high |N| and t) there is a significant decrease in the consumed energy produced by the EEDSOSC. The above observation validates the approach for both dense and sparse WSN.
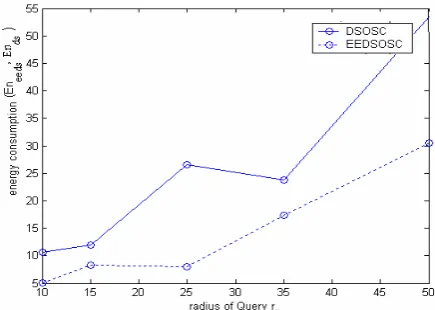
Fig. 9 illustrates the energy consumption of the resulted query cover for different values of generated query radius (queries of different sizes), applied for both the EEDSOSC and DSOSC algorithms. As shown in fig. 9, the energy consumption of the query cover in case of EEDSOSC is considerably lower than the corresponding value in case of the distributed DSOSC version. Moreover, the improvement is noticeable in case of large generated queries (with wide diameters), where the energy consumption of the cover is getting more reduced for EEDSOSC while there is a dramatic increase in the consumed energy in case of the DSOSC version.
Figure 9 Comparison between the energy consumption of the query cover for both the EEDSOSC and DSOSC algorithms, for different
[image:5.595.55.278.83.236.2] [image:5.595.45.270.254.422.2] [image:5.595.317.535.559.714.2] [image:5.595.47.265.572.726.2]V. CONCLUSION
In this paper we have introduced the EEDSOSC algorithm, a new Energy Efficient Distributed Self- organized approximation algorithm with Optimal Sensor Cover that produces a near-Optimal Query Cover with minimum consumed energy and minimum message communication overhead. Efficient query plans are generated that are more efficient in terms of energy consumption, cover size, message overhead, in addition to overcome many of the limitations of centralized approaches. The designed technique exploits the redundancy in the sensor network by selecting the optimal subset of sensors that is sufficient to process a given query. Select an optimal set of sensors that satisfy the conditions of coverage as well as connectivity. In addition, the proposed algorithm has reduced the number of exchanged messages for coordination, the number of broadcast View Candidate Sensors (VCS) messages, and minimizes the computation load on the sensor nodes. The presented alternate modified distributed approach uses a lower number of messages and can scale well for large dense networks while maintaining a guarantee on the size of the connected sensor cover. Through extensive simulations, we have shown that our designed techniques result in substantial energy savings in a sensor network. Compared with other techniques, the results demonstrated a significant improvement of the proposed techniques in terms of energy-efficient query cover with lower communication cost.
REFERENCES
[1] P. Bonnet, J. Gehrke, and P. Seshadri, “Toward sensor database systems,” in Proc. 2nd Int. Conf. Mobile Data Management, Hong Kong, 2001, pp.3–14.
[2] R. Govindan, J. Hellerstein, W. Hong, S. Madden, M. Franklin, and S.Shenker, “The sensor network as a database,” Comput. Sci. Dept., Univ. Southern California, Los Angeles, Tech. Rep., 2002.
[3] G. Pottie and W. Kaiser, “Wireless integrated sensor networks,” Commun. ACM, vol. 43, no. 5, May 2000. pp. 51–58.
[4] H. Gupta, Z. Zhou, Student Member, IEEE, S. R. Das, Member, IEEE, and Q. Gu," Connected sensor cover: self-organization of sensor networks for efficient query execution," IEEE/ACM transactions on networking, VOL. 14, NO. 1, FEBRUARY 2006, pp.55-67.
[5] S. R. Madden, M. J. Franklin, J. M. Hellerstein, and W. Hong. "The design of an acquisitional query processor for sensor networks," In
2003 ACM SIGMOD international conference on Management of data, San Diego, California June 2003 pp. 491 – 502.
[6] S. Slijepcevic and M. Potkonjak, “Power efficient organization of wireless sensor networks,” in Proc. IEEE Int. Conf. Commun. (ICC), 2001, pp. 472–476.
[7] Z. Abrams, A. Goel, and S. Plotkin, “Set k-cover algorithms for energy efficient monitoring in wireless sensor networks,” in Proc. Int. Workshop on Information Processing in Sensor Networks (IPSN), 2004, pp.424–432.
[8] S. Shakkottai, R. Srikant, and N. Shroff, “Unreliable sensor grids: coverage,connectivity and diameter,” in Proc. IEEE INFOCOM, 2003, pp.1073–1083.
[9] F. Ye, G. Zhong, J. Cheng, S. Lu, and L. Zhang, “PEAS: a robust energy conserving protocol for long-lived sensor networks,” in Proc. Int. Conf.Distributed Computing Systems, 2003, pp. 28–37.
[10] K. Chakrabarty, S. S. Iyengar, H. Qi, and E. Cho, “Grid coverage for surveillance and target location in distributed sensor networks,” IEEE Trans. Comput., vol. 51, no. 12, Dec. 2002. pp. 1448–1453.
[11] C.F. Huang and Y.C. Tseng, “The coverage problem in a wireless sensor network,” in Proc. ACM Int. Conf. Wireless Sensor Networks and Applications (WSNA), 2003, pp. 115–121.
[12] Z. Zhou, S. Das, and H. Gupta, “Connected k-coverage problem in sensor networks,” in Proc. Int. Conf. Computer Communications and Networks (ICCCN), 2004, pp. 373–378.
[13] S. Meguerdichian, F. Koushanfar, M. Potkonjak, and M. Srivastava, “Coverage problems in wireless ad hoc sensor networks,” in Proc. IEEE INFOCOM, 2001, pp. 1380–1387.
[14] Z. Zhou, S. Das, and H. Gupta, “Connected k-coverage problem in sensor networks,” in Proc. Int. Conf. Computer Communications andNetworks (ICCCN), 2004, pp. 373–378.
[15] V. S. Anil Kumar and H. Ramesh, “Covering rectilinear polygons with axis-parallel rectangles,” in Proc. ACM-SIAM Symp. Theory of Computing, 1999, pp. 445–454.
[16] H. Bronnimann and M. Goodrich, “Almost optimal set covers in finite VC-dimension,” Discrete Comput. Geom., 1995, vol. 14, pp. 263–279.
[17] S. Guha and S. Khuller, “Approximation algorithms for connected dominating sets,” Algorithmica, 1998, vol. 20, no. 4, pp. 374–387.
[18] J. Wu and F. Dai, “Broadcasting in ad hoc networks based on self-pruning,” in Proc. IEEE INFOCOM, 2003, pp. 2240–2250.
[19] B. Das, R. Sivakumar, and V. Bhargavan, “Routing in ad hoc networks using a spine,” in Proc. Int. Conf. Computer Communications and Networks (ICCCN), 1997, pp. 34–39.
[20] Y. Chen and A. Liestman, “Approximating minimum size weakly-connected dominating sets for clustering mobile ad hoc networks,” in