RP-HPLC Method Development and Validation for the Simultaneous estimation of Simvastatin and Ezetimibe in Tablet Dosage Form
9
0
0
Full text
(2) 84 Mohammed. Ibrahim et al / Int. J. of Pharmacy and Analytical Research Vol-3(1) 2014 [83-91]. synergistic cholesterol lowering effect when used together with statins that inhibits cholesterol synthesis by liver4. Recently a combination of SIM and EZ has been launched in market. In this combination, EZ shows a synergistic effect with SIM. SIM was determined by several methods including gas chromatography–mass spectrometry (GC–MS)5, liquid chromatography with UV. Figure-1: Molecular structure of Simvastatin. MATERIALS AND METHODS Chemicals/ Reagents and Solvents Simvastatin-10mg (Simcard 10) and Ezetimibe10mg9 (EzedocR)10 were obtained from, Ranbaxy Laboratories Limited, .Himachal Pradesh and Hovero Labs Limited, Himachal Pradesh, respectively. Double Distilled Water (HPLC grade), Methanol (HPLC grade), Acetonitrile (HPLC grade), orthophosphoric acid and Potassium-dihydrogen phosphate were of reagent grade.. Instrumentation and Equipments The HPLC analysis was accomplished on WATERS high pressure liquid chromatography outfitted with 515 reciprocating dual column HPLC pump, a manually operating Rheodyne injector with 20μL sample loop, X-terra C8 4.6mm x 150mm analytical column reversed-phase material. detection (LC–UV)6-8. EZ was determined with or without combination of several drugs by HPLC and spectrophotometrically9, 10. Literature survey revealed that no HPLC method has been reported yet for the analysis of these two drugs in combination without preliminary separation that makes it worthwhile to pursue the present work.. Figure-2: Molecular structure of Ezetimibe of 5μ size and a 2487 model UV-Visible detector. All the parameters of HPLC were controlled by N 2000 chromatographic system software. Other instruments used were TECHCOMP UV-Vis spectrophotometer of model 2310, Shimadzu electronic balance of model XEX-200, ADWA of model AD102U digital pH meter and ENERTECH of model SE60US ultrasonic bath sonicator.3.3. ANALYTICAL METHOD DEVELOPMENT Optimization of UV conditions Initially method development work was started by taking UV-visible spectra from 400-200 nm of simvastatin (10ppm) and Ezetimibe (10ppm) standard solutions. By observing the overlain spectra of standard solutions λmax 221 nm was taken for trials to develop HPLC method. The spectrum was show below. Figure-3. Isobestic point of Simvastatin and ezetimibe.. www.ijpar.com.
(3) 85 Mohammed. Ibrahim et al / Int. J. of Pharmacy and Analytical Research Vol-3(1) 2014 [83-91]. Chromatographic conditions Mobile phase Column Flow rate Detector wavelength Retention time Column temp Injection volume. :. Acetonitril : Ortho phosphoric acid(60:40v/v) : Xterra (C8) (4.6mm x 150mm, 5m) : 1.0ml : 221 nm : Simvastatin-2.190 min Ezetimibe-3.515 min : Ambient. : 20l. Figure-4 Optimized Chromatogram for Simvastatin and Ezetimibe. Procedure for preparation of solution Preparation of buffer. Sample Solution Preparation. Take 1000ml of HPLC grade water. Dissolve 2.72 grams of Potassium di hydrogen phosphate salt and Adjusted the pH to 3.0 with orthophosphoric acid.. Preparation of mobile phase A mixture of above prepared buffer 400 ml (40%), and 600 ml of HPLC grade Acetonitrile (60%) were mixed and degassed in ultrasonic water bath for 5 minutes. The mobile phase was filterred through 0.45 µ filter under vacuum.. Accurately weighed and transferred tablet powder equivalent to 10mg of simvastatin and 10 mg of Ezetimibe into a 100 ml clean dry volumetric flask and added about 70ml of diluent. It was sonicated to dissolve completely and made volume up to the mark with the same diluent. (Stock solution) From the above stock solution, 1ml of the solution was pipetted into a 10 ml volumetric flask and diluted up to the mark with diluent.. Procedure 20 µL of the standard and sample solutions were injected into the chromatographic system and areas for the Simvastatin and Ezetimibe peaks were measured. %Assay was calculated by using the formulae.. Diluent Preparation Use the Mobile phase as Diluent.. ASSAY Preparation of Standard Solution Accurately weighed and transferred 10mg of simvastatin and 10 mg of Ezetimibe working standard into a 100 ml clean dry volumetric flask and added about 70 ml of diluent. It was sonicated to dissolve completely and made volume up to the mark with the same diluent. (Stock solution) From the above stock solution, 1 ml of the solution was pipetted into a 10 ml volumetric flask and diluted up to the mark with diluent.. Calculation Assay % = AT. WS. DT. P. Avg. Wt. --------- x -------- -x ------- x ------- x ------------- X 100 AS. DS. WT. 100. Label Claim. Where: AT = Average area counts of sample preparation. AS = Average area counts of standard preparation.. www.ijpar.com.
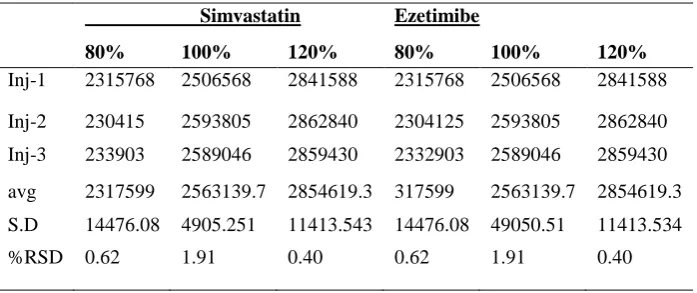
(4) 86 Mohammed. Ibrahim et al / Int. J. of Pharmacy and Analytical Research Vol-3(1) 2014 [83-91]. WS = Weight of working standard taken in mg. P = Percentage purity of working standard LC = LABEL CLAIM mg/ml.. = 10 x ASD/S, Where, ‘ASD’ is the average standard deviation and ‘S’ is the slope of the line.. Robustness ANALYTICAL METHOD VALIDATION The HPLC method was validated in accordance with ICH guidelines.. Accuracy Accuracy was carried out by % recovery studies at three different concentration levels. To the preanalyzed sample solution of Simvastatin and Ezetimibe a known amount of standard drug powder of Simvastatin and Ezetimibe were added at 80%, 100% and 120 % level.. Precision The system precision of the method was verified by five replicate injections of standard solution containing Simvastatin and Ezetimibe. The method precision was carried out the analytic five times using the proposed method. Repeatability was measured by multiple injections of a homogenous sample of Simvastatin and Ezetimibe.. Linearity The linearity was determined separately for Simvastatin and Ezetimibe Linearity of the method was studied by injecting 5 concentrations of both drugs prepared in methanol and calibration curves were constructed by plotting peak area against the respective concentrations.. Robustness was evaluated by making deliberate variations in method parameters such as variation of wave length; flow rate and change in mobile phase composition. The robustness of the method was studied for Simvastatin and Ezetimibe. RESULTS Selection of Chromatographic Conditions and Optimization of Mobile Phase Mobile phase was optimized to separate Simvastatin and Ezetimibe using Symmetry C8 column (150 mm x 4.6 mm i.d., 5μm). Initially, ACN and phosphate buffer and methanol in the Equal proportions were tried as mobile phase but the splitting of the peaks for both these drugs was observed. Therefore, after adjustment of pH of mixed phosphate buffer to 3.0 with orthophosphoric acid, and mobile phase composition (phosphate buffer, ACN in 40:60 % v/v) was tried for resolution of both drugs. Good resolution and symmetric peaks were obtained for both drugs when the pH of the mobile phase (buffer) was adjusted to 3.0. The flow rate of the mobile phase was 1.0 ml/ min-1. Under optimum chromatographic conditions, the retention time for Simvastatin and Ezetimibe was found to be 2.190 and 3.315 min, respectively when the detection was carried out at 221nm. A typical chromatogram of two drugs is shown in (Figure –4).. Limit of detection and Limit of quantitation Sensitivity of the proposed method was estimated in terms of Limit of Detection (LOD) and Limit of Quantitation (LOQ). LOD = 3.3 x ASD/S and LOQ Figure no.1 Accuracy data of Simvastatin and Ezetimibe Simvastatin. Ezetimibe. Inj-1. 80% 2315768. 100% 2506568. 120% 2841588. 80% 2315768. 100% 2506568. 120% 2841588. Inj-2. 230415. 2593805. 2862840. 2304125. 2593805. 2862840. Inj-3. 233903. 2589046. 2859430. 2332903. 2589046. 2859430. avg. 2317599. 2563139.7. 2854619.3. 317599. 2563139.7. 2854619.3. S.D. 14476.08. 4905.251. 11413.543. 14476.08. 49050.51. 11413.534. %RSD. 0.62. 1.91. 0.40. 0.62. 1.91. 0.40. www.ijpar.com.
(5) 87 Mohammed. Ibrahim et al / Int. J. of Pharmacy and Analytical Research Vol-3(1) 2014 [83-91]. Table No.2 Accuracy(Recovery) result for Simvastatin. Spike level. Area. Amount added(Std conc+working conc) (ppm). Amount Found(ppm). Amount recoverd(ppm). % Recoverd. 80%. 2047651. 54. 54.36. 24.36. 101.5. 100%. 2196091. 60. 60.0. 30.02. 100.066. 120%. 2393062. 66. 65.41. 35.41. 98.36. Mean % recoverd. 99.98. Table No.3 Accuracy(Recovery) result for Ezetimibe. Spike level. Area. Amount added(Std conc+working conc) (ppm). Amount Found(ppm). Amount recoverd(ppm). % Recoverd. 80%. 2367599. 54. 54.46. 24.46. 101.92. 100%. 2598473. 60. 60.02. 30.02. 100.066. 120%. 2393062. 66. 65.41. 35.41. 101.66. Mean % recoverd. 101.215. Table No:4 Results of Precision for Simvastatin:. S.No. Injections. 1. Injection-1. Area of Simvastatin 1030445. 2. Injection-2. 1031303. 3. Injection-3. 1021212. 4. Injection-4. 1017377. 5. Injection-5. 1031363. Avarage. 10226340. Standard deviation. 6154.39. %RSD. 0.59. www.ijpar.com.
(6) 88 Mohammed. Ibrahim et al / Int. J. of Pharmacy and Analytical Research Vol-3(1) 2014 [83-91]. Table No:5 Results of Precision for Ezetimibe: S.No. Injections. 1. Injection-1. Area of Ezetimibe 1179915. 2. Injection-2. 1168003. 3 4. Injection-3 Injection-4. 1155515 1173587. 5. Injection-5 Avarage. 1155954 1166594.8. Standard deviation %RSD. 10773.69 0.923. TABLE N:6 Results of Intermediate precision for Simvastatin and Ezetimibe: S.No. Injections. 1 2 3 4 5. Injection-1 Injection-2 Injection-3 Injection-4 Injection-5 Avarage Standard Deviation %RSD. Area of Simvastatin 1086110 1076922 1095482 1089521 1083763 1086359.6 6875.41. Area of Ezetimibe 1240329 1231744 1233601 1239973 1230438 1235217 4643.923. 0.632. 0.375. Table No:7 Area of different concentration of Simvastatin S.No Concentration(µg/ml) Area of Simvastatin 1. 10. 226891. 2. 20. 676546. 3. 30. 1097595. 4. 40. 1460083. 5. 50. 1882919. Fig No:5 Linearity Graph of Simvasatin. Area under curve. Linearity of Simvastatin 2000000 1500000 1000000 500000 0. y = 40956x - 159871 R² = 0.9988. 0. 10. 20. 30. 40. Concentration (mcg/ml). www.ijpar.com. 50. 60.
(7) 89 Mohammed. Ibrahim et al / Int. J. of Pharmacy and Analytical Research Vol-3(1) 2014 [83-91]. TableNo:8 Area of different concentration of Ezetimibe S.No 1 2 3 4. Concentration(µg/ml) 10 20 30 40. Area of Ezetimibe 26795 801471 130410 1798911. 5. 50. 344965. Fig No: 6 Linearity Graph of Ezetimibe. Area under curve. Linearity of Ezetimibe 3000000 y = 51515x - 241970 R² = 0.9997. 2000000 1000000 0 0. 10. 20. 30. 40. 50. 60. Concentration(mcg/ml Table no :9 Results of LOD and LOQ. S.No. Drug name. Standard deviation. Slope. LOD. LOQ. 1. Simvastatin. 25865.34. 40956. 2.0. 6.31. 2. Ezetimibe. 15434.88. 51515. 0.988. 2.99. Table No :10 Robustness Result For Rosuvastatin And Ezetimibe At Different Condition Sno Simvastatin Ezetimibe 1. Standard. RT 2.12. Area 10121207. RT 3.512. Area 1178228. 2. Less low. 2.37. 1230806. 3.81. 1399394. 3 4 5. More flow Less org More org. 2.23 2.34 2.29. 96687 1232634 100057. 3.248 3.74 3.512. 1093351 1398037 1178228. SIM and EZE were found to be 0.59% and 0.923% respectively Table -4&5. RESULTS AND DISCUSSION Accuracy The accuracy of the method studied at three different concentration levels i.e. 80%, 100 % and 120 % showed acceptable % recoveries in the range of 99.98% for Simvastatin and 101.21% for Ezetimibe. The results are shown in Table 1,2 &3. Precision The precision study was evaluated on the basis of % RSD value was found to be The RSD values for. Linearity The linearity was determined separately for Simvastatin and Ezetimibe. Linearity of the method was studied by injecting 5 concentrations of both drugs prepared in mobile phase and calibration curves were constructed by plotting peak area against the respective concentrations. The Simvastatin and Ezetimibe followed linearity in the concentration range of 10-50 μg ml-1 and 10-50 μg. www.ijpar.com.
(8) 90 Mohammed. Ibrahim et al / Int. J. of Pharmacy and Analytical Research Vol-3(1) 2014 [83-91]. ml-1; respectively. The results are shown in Table 7&8.and Fig no 5 & 6. Analysis of marketed tablet formulation. The LOD for Simvastatin and Ezetimibe was found to be 2.0 and 0.98 μg/ml, respectively. The LOQ for Simvastatin and Ezetimibe was found to be 6.31and 2.99 μg/ml respectively. The low values of LOD and LOQ indicates high sensitivity of the method. The results are shown in Table 9.. 3 replicates of the samples solutions (20 μL) were injected for quantitative analysis. The amounts of Simvastatin and Ezetimibe estimated were found to 100.19 % and 98.55%, respectively. A good separation and resolution of both drugs indicates that there was no interference from the excipients commonly present in pharmaceutical formulations. The results are shown in Table 11.. Robustness study. System Suitability Test. Robustness of the method was studied by making deliberate changes in the chromatographic conditions and the effects on the results were examined. The low value changes of theoretical plates, tailing factor indicating robustness of the method. The results are shown in Table 10.. The system suitability parameters such as resolution, number of theoretical plates and tailing factor were studied and were summarized in Table 12.. Limit of detection and Limit of quantitation. Table No:11 ASSAY RESULTS Assay Results Drug Simvastatin. Amount present/tablet 10mg. % of Assay 100.19. Ezetimibe. 10mg. 98.55. Table no: 12 System Suitability Results for Simvastatin And Ezetimibe. S.No. Drug. Tailing factor. Theoritical plate for Column. Resolution. 1.. Simastatin. 1.152. 4.20. -. 2.. Ezetimibe. 1.034. 7857. 7.794. CONCLUSIONS The proposed RP-HPLC method allows for accurate, precise and reliable measurement of SIM and EZ simultaneously in combined dosage form. The developed RP-HPLC method was found to be simple, rapid, selective, accurate and precise for the concurrent estimation of drugs in respective two-. component tablet dosage form of SIM and EZ. The RSD for all parameters was found to be less than one, which indicates the validity of method and assay results obtained by this method are in fair agreement. The developed method can be used for routine quantitative simultaneous estimation of SIM and EZ in multicomponent pharmaceutical preparation.. REFERENCES [1] Budawari S. editor, In; The Merck index. 13th ed. Whitehouse Station, (NJ): Merck &Co., Inc., 2001; 868. [2] Ochiai H. et al. Determination of Simvastatin and Its Active Metabolites in Human Plasma by ColumnSwitching High Performance Liquid Chromatography with Fluorescence Detection after Derivatization with Bromoacetylpyrene. J Chromatogr B Biomed Sci. 1997: 694:211-217.. www.ijpar.com.
(9) 91 Mohammed. Ibrahim et al / Int. J. of Pharmacy and Analytical Research Vol-3(1) 2014 [83-91]. [3] Budawari S. editor, In; The Merck index. 13th ed. Whitehouse Station, (NJ): Merck &Co., Inc., 2001; 148. [4] Darkes MJ, Poole RM, Goa KL, Ezetimibe, Am J. Cardio Vasc. Drugs. 2003: 3: 67-76. [5] Morris MJ. et al. Determination of the HMG-CoA Reductase Inhibitors Simvastatin, Lovastatin, and Pravastatin in Plasma by Gas Chromatography/Chemical Ionization Mass Spectrometry. Biol Mass Spectrom. 1993:22:1-8. [6] Tan L, Yang LL, Zhang X, Yuan YS and Ling SS. Determination of Simvastatin in Human Plasma by High Performance Liquid Chromatography. Se Pu. 2000:18:232- 234. [7] Curlucci G, Mazzeo P, Biordi L, and Bologna M. Simultaneous Determination of Simvastatin and its Hydroxy Acid Form in Human Plasma by High Performance Liquid Chromatography with UV Detection. J Pharm Biomed Anal. 1992: 10:693-7. [8] Wang L and Asgharnejad M. Second- Derivative UV Spectrometric Determination of Simvastatin in Tablet Dosage Form. J Pharm Biomed Anal. 2000:21:1243-1248. [9] Chaudhari BG. et al. Stability-Indicating Reversed-Phase Liquid Chromatographic Method for Simultaneous Determination of Atorvastatin and Ezetimibe from Their Combination Drug Products. J. AOAC Int. 2007: 90:1539 46. [10] Imran M, Singh RS and Chandran S. Stability Indicating Ultraviolet Spectroscopic Method for the Estimation of Ezetimibe and Carvedilol. Pharmazie 2006: 61:766-9. *******************************. www.ijpar.com.
(10)
Figure


Related documents
Conclusions: The findings from this study indicate the importance of “ pushing ” active classroom teachers from the design to the mapping arena by instituting curriculum
In fact, all five strains genotyped as SIT149:A were drug resistant according to the line probe assay (Additional file 1 : Table S1), and four of these five strains were
Methods: We identified all Dutch families in which two or three siblings were diagnosed with Pompe disease and described genotype, acid α -glucosidase activity, age at symptom
To better solve the problems discussed above, in this paper, we construct a KP-ABS-UT (key-policy attribute based signature with untrusted authority and traceabil- ity) scheme,
supported, the B value of for previous experience of entrepreneur factor = .716> 0.01, which indicated that there is a positive and significant impact of previous
Good dreams, unlike bad dreams, have different effects on both the dreamer and the hearers.. For one, the dreamer will naturally be
are usually performed on blood or on secretions from infected areas.2 The present case report docu- ments the survival of an infant with respiratory distress in whom early diagnosis
In the swing-up and handstand control of a cart-double pendulum, the HSIC controller with fuzzy online self-tuning parameters has continuous changing parameters, and
