R E S E A R C H A R T I C L E
Open Access
Intracluster correlation coefficients for the
Brazilian Multicenter Study on Preterm Birth
(EMIP): methodological and practical implications
Giuliane J Lajos
1*, Samira M Haddad
1, Ricardo P Tedesco
1, Renato Passini Jr
1, Tabata Z Dias
1, Marcelo L Nomura
1,
Patrícia M Rheder
1, Maria H Sousa
2, and Jose G Cecatti
1,2for the Brazilian Multicenter Study on Preterm Birth
study group
Abstract
Background:Cluster-based studies in health research are increasing. An important characteristic of such studies is the presence of intracluster correlation, typically quantified by the intracluster correlation coefficient (ICC), that indicate the proportion of data variability that is explained by the way of clustering. The purpose of this manuscript was to evaluate ICC of variables studied in the Brazilian Multicenter Study on Preterm Birth.
Methods:This was a multicenter cross-sectional study on preterm births involving 20 referral hospitals in different regions of Brazil plus a nested case–control study to assess associated factors with spontaneous preterm births. Estimated prevalence rates or means, ICC with 95% confidence intervals, design effects and mean cluster sizes were presented for more than 250 maternal and newborn variables.
Results:Overall, 5296 cases were included in the study (4,150 preterm births and 1,146 term births). ICC ranged from <0.001 to 0.965, with a median of 0.028. For descriptive characteristics (socio-demographic, obstetric history and perinatal outcomes) the median ICC was 0.014, for newborn outcomes the median ICC was 0.041 and for process variables (clinical management and delivery), it was 0.102. ICC was <0.1 in 78.4% of the variables and <0.3 for approximately 95% of them. Most of ICC >0.3 was found in some clinical management aspects well defined in literature such as use of corticosteroids, indicating there was homogeneity in clusters for these variables.
Conclusions:Clusters selected for Brazilian Multicenter Study on Preterm Birth had mainly heterogeneous findings and these results can help researchers estimate the required sample size for future studies on maternal and perinatal health.
Keywords:Intracluster correlation coefficient, Preterm birth, Spontaneous preterm labor, Premature rupture of membranes, Indicated preterm delivery, Neonatal morbidity
Background
Cluster-based studies involving aggregated units such as hospitals, health centers, schools or medical practices are increasingly being used in healthcare evaluation, es-pecially in cluster randomized trials, which are perhaps the most high impact form of public health research/ evaluation study design that can benefit from good ex-tent estimates of ICC. In such situations, population
groups (specific geographical areas), healthcare units (hospitals) or healthcare sectors are considered primary sampling units and generally all subjects belonging to each group are included to obtain data of interest [1,2].
However, depending on the method of selection, data obtained from clusters may not be sufficiently represen-tative to allow for generalization. Population observed in clusters can present a large degree of similarity in some characteristics (homogeneity), unlike when there is a simple random sampling (SRS), in which each individual has the same probability of being selected in the general population, with more heterogeneity [2].
* Correspondence:[email protected] 1
Department of Obstetrics and Gynecology, School of Medical Sciences, University of Campinas, Campinas, Brazil
Full list of author information is available at the end of the article
Therefore, an important characteristic of cluster-based studies is to evaluate the proportion of data variability that is explained by means of clustering, and this reliability may be analyzed by measuring inter and intracluster variance [3].
Intracluster correlation coefficient (ICC), denoted by ρ, is defined as the ratio of the between-cluster variance to the total variance (both between and within clusters), and therefore has a value between 0 and 1 [4,5]. Its value depends on the type of variable, cluster size and the prevalence of the condition [6]. Coefficients close to zero indicate that individuals within clusters are no more similar to each other than individuals from different clusters (the variable is randomly distributed among clusters); otherwise the values close to 1 reflect the homogeneity in a sample [7]. In other words, for cluster based population studies this heterogeneity (ICC close to zero) is desired as a proxy to the subjects being ran-domly selected.
The increase in variance due to clustering, compared to what would be obtained if sampling had been carried out by the SRS method, is calculated by design effect (Deff ) [8]. It is given by 1 + (m-1) ICC, where m is the average cluster size [9]. Deff value is directly propor-tional to ICC and to the size of a cluster [10].
The ICC estimate in cluster studies is very useful for the development of new studies in the same field, because values obtained could be used as a correction factor for the calculation of sample size needed, thus avoiding underestimates, since in studies in which SRS is used, the sample size required to achieve sufficient sta-tistical power is usually smaller [4].
The purpose of this manuscript is to evaluate the ICC of variables studied in the Brazilian Multicenter Study on Preterm Birth, a multicenter cross-sectional study on preterm births involving 20 referral hospitals in different regions of Brazil plus a nested case–control study. Estimated prevalence rates or means, ICC with 95%
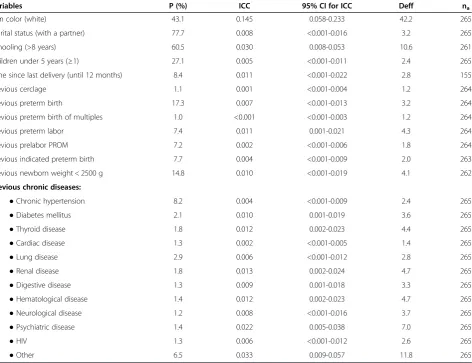
Table 1 Estimates of prevalence (P), intracluster correlation coefficients (ICC), their respective 95% CI, design effect (Deff), and mean cluster size (na) for categorical maternal characteristics
Variables P (%) ICC 95% CI for ICC Deff na
Skin color (white) 43.1 0.145 0.058-0.233 42.2 265
Marital status (with a partner) 77.7 0.008 <0.001-0.016 3.2 265
Schooling (>8 years) 60.5 0.030 0.008-0.053 10.6 261
Children under 5 years (≥1) 27.1 0.005 <0.001-0.011 2.4 265
Time since last delivery (until 12 months) 8.4 0.011 <0.001-0.022 2.8 155
Previous cerclage 1.1 0.001 <0.001-0.004 1.2 264
Previous preterm birth 17.3 0.007 <0.001-0.013 3.2 264
Previous preterm birth of multiples 1.0 <0.001 <0.001-0.003 1.2 264
Previous preterm labor 7.4 0.011 0.001-0.021 4.3 264
Previous prelabor PROM 7.2 0.002 <0.001-0.006 1.8 264
Previous indicated preterm birth 7.7 0.004 <0.001-0.009 2.0 263
Previous newborn weight < 2500 g 14.8 0.010 <0.001-0.019 4.1 262
Previous chronic diseases:
●Chronic hypertension 8.2 0.004 <0.001-0.009 2.4 265
●Diabetes mellitus 2.1 0.010 0.001-0.019 3.6 265
●Thyroid disease 1.8 0.012 0.002-0.023 4.4 265
●Cardiac disease 1.3 0.002 <0.001-0.005 1.4 265
●Lung disease 2.9 0.006 <0.001-0.012 2.8 265
●Renal disease 1.8 0.013 0.002-0.024 4.7 265
●Digestive disease 1.3 0.009 0.001-0.018 3.3 265
●Hematological disease 1.4 0.012 0.002-0.023 4.7 265
●Neurological disease 1.2 0.008 <0.001-0.016 3.7 265
●Psychiatric disease 1.4 0.022 0.005-0.038 7.0 265
●HIV 1.3 0.006 <0.001-0.012 2.6 265
confidence intervals, design effects and average cluster sizes were also objectives for this study and they are presented for more than 250 maternal and neonatal variables.
Methods
The Brazilian Multicenter Study on Preterm Birth con-sisted of a multicenter cross-sectional study plus a nested case–control study to assess their associated fac-tors implemented in referral obstetrical units (clusters) from several states of the country. The full research pro-posal has already been published elsewhere [11].
A single-stage cluster sampling was used. Clusters were selected by an invitation to 27 healthcare insti-tutions that build a national network called Brazilian
Network for Studies on Reproductive and Perinatal Health. They are located in the five geographical regions of the country, almost all of them are public institutions, and all of them receive both low and high risk pregnant women. Initially 26 centers accepted to participate, but 20 selected institutions were able to fully take part in the study.
The sample size was calculated using the official preva-lence of preterm births in Brazil of around 6.5% [12]. Con-sidering an acceptable absolute difference of about 0.25% between the sample and the population prevalence, and a type I error of 5%, initial surveillance of a sample size of 37,000 deliveries was necessary. For the case–control study component, the estimated sample size was 1,055 women in each group (cases and controls). The total
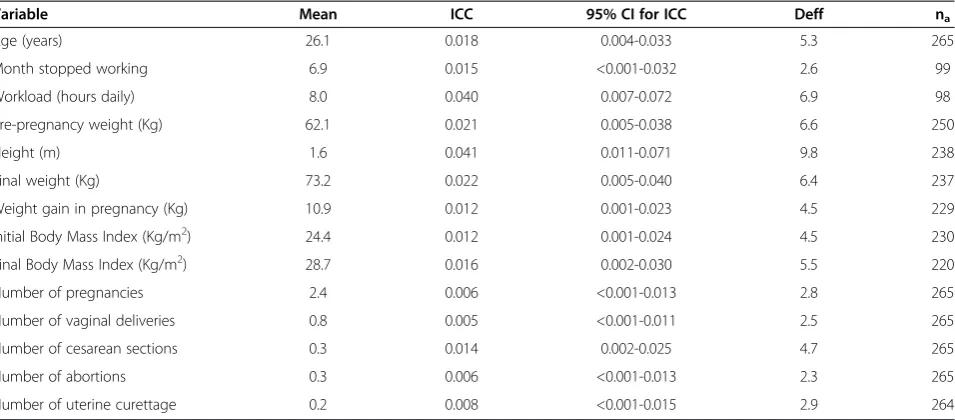
Table 2 Estimates of mean, intracluster correlation coefficients (ICC), their respective 95% CI, design effect (Deff), and mean cluster size (na) for numeric maternal characteristics
Variable Mean ICC 95% CI for ICC Deff na
Age (years) 26.1 0.018 0.004-0.033 5.3 265
Month stopped working 6.9 0.015 <0.001-0.032 2.6 99
Workload (hours daily) 8.0 0.040 0.007-0.072 6.9 98
Pre-pregnancy weight (Kg) 62.1 0.021 0.005-0.038 6.6 250
Height (m) 1.6 0.041 0.011-0.071 9.8 238
Final weight (Kg) 73.2 0.022 0.005-0.040 6.4 237
Weight gain in pregnancy (Kg) 10.9 0.012 0.001-0.023 4.5 229
Initial Body Mass Index (Kg/m2) 24.4 0.012 0.001-0.024 4.5 230
Final Body Mass Index (Kg/m2) 28.7 0.016 0.002-0.030 5.5 220
Number of pregnancies 2.4 0.006 <0.001-0.013 2.8 265
Number of vaginal deliveries 0.8 0.005 <0.001-0.011 2.5 265
Number of cesarean sections 0.3 0.014 0.002-0.025 4.7 265
Number of abortions 0.3 0.006 <0.001-0.013 2.3 265
Number of uterine curettage 0.2 0.008 <0.001-0.015 2.9 264
Table 3 Estimates of prevalence (P), intracluster correlation coefficients (ICC), their respective 95% CI, design effect (Deff), and mean cluster size (na) for maternal socio-demographic characteristics
Variable P (%) ICC 95% CI for ICC Deff na
Household (rural) 9.8 0.097 0.034-0.159 32.9 264
Homeownership 57.5 0.041 0.012-0.070 15.2 265
Paved street 78.7 0.181 0.077-0.286 60.0 262
Piped water 94.2 0.090 0.031-0.149 30.0 263
Sewer 86.8 0.191 0.083-0.300 53.8 261
Family income (>US$ 400.00) 38.8 0.103 0.037-0.168 28.8 244
Paid work 42.6 0.036 0.010-0.063 10.8 263
Paid work in pregnancy 88.8 0.041 0.008-0.073 7.4 112
Strenuous work 43.4 0.037 0.006-0.068 5.5 99
Standing work 61.4 0.017 <0.001-0.034 2.8 99
Night work 19.5 0.033 0.004-0.061 4.3 98
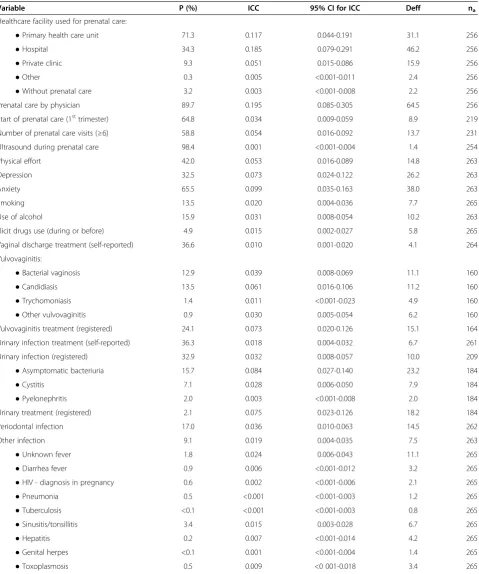
Table 4 Estimates of prevalence (P), intracluster correlation coefficients (ICC), their respective 95% CI, design effect (Deff), and mean cluster size (na) for categorical variables of process during pregnancy
Variable P (%) ICC 95% CI for ICC Deff na
Healthcare facility used for prenatal care:
●Primary health care unit 71.3 0.117 0.044-0.191 31.1 256
●Hospital 34.3 0.185 0.079-0.291 46.2 256
●Private clinic 9.3 0.051 0.015-0.086 15.9 256
●Other 0.3 0.005 <0.001-0.011 2.4 256
●Without prenatal care 3.2 0.003 <0.001-0.008 2.2 256
Prenatal care by physician 89.7 0.195 0.085-0.305 64.5 256
Start of prenatal care (1sttrimester) 64.8 0.034 0.009-0.059 8.9 219
Number of prenatal care visits (≥6) 58.8 0.054 0.016-0.092 13.7 231
Ultrasound during prenatal care 98.4 0.001 <0.001-0.004 1.4 254
Physical effort 42.0 0.053 0.016-0.089 14.8 263
Depression 32.5 0.073 0.024-0.122 26.2 263
Anxiety 65.5 0.099 0.035-0.163 38.0 263
Smoking 13.5 0.020 0.004-0.036 7.7 265
Use of alcohol 15.9 0.031 0.008-0.054 10.2 263
Illicit drugs use (during or before) 4.9 0.015 0.002-0.027 5.8 265
Vaginal discharge treatment (self-reported) 36.6 0.010 0.001-0.020 4.1 264
Vulvovaginitis:
●Bacterial vaginosis 12.9 0.039 0.008-0.069 11.1 160
●Candidiasis 13.5 0.061 0.016-0.106 11.2 160
●Trychomoniasis 1.4 0.011 <0.001-0.023 4.9 160
●Other vulvovaginitis 0.9 0.030 0.005-0.054 6.2 160
Vulvovaginitis treatment (registered) 24.1 0.073 0.020-0.126 15.1 164
Urinary infection treatment (self-reported) 36.3 0.018 0.004-0.032 6.7 261
Urinary infection (registered) 32.9 0.032 0.008-0.057 10.0 209
●Asymptomatic bacteriuria 15.7 0.084 0.027-0.140 23.2 184
●Cystitis 7.1 0.028 0.006-0.050 7.9 184
●Pyelonephritis 2.0 0.003 <0.001-0.008 2.0 184
Urinary treatment (registered) 2.1 0.075 0.023-0.126 18.2 184
Periodontal infection 17.0 0.036 0.010-0.063 14.5 262
Other infection 9.1 0.019 0.004-0.035 7.5 263
●Unknown fever 1.8 0.024 0.006-0.043 11.1 265
●Diarrhea fever 0.9 0.006 <0.001-0.012 3.2 265
●HIV - diagnosis in pregnancy 0.6 0.002 <0.001-0.006 2.1 265
●Pneumonia 0.5 <0.001 <0.001-0.003 1.2 265
●Tuberculosis <0.1 <0.001 <0.001-0.003 0.8 265
●Sinusitis/tonsillitis 3.4 0.015 0.003-0.028 6.7 265
●Hepatitis 0.2 0.007 <0.001-0.014 4.2 265
●Genital herpes <0.1 0.001 <0.001-0.004 1.4 265
number of preterm births estimated to be followed in both components of the study was around 3,600.
The participating centers performed a prospective sur-veillance of all patients admitted to give birth in order to identify preterm births. For this purpose and according to standard international definitions, preterm birth was considered that occurring before 37 completed weeks of gestational age evaluated by an ultrasound scan per-formed early in pregnancy, by a known date of the last menstrual period, or alternatively by the evaluation of the somatic age of the newborn. During the first months of the study, in order to complete the sample for the appropriate analysis of the factors associated with spon-taneous preterm birth, a random sample of women who had full-term birth was also selected.
Data was collected during six to twelve months for each center, from April 2011 to March 2012, in a de-tailed form called “Questionnaire” including 306 vari-ables from four sources: interview with women in the postpartum period, medical records and prenatal chart of the mother (before hospital discharge), and newborn medical records (within sixty days after birth, even if it remained in hospital for longer period). An electronic system of data entry called OpenClinica® was selected and a proper clinical research form (CRF) was designed for the input of data after the questionnaire of each case was completed and reviewed.
High quality data and reliable information was guaran-teed by several steps: preparatory meetings, development of detailed manuals of operation, monitoring technical site visits to the centers, close monitoring of data collec-tion and data entry, concurrent query management, checking for logical inconsistencies, and correction of database. The research proposal was firstly approved by the Institutional Review Board of the coordinating cen-ter and then confirmed by IRB of each other partici-pating center.
Data analysis
In this study, each of the 20 participating centers (hospital) was considered a primary sampling unit (PSU) and there was no stratification of the PSU or weighting of the data.
The subject (unit of analysis) was woman who delivered preterm (case) or at term (control).
Estimated prevalence (categorical variables) or means (continuous numeric variables), intracluster correlation coefficients (ICC), their respective 95% confidence inter-vals (CI), design effects (Deff ) and mean cluster size of each variable were calculated. Software programs used for analysis were SPSS® version 20.0 [13] and Stata ver-sion 7.0 [14], taking into consideration the cluster sam-pling plan (centers) for data analysis.
According to Kish [2], ICC (Roh) is:ρ= (s2
a−s2b/b)/sˆ2, where s2ais the variance between clusters;s2bis the vari-ance within clusters, b is the size of clusters andsˆ2is the estimate of S2(variance in individual level). The estimate sˆ2
is obtained by:sˆ2=s2a+ [(b−1)/b]s2b. Stata’s equivalent computing formula for ICC [14] is: ICC = [(F−1)a/n]/1 + (F−1)a/n, where ‘F’ is the Snedecor’s F-value from the ANOVA table and ‘a’ is the number of groups. The vari-ance estimate for ICC is obtained by an extensive asymp-totic formula and because this it was not showed.
For this study, the Design effect - DEFF [2] is Deff= varactual(r)/varSRS(r) =s2a/a/s2/n) where varactual(r) is the estimated variance according to the complex design being studied and varSRS(r) is the variance in the estima-tor considering the design as if it were calculated using a SRS of the same size,n.
Results
During fifteen months, 5,296 births were included in the study, 4,150 of them being preterm births (1,491 due to spontaneous preterm labor, 1,191 due to a prelabor pre-mature rupture of membranes and 1,468 due to a thera-peutic interruption of pregnancy either for a maternal or fetal condition) and a sample of 1,146 term births to be used as controls for the case–control component.
Clustering was not stratified by region. Proportionally more centers were located in the Southeast of the coun-try and consequently over half of births were from this region (11/20 – 53.5%). The other centers were from Northeast region (7/20 –35%), contributing with 34.8% of births studied, South region (2/20–10%), with 11.7% of births. The mean size of each cluster was 265 cases.
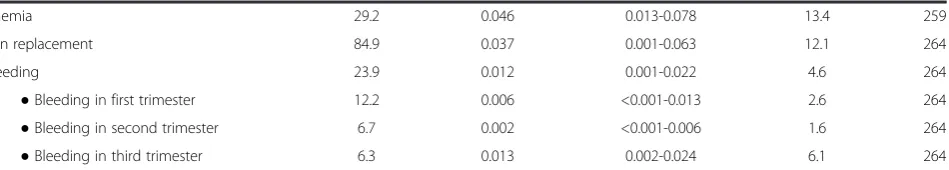
Table 4 Estimates of prevalence (P), intracluster correlation coefficients (ICC), their respective 95% CI, design effect (Deff), and mean cluster size (na) for categorical variables of process during pregnancy(Continued)
Anemia 29.2 0.046 0.013-0.078 13.4 259
Iron replacement 84.9 0.037 0.001-0.063 12.1 264
Bleeding 23.9 0.012 0.001-0.022 4.6 264
●Bleeding in first trimester 12.2 0.006 <0.001-0.013 2.6 264
●Bleeding in second trimester 6.7 0.002 <0.001-0.006 1.6 264
Table 5 Estimates of prevalence (P), intracluster correlation coefficients (ICC), their respective 95% CI, design effect (Deff), and mean cluster size (na) for categorical variables of process during pregnancy
Variable P(%) ICC 95% CI for ICC Deff na
Hospitalization 22.3 0.030 0.008-0.052 10.0 265
Reasons for hospitalization:
●Emesis 0.6 0.006 0.001-0.013 2.3 264
●Uterine contraction 5.7 0.014 0.002-0.026 5.3 264
●Amniorrhexis 2.2 0.009 0.001-0.017 4.0 264
●Bleeding 2.6 0.008 <0.001-0.016 3.0 264
●Maternal disease 8.9 0.029 0.007-0.050 10.1 264
●Fetal disease 0.8 0.028 0.007-0.049 6.0 264
Syphilis 1.6 0.004 <0.001-0.009 1.7 265
Anemia (registered) 32.0 0.070 0.023-0.118 24.1 238
Treatment for anemia 52.6 0.283 0.138-0.428 74.8 213
Short cervix (US) 1.4 0.011 <0.001-0.022 4.0 209
Cervical insufficiency 2.1 0.005 <0.001-0.012 2.6 230
Cerclage 1.4 0.019 0.003-0.034 5.6 238
Uterine anomalies 0.6 <0.001 <0.001-0.003 0.6 237
Fibroid 1.9 0.002 <0.001-0.006 1.5 233
Maternal diseases:
●Diabetes 5.7 0.027 0.006-0.047 7.8 254
●Gestational hypertension 7.7 0.025 0.006-0.045 9.4 254
●Preeclampsia/eclampsia/HELLP 16.2 0.062 0.019-0.104 22.5 254
●Chronic hypertension 5.7 0.007 <0.001-0.014 2.8 254
●Other chronic infection 0.7 0.010 0.001-0.020 4.5 254
●Thyroid diseases 1.6 0.027 0.006-0.047 8.2 254
●Renal disease 1.2 0.008 <0.001-0.015 3.1 254
●Sickle cell anemia 0.3 0.002 <0.001-0.006 1.5 254
●Other chronic anemia 0.5 <0.001 <0.001-0.003 0.7 254
●Cardiac disease 1.1 0.003 <0.001-0.008 1.9 254
●Lung disease 1.5 0.009 <0.001-0.017 3.8 254
●Epilepsy 0.6 0.001 <0.001-0.004 1.5 254
●Systemic lupus erythematous 0.5 0.020 0.004-0.036 4.6 254
●Other collagenoses 0.2 0.001 <0.001-0.004 1.4 254
●Digestive disease 0.6 0.006 <0.001-0.013 3.1 254
●Bariatric surgery <0.1 <0.001 <0.001-0.003 0.8 254
●Psychiatric disease 1.0 0.015 0.003-0.028 5.4 254
●Orthopedic disease 0.2 <0.001 <0.001-0.003 0.9 254
●Neoplasms 0.2 0.001 <0.001-0.004 1.4 254
●Thrombosis or thrombophilia 0.4 0.006 <0.001-0.013 2.4 254
Fetal malformation 5.5 0.146 0.057-0.236 35.9 246
Fetal growth restriction 9.3 0.019 0.004-0.035 6.9 246
Other fetal morbidity 7.4 0.386 0.219-0.554 101.5 246
Triplets 2.0 <0.001 <0.001-0.030 1.0 22
Table 5 Estimates of prevalence (P), intracluster correlation coefficients (ICC), their respective 95% CI, design effect (Deff), and mean cluster size (na) for categorical variables of process during pregnancy(Continued)
Multiple monochorionic pregnancy 35.8 0.046 <0.001-0.111 2.0 18
Multiple monoamniotic pregnancy 5.8 0.038 <0.001-0.098 1.9 18
Twin-to-twin transfusion syndrome 5.4 <0.001 <0.001-0.036 0.9 18
Table 6 Estimates of prevalence (P), intracluster correlation coefficients (ICC), their respective 95% CI, design effect (Deff), and mean cluster size (na) for categorical variables of process during labor
Variable P(%) ICC 95% CI for ICC Deff na
Mode of onset of labor (spontaneous) 55.3 0.018 0.004-0.032 6.5 265
Intrapartum antibiotic (ATB) 51.8 0.194 0.084-0.304 71.8 260
●ATB for fever 0.5 0.003 <0.001-0.008 1.8 252
●ATB for GBS colonization 1.9 0.019 0.004-0.034 5.6 252
●ATB for risk factor to GBS 20.0 0.148 0.058-0.238 48.2 252
●ATB for other reasons 29.1 0.384 0.217-0.550 148.0 252
Analgesics during labor:
●Epidural 4.2 0.200 0.087-0.313 43.3 259
●Epidural plus spinal anesthesia 3.7 0.201 0.088-0.314 74.3 259
●Spinal anesthesia 20.1 0.338 0.181-0.495 112.8 259
●Meperidine 0.8 0.018 0.004-0.033 6.6 259
●Tramadol 0.2 0.002 <0.001-0.006 1.4 259
●Benzodiazepines 0.1 0.008 <0.001-0.017 3.6 259
●Antispasmodics 2.2 0.071 0.023-0.119 21.2 259
●Oral analgesics 2.0 0.091 0.031-0.150 23.0 259
●Other analgesics 2.4 0.102 0.036-0.168 46.6 259
Mode of delivery (vaginal) 48.8 0.024 0.006-0.043 7.7 265
Episiotomy 38.7 0.176 0.068-0.283 31.5 126
Forceps 3.9 0.056 0.014-0.099 12.9 116
Cesarean indication:
●Fetal distress 25.7 0.016 0.001-0.031 3.8 133
●Cephalic-pelvic disproportion 2.8 0.016 0.001-0.032 3.2 133
●Two or more cesarean scars 9.8 0.006 <0.001-0.014 2.0 133
●Pelvic or other abnormal fetal presentation 15.6 0.012 <0.001-0.025 2.9 133
●Functional dystocia 2.2 0.022 0.003-0.041 3.8 133
●Diabetes 1.8 0.013 <0.001-0.027 3.3 133
●Arterial hypertension 22.7 0.043 0.011-0.075 7.4 133
●Cardiac disease 0.6 0.009 <0.001-0.020 1.6 133
●HIV 1.6 0.005 <0.001-0.012 1.7 133
●Placenta previa 2.0 0.006 <0.001-0.014 1.6 133
●Abruptio placentae 4.8 0.005 <0.001-0.013 1.9 133
●Uterine rupture 0.1 0.006 <0.001-0.015 1.1 133
●Fetal malformation 3.2 0.133 0.051-0.215 18.9 133
●Fetal macrosomia 1.7 0.002 <0.001-0.008 1.4 133
●Maternal choice 1.0 0.037 0.008-0.065 7.2 133
●Other 17.1 0.082 0.027-0.137 14.9 133
Estimated ICCs
Estimated ICCs are presented in Tables 1, 2, 3, 4, 5, 6, 7, 8, 9 and 10 for each of 261 variables. Tables 2 and 8 show re-sults for continuous numeric variables, while other tables present results for categorical variables or were catego-rized for analysis. In addition to ICC, the 95% confidence interval (CI), the design effect (Deff ) and the mean cluster size (na), as well as the estimated prevalence (or mean) are presented. ICC ranged from <0.001 to 0.965, with a median of 0.028. ICC was < 0.1 in 78.5% of the variables and < 0.3 for 95% of them.
Tables 1 and 2 presents some variables related to mater-nal characteristics, including clinical and obstetrical his-tory. ICCs ranged from <0.001 to 0.145 (median 0.011). Table 3 shows the socio-demographic variables studied, and ICC ranged from 0.017 to 0.191 (median 0.041). Tables 4 and 5 presents variables related to pregnancy
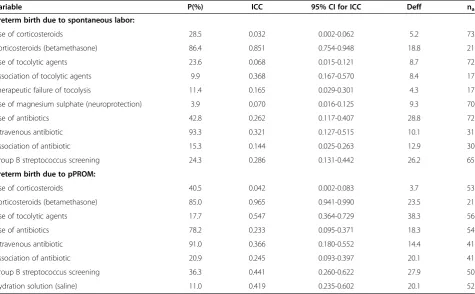
characteristics with ICC ranging from 0.001 to 0.386 (median 0.015). The variables related to labor condi-tions were presented in Table 6. It can be observed that ICC ranged from 0.002 to 0.384, with a median of 0.022. Tables 7 and 8 shows variables related to perinatal out-comes and ICC were < 0.1 in 81% of them. The most important outcome variable, newborn morbidities, is presented in Table 7. Tables 9 and 10 present some vari-ables analyzed specifically for preterm births and are re-lated to management. Most variables in Table 9 showed ICC greater than 0.3 and the greatest ICC of this study (0.965) was relative to the variable“corticosteroids use”, a management aspect well defined and well-established in all obstetric protocols, so there were high degree of homogeneity in clusters in these variables. The median of ICCs was 0.274. The median ICC in Table 10 was 0.079.
Table 7 Estimates of prevalence (P), intracluster correlation coefficients (ICC), their respective 95% CI, design effect (Deff), and mean cluster size (na) for categorical newborn outcome variables
Variable P(%) ICC 95% CI for ICC Deff na
Diagnosis of gestational age (US) 45.4 0.264 0.128-0.399 84.8 265
Stillborn 3.1 0.026 0.006-0.046 7.5 265
Intubation at delivery 13.4 0.013 0.002-0.024 4.1 248
Use of surfactant 12.6 0.015 0.002-0.027 4.4 245
Fetal malformation 9.5 0.078 0.026-0.130 19.6 246
Ventilatory support 42.6 0.041 0.011-0.070 15.1 249
Neonatal morbidity 60.3 0.126 0.047-0.205 33.4 248
●Sepsis 27.7 0.051 0.011-0.091 8.3 144
●Respiratory distress 73.4 0.061 0.014-0.107 9.9 148
●Pneumothorax 3.6 0.041 0.007-0.075 8.2 141
●Cerebral hemorrhage (1–4) 8.7 0.052 0.007-0.097 5.8 114
●Lung hemorrhage 3.7 0.028 0.004-0.053 5.7 143
●Hematologic dysfunction 51.0 0.267 0.116-0.417 71.7 146
●Endocrine dysfunction 22.0 0.119 0.036-0.201 30.3 145
●Renal dysfunction 6.4 0.013 <0.001-0.027 3.5 145
●Immune dysfunction 6.5 0.092 0.025-0.158 22.1 145
●Musculoskeletal morbidity 8.6 0.190 0.071-0.310 38.4 146
●Gastrointestinal dysfunction 43.2 0.340 0.168-0.512 70.6 146
●Hypovolemia 10.4 0.026 0.003-0.049 6.0 146
●Necrotizing enterocolitis 2.4 0.020 0.001-0.038 3.2 145
●Convulsion/anticonvulsants 4.8 0.039 0.007-0.071 6.7 146
●Vasoactive amines 12.2 0.019 0.001-0.037 3.5 146
●Pneumonia 5.6 0.118 0.036-0.200 15.6 145
●Oxygen therapy with 28 days 8.0 0.021 0.002-0.041 3.8 145
●Oxygen therapy with 56 days 2.9 0.012 <0.001-0.025 2.8 143
●Degree of retinopathy (1–3) 4.8 0.028 <0.001-0.056 4.2 99
Table 8 Estimates of mean, intracluster correlation coefficients (ICC), their respective 95% CI, design effect (Deff), and mean cluster size (na) for numeric newborn outcome variables
Variable Mean ICC 95% CI for ICC Deff na
Gestational age (weeks) 34.5 0.031 0.008-0.055 10.4 265
Birth weight (g) 2321.1 0.033 0.009-0.058 11.6 264
Birth weight 2° twin (g) 1905.2 0.007 <0.001-0.043 1.4 21
APGAR 1stminute 7.3 0.032 0.008-0.056 8.6 261
APGAR 1stminute 2° twin 6.7 0.042 <0.001-0.098 2.2 21
APGAR 5thminute 8.6 0.041 0.012-0.070 11.5 261
APGAR 5thminute 2° twin 8.3 0.002 <0.001-0.034 1.1 21
Head circumference (cm) 31.7 0.031 0.008-0.055 10.1 236
Head circumference 2° twin (cm) 30.8 0.018 <0.001-0.067 1.1 18
Stature (cm) 44.3 0.031 0.007-0.054 10.3 237
Stature 2° twin (cm) 42.3 0.025 <0.001-0.077 1.4 18
Length of ICU stay (days) 8.4 0.088 0.028-0.148 21.4 220
Length of hospital stay (days) 13.3 0.037 0.009-0.065 8.5 235
Age of newborn at sepsis (days) 4.6 0.173 0.054-0.292 7.2 39
Age of newborn at death (days) 8.9 0.088 <0.001-0.179 2.7 17
Table 9 Estimates of prevalence (P), intracluster correlation coefficients (ICC), their respective 95% CI, design effect (Deff), and mean cluster size (na) for categorical management variables in spontaneous labor conditions or preterm
due to pPROM
Variable P(%) ICC 95% CI for ICC Deff na
Preterm birth due to spontaneous labor:
Use of corticosteroids 28.5 0.032 0.002-0.062 5.2 73
Corticosteroids (betamethasone) 86.4 0.851 0.754-0.948 18.8 21
Use of tocolytic agents 23.6 0.068 0.015-0.121 8.7 72
Association of tocolytic agents 9.9 0.368 0.167-0.570 8.4 17
Therapeutic failure of tocolysis 11.4 0.165 0.029-0.301 4.3 17
Use of magnesium sulphate (neuroprotection) 3.9 0.070 0.016-0.125 9.3 70
Use of antibiotics 42.8 0.262 0.117-0.407 28.8 72
Intravenous antibiotic 93.3 0.321 0.127-0.515 10.1 31
Association of antibiotic 15.3 0.144 0.025-0.263 12.9 30
Group B streptococcus screening 24.3 0.286 0.131-0.442 26.2 65
Preterm birth due to pPROM:
Use of corticosteroids 40.5 0.042 0.002-0.083 3.7 53
Corticosteroids (betamethasone) 85.0 0.965 0.941-0.990 23.5 21
Use of tocolytic agents 17.7 0.547 0.364-0.729 38.3 56
Use of antibiotics 78.2 0.233 0.095-0.371 18.3 54
Intravenous antibiotic 91.0 0.366 0.180-0.552 14.4 41
Association of antibiotic 20.9 0.245 0.093-0.397 20.1 41
Group B streptococcus screening 36.3 0.441 0.260-0.622 27.9 50
Estimated deffs
Estimated Deffs are presented in Tables 1, 2, 3, 4, 5, 6, 7, 8, 9 and 10 for each of 261 variables. Deff ranged from 0.6 to 148.0, with a median of 6.1.
Deff were under 5.0 in 74% of variables in Tables 1 and 2, ranging from 1.2 to 42.2 (median 3.65). Table 3 presents Deff values ranging from 2.8 to 60 (median 13.0). In variables related to gestational process (Tables 4 and 5), Deff values ranged from 0.6 to
101.5 (median 4.9). The variables related to labor conditions (Table 6) showed Deff ranging from 1.1 to 148 (median 6.6), with 60% of them under 8.0. In Tables 7 and 8, related to perinatal outcomes, Deff values ranged from 1.1 to 84.8 (median 7.8). Tables 9 and 10 presented Deff median of 16.35 and 7.0, respectively.
We can observe that greater Deff median is present in process variables (Table 9), and greater ICCs.
Table 10 Estimates of prevalence (P), intracluster correlation coefficients (ICC), their respective 95% CI, design effect (Deff), and mean cluster size (na) for diagnosis and management among categorical variables related to therapeutic
preterm delivery
Variable P(%) ICC 95% CI for ICC Deff na
Therapeutic delivery for maternal disease 74.6 0.102 0.032-0.172 9.6 73
Therapeutic delivery for fetal disease 54.1 0.065 0.016-0.115 7.0 73
Maternal disease responsible for interruption of pregnancy:
●Diabetes 7.3 0.063 0.011-0.115 5.5 54
●Gestational hypertension 12.9 0.144 0.048-0.240 9.4 54
●Chronic hypertension 15.3 0.009 <0.001-0.027 1.8 54
●Preeclampsia 58.2 0.079 0.017-0.140 5.4 54
●Eclampsia 3.2 0.017 <0.001-0.041 1.8 54
●HELLP syndrome 9.4 0.012 <0.001-0.031 1.2 54
●Abruptio placentae 7.7 0.009 <0.001-0.026 1.6 54
●Previous placentae 3.3 0.001 <0.001-0.013 0.8 54
Fetal disease responsible for interruption of pregnancy:
●Fetal distress 32.6 0.052 0.010-0.095 6.1 71
●Fetal growth restriction 19.8 0.037 0.004-0.069 4.4 71
●Malformation 5.2 0.144 0.052-0.236 13.5 71
●Other fetal condition 15.1 0.161 0.061-0.262 15.8 71
Exams to evaluate fetal condition:
●Cardiotocography 61.0 0.299 0.148-0.451 23.7 67
●Dopplerfluxometry 61.1 0.159 0.059-0.260 14.4 67
●Fetal biophysical profile 32.2 0.508 0.331-0.686 43.5 67
●Fetal movements control 4.3 0.101 0.030-0.172 12.3 67
●Other exam 12.9 0.041 0.005-0.077 4.1 67
Determinant exams for diagnosis:
●Cardiotocography 23.2 0.104 0.032-0.176 10.1 70
●Dopplerfluxometry 29.8 0.064 0.014-0.113 6.4 70
●Fetal biophysical profile 14.6 0.290 0.142-0.438 24.0 70
●Fetal echocardiography 1.2 0.030 0.001-0.058 4.6 70
●Maternal hepatic dysfunction 15.9 0.194 0.079-0.308 19.9 70
●Maternal hematologic dysfunction 21.0 0.278 0.134-0.423 29.9 70
●Other 41.2 0.102 0.031-0.173 10.0 70
Maternal or fetal attempted treatment 57.9 0.056 0.012-0.101 5.7 71
Use of corticosteroids 42.6 0.059 0.012-0.105 6.2 70
Discussion
This study presents a large number of intracluster cor-relation coefficients whose values can be considered low (close to zero) in most variables, showing intracluster heterogeneity.
The greater ICC values were found in process vari-ables, especially management in spontaneous preterm labor conditions, as corticosteroids use, Group B strep-tococcus screening, use of tocolytic agents and use of antibiotic. Indeed, the mean ICC value for these vari-ables was 10 times higher than the mean ICC of the study. The variable with the highest ICC was“ corticoste-roids – betamethasone”, with a value of 0.965. The prevalence of this variable was 85%, showing a high de-gree of homogeneity in this management for preterm labor. These findings are in accordance with the litera-ture that describes ICC values generally higher for vari-ables related to process compared to those varivari-ables related to outcome [15,16].
In the field of maternal and perinatal healthcare, Taljaard et al. calculated ICC values based on data ob-tained from secondary/tertiary services [16]. Comparing with our study, they found an overall median ICC of 0.067 versus 0.028. For maternal and newborn outcome variables, their median ICCs was 0.011 (versus 0.014), and 0.054 (versus 0.041), respectively. The findings of those investigators showed that, for variables associated to process, ICC values tend to be > 0.07. The present findings are in agreement with this observation.
Pagelet al.[17] estimated ICC for a range of outcomes using data from five community-based clusters rando-mized controlled trials in three low-income countries. Estimated ICC values for mortality outcomes were lower than those for process outcomes, with narrower confi-dence intervals throughout for trials with larger number of clusters.
All comparisons show that the smaller the cluster size, the higher the ICC and the opposite occurs regarding the prevalence of the condition. Estimates of intracluster correlation are much less reliable for rare outcomes and the size of the cluster had a greater impact than the number of clusters on the reliability of estimates for rare outcomes [17].
Furthermore, higher healthcare levels tend to increase the degree of homogeneity [18,19]. The size of ICC in-creases if the ICC represents data from secondary rather than primary care. This may be a reflection of the under-lying heterogeneity of the datasets under consideration as the conditions represented across the different data-sets were diverse. Although numerically small (average 0.01), such differences can have a substantial effect on sample size, even when the average of cluster is small [15]. The clusters in this study are secondary and tertiary hospitals, most of them are teaching hospitals, with the
majority of procedures performed in conformity with evidence-based healthcare protocols.
Stratified randomization had the effect of reducing es-timates of cluster correlation [15]. However, in the same way that in Brazilian Network for Surveillance of Severe Maternal Morbidity Study [20], which found ICC values close to zero, the selection of clusters did not performed stratification by region. The distribution of centers in this study, with almost half located in southeast region, is in accordance with the actual distribution of health-care institutions and the proportionality of births per re-gion in the country [21,22].
The large number of intracluster correlation coef-ficients presented in this study, considered low (close to zero) in most of variables, can probably be seen as a good parameter of variance for calculating sample size in new studies in the field of perinatal and maternal health [15].
We can, however, to identify some possible limitations of the study, including the fact that we used a non-probabilistic sample from the centers (hospitals). There-fore, strictly speaking, the findings cannot be generalized to other populations. However, the majority of hospitals included in the study was third level referral hospitals taking care of high risk pregnancies and preterm babies. Probably the results would be applicable to other centers with such characteristics, irrespective of being private or public, especially in middle income countries like Brazil.
Conclusions
The Brazilian Multicenter Study on Preterm Birth, de-veloped as part of the Brazilian Network for Studies on Reproductive and Perinatal Health, to the best of our knowledge is the first cross sectional multicenter study on this topic in the country. It represents a planned comprehensive assessment of preterm birth in Brazil and ICC values calculation and analysis of more than 250 maternal and newborn variables, showed hetero-geneity of data in selected clusters. These findings in-crease reliability of study estimates and allow the use of these results to calculate the required sample size for future research studies in maternal and perinatal health.
Abbreviations
CRF:Clinical research form; Deff: Design effect; ICC: Intraclass correlation coefficient; SRS: Simple random sampling.
Competing interests
The authors declare that they have no competing interests.
Authors’contributions
Acknowledgements
The authors thank the CNPq (Brazilian National Research Council) and Fapesp (Foundation for Support to Research of the State of Sao Paulo) for the financial sponsorship of this study, Process Fapesp 2009/53245-5 (Call AP.PPSUS-1). This publication was also sponsored by Fapesp (Processo 2014/08183-0)
The Brazilian Multicenter Study on Preterm Birth study group:Sergio T Marba, Ruth Guinsburg, Francisco E Martinez, Vilma Zotarelli, Lucio T Gurgel, Francisco E Feitosa, George N Chaves, Ana M Porto, Isabela C Coutinho, Antonio C Barbosa Lima, Elias F Melo Jr, Débora F Leite, Melania M Amorim, Adriana SO Melo, Fabiana O Melo, Marília G Martins, Marynea V Nunes, Cláudio S Paiva, Moises D Lima, Djacyr M Freire, Edson G Tristão, Denis J Nascimento, Renato T Souza, Carlos A Menezes, Marcelo Aquino, Janete Vettorazzi, Cintia E Senger, Augusta MB Assumpção, Marcela AF Guedes, Maria EL Moreira, Vera T Borges, Nelson L Maia Filho, Jacinta P Mathias, Eduardo Souza, Ana CP Zamarian, Silvana M Quintana, Patrícia PS Melli, Fátima A Lotufo, Kaliane Uzilin, Elvira A Zanette, Carla B Andreucci, Tenilson A Oliveira, Laércio R Oliveira, Nelson Sass, Mirian RF Silveira, Pedro R Coutinho, Luciana Siqueira.
Author details
1
Department of Obstetrics and Gynecology, School of Medical Sciences, University of Campinas, Campinas, Brazil.2Center for Studies in Reproductive
Health of Campinas (Cemicamp), Campinas, Brazil.
Received: 27 November 2013 Accepted: 14 April 2014 Published: 22 April 2014
References
1. Ukoumunne OC, Gulliford MC, Chinn S, Sterne JA, Burney PG:Methods for evaluating area-wide and organisation-based interventions in health and health care: a systematic review.Health Technol Assess1999,3(5):iii-92. 2. Kish L:Survey sampling.New York: John Wiley & Sons; 1965.
3. Donner A, Koval JJ:Design considerations in the estimation of the intraclass correlation.Ann Hum Genet1982,46:271–277. 4. Campbell MK, Grimshaw JM, Elbourne DR:Intracluster correlation
coefficients in cluster randomised trials: empirical insights into how should they be reported.BMC Med Res Methodol2009,4:9. 5. Killip S, Mahfoud Z, Pearce K:What is an intracluster correlation
coefficient? Crucial concepts for primary care researchers.Ann Fam Med 2004,2:204–208.
6. Adams G, Gulliford MC, Ukoumunne OC, Eldridge S, Chinn S, Campbell MJ:
Patterns of intra-cluster correlation from primary care research to inform study design and analysis.J Clin Epidemiol2004,57:785–794.
7. Hayes R, Moulton LH:Cluster Randomised Controlled Trials.New York: Chapman &Hall/CRC Press; 2009.
8. US Census Bureau:Technical paper 63RV: current population survey -design and methodology.TP63RV 2002, 14–18. Available at http://www.census.gov/prod/2002pubs/tp63rv.pdf. Accessed on October 02, 2013.
9. Hayes RJ, Benett S:Simple size calculation for cluster-randomised trials.
Int J Epidemiol1999,28(2):319–326.
10. Eldridge SM, Ukoumunne OC, Carlin JB:The intra-cluster correlation coefficient in cluster randomized trials: a review of definitions.Int Stat Rev2009,77(3):378–394.
11. Passini R Jr, Tedesco RP, Marba ST, Cecatti JG, Guinsburg R, Martinez FE, Nomura ML, Brazilian Network of Studies on Reproductive and Perinatal Health:Brazilian multicenter study on prevalence of preterm birth and associated factors.BMC Pregnancy Childbirth2010,10:22.
12. Tedesco RP, Passini R Jr, Cecatti JG, Camargo RS, Pacagnella RC, Sousa MH:
Estimation of preterm birth rate, associated factors and maternal morbidity from a Demographic and Health Survey in Brazil.Matern Child Health J2013,17(9):1638–1647.
13. SPSS for Windows:Release 20.0.New York: SPSS Inc; 2011.
14. StataCorp:Stata Statistical Software: Release 7, College Station. College Station, TX: StataCorp LP; 2001.
15. Campbell MK, Fayers PM, Grimshaw JM:Determinants of the intracluster correlation coefficient in cluster randomised trials: the case of implementation research.Clin Trials2005,2:99–107.
16. Taljaard M, Donner A, Villar J, Wojdyla D, Velazco A, Bataglia V, Bataglia V, Faundes A, Langer A, Narváez A, Valladares E, Carroli G, Zavaleta N, Shah A,
Campodónico L, Romero M, Reynoso S, de Pádua KS, Giordano D, Kublickas M, Acosta A, World Health Organization 2005 Global Survey on Maternal and Perinatal Health Research Group:Intracluster correlation coefficients from the WHO Global Survey on Maternal and Perinatal Health: implications for implementation research.Paediat Perinatal Epidemiol 2005,2008(22):117–125.
17. Pagel C, Prost A, Lewycka S, Das S, Colbourn T, Mahapatra R, Azad K, Costello A, Osrin D:Intracluster correlation coefficients and coefficients of variation for perinatal outcomes from five cluster-randomised controlled trials in low and middle-income countries: results and methodological implications.Trials2011,12:151.
18. Piaggio G, Carroli G, Villar J, Pinol A, Bakketeig L, Lumbiganon P, Bergsjø P, Al-Mazrou Y, Ba'aqeel H, Belizán JM, Farnot U, Berendes H, WHO Antenatal Care Trial Research Group:Methodological considerations on the design and analysis of an equivalence stratified cluster randomization trial.
Stat Med2001,20:401–416.
19. Campbell SM, Braspenning J, Hutchinson A, Marshall M:Research methods used in developing and applying quality indicators in primary care.
Qual Safe Health Care2002,11:358–364.
20. Haddad SM, Sousa MH, Cecatti JG, Parpinelli MA, Costa ML, Souza JP, and for the Brazilian Network for Surveillance of Severe Maternal Morbidity Group:Intraclass correlation coefficients in the Brazilian network for surveillance of severe maternal morbidity study.BMC Pregnancy Childbirth 2012,12:101.
21. Brazilian Ministry of Health:National Registry of Health Facilities.2013. Available at http://cnes.datasus.gov.br/Lista_Tot_Es_Estado.asp. Accessed on November 27th, 2013.
22. Brazilian Ministry of Health:SINASC–National Information System on Live Births.2011. Available at http://tabnet.datasus.gov.br/cgi/tabcgi.exe?sinasc/ cnv/nvuf.def. Accessed on November 27th, 2013.
doi:10.1186/1471-2288-14-54
Cite this article as:Lajoset al.:Intracluster correlation coefficients for the Brazilian Multicenter Study on Preterm Birth (EMIP): methodological and practical implications.BMC Medical Research Methodology201414:54.
Submit your next manuscript to BioMed Central and take full advantage of:
• Convenient online submission
• Thorough peer review
• No space constraints or color figure charges
• Immediate publication on acceptance
• Inclusion in PubMed, CAS, Scopus and Google Scholar
• Research which is freely available for redistribution