ISSN: 2231-3354 Received on: 02-05-2012 Revised on: 09-05-2012 Accepted on: 15-05-2012
DOI: 10.7324/JAPS.2012.2615
Nitin Sharma, Praveen Rajput, Arti Thakkar and G. S. Sarma Department of Pharmaceutical Analysis, I.S.F. College of Pharmacy, Near Ghal Kalan, Ludhiana-Ferozepur Road, Moga. 142001.
For Correspondence Nitin Sharma
Department of Pharmaceutical Analysis, I.S.F. College of Pharmacy, Near Ghal Kalan, Ludhiana-Ferozepur Road, Moga. 142001. Phone: + 91 99880 39387
RP-HPLC Method Development for Estimation of
Sildenafil Citrate in Tablets and in Seminal Fluid
Nitin Sharma, Praveen Rajput, Arti Thakkar and G. S. Sarma
ABSTRACT
A RP HPLC method for estimation of sildenafil citrate (SC) in tablet dosage form and seminal fluid was developed and validated. Best resolution was obtained with column
Waters Spherisorb® C18 bonded silica, (5 µm, 4.6 x 250 mm) at 230 nm with retention time of
5.01 min. The mobile phase used was TEA (0.2%) pH adjusted at 3 with OPA and ACN (60:40) with flow rate of 1.0 mL/min. The method for estimation of sildenafil citrate in tablet dosage form was found to be linear, accurate, precise, sensitive and selective. Whereas the bioanalytical estimation of SC in seminal fluid was found to be in the range of 100 ng/mL to 10µg/mL. Method was found to be highly sensitive as LOD and LOQ were found to 0.3 µg/ml and 0.9µg/ml. The repeatability and reproducibility were within the range i.e. less than 2%.The accuracy of the method was 99.3%. The percentage purity was calculated for market formulation was 102.8%. The internal standard used for bioanalytical methods was Diclofenac sodium. The drug was extracted from seminal fluid by protein precipitation using ACN as precipitating agent. The linearity range was from 100.0ng/mL to 2.0µg/mL. The LOD and LOQ were found to 0.03µg/mL and 0.1µg/mL. The repeatability and reproducibility were within the range i.e. % RSD less than 15%. The accuracy of the method was 90.36%.and the extraction efficiency was found to be 98.25%. The stability of drug was found to be within the range i.e. less the 15%.
Keywords: Sildenafil citrate (SC), Reverse-phase High performance liquid chromatography
(RP-HPLC), tablet dosage form, seminal fluid, highest quantified concentration (HQC), middle quantified concentration (MQC), lowest quantified concentration (LQC).
1. INTRODUCTION
Sildenafil works by inhibiting the enzyme PDE5 by occupying its active site. Men who suffer from erectile dysfunction often produce too little amounts of NO. Small amount of cGMP produced is broken down at the same rate and do not accumulate to cause a prolonged vasodilatation effect. cGMP is not hydrolysed as fast, which allows the smooth muscle to relax leading to increased blood flow into the organ and therefore penile erection (Kim, 1991). Sildenafil is rapidly and incompletely absorbed after oral administration, with absolute bioavailability of approximately 40 % (Berzas, 2000). According to Lee and Min (Lee, et al., 2001), grapefruit juice appears to increase the Cmax of sildenafil by 42 % without significantly increasing AUC.
This work is a part estimation of SC in market formulation & in biological matrices. We developed an HPLC method for the quantitation of SC from human seminal fluid and in the marketed formulation. Several analytical methods have been developed for the separation and quantitation of SC from different matrices. Bhoir 2000 (Bhoir, et al., 2000) developed the method for estimation of SC in Human plasma using Methanol and Pot. Phosphate buffer (70:30). Jeong 2001 (Jeong, et al., 2001) detected SC and its metabolite in human plasma using column switching HPLC method. Daraghmeh 2001 (Daraghmeh, et al., 2001) estimated the SC in commercial and market formulation using ACN and Ammonium acetate as mobile phase. Tracqui 2003 (Tracqui, et al., 2003) estimated SC using HPLC-MS Bupernorphine as an internal standard. Constantinos Pistos 2008 (Pistos, et al., 2008) used LC-MS for estimation of SC in post-mortem human blood samples. Daniela De Orsi 2009 (Daniela, et
al., 2009) used HPLC-PDA and elctrospray MS and Benzoic acid
as internal standard for estimation of SC.
In the present study, the effect of mobile phase pH (which influences the ionisation state of the compounds), the mobile phase composition (which influences the peaks separation), and the flow rate (which influences the peaks shape, retention time, and resolution, etc.) were studied on various chromatographic parameters such as resolution, plates, height equivalent to theoretical plates, symmetry factor, retention time, peak areas, etc.
EXPERIMENTS
Chemical and Reagents
Sildenafil citrate was procured from Sun Pharmaceuticals Industries Ltd., Mumbai. Diclofenac sodium (DS) as internal standard was procured from Kairav Chemical Ltd., Gandhinagar. While Market formulation of the sildenafil citrate from German remedies, a 50mg tablet ViograTM was purchased. All reagents like methanol, acetonitrile, triethylamine and water used were of HPLC grade and trifluoroacetic acid, potassium phosphate, othophosphoric acid used were of analytical grade without further purification.
Instrumentation and Software
HPLC analysis was performed using Waters 515 Series pumps combined with a Waters PDA 2998 series photo diode array
detector. The column used was Waters Spherisorb® C18 bonded
silica (5 µm, 4.6 x 250 mm). Analyte weighing, for preparation of calibration standards and quality controls, was done on a microbalance, Mettler-Toledo AB 204-S. All mobile phase solutions were filtered by Rocker 410 vacuum filter assembly using 0.2 micron filters and degassed ultrasonically by Steryl 40050 bath sonicator before use. The HPLC system was controlled by a PC workstation using Empower software installed on it.
Chromatographic Condition
The mobile phase used was TEA (0.2%) pH adjusted at 3 with OPA and ACN (60:40) flow rate of 1.0 mL/min. The elution was monitored at 230 nm. The mobile phase was prepared freshly every day.
Preparation of Stock Solution
Stock solution of 1 mg/mL of pure SC and its formulation were freshly prepared in methanol HPLC grade can be used for long time by storing at 4oC. Test solutions of SC were prepared by diluting required quantity of stock solution with mobile phase to follow the linearity range i.e., 100ng/mL to 10µg/mL for analytical method development and 100ng/mL to 2.0µg/mL for bioanalytical method development.
Sample solutions
Stock solution of market formulation was prepared by dissolving the required quantity of crushed powder of 20 tablets to make a concentration of approx. 1mg/mL in methanol HPLC graded. After this the suspension formed by excipients in market formulation was filtered and the filtrate was centrifuged and the supernatant was collected. Test solution of market formulation was prepared by diluting required quantity of supernatant stock solution of with mobile phase.
Semen samples collection and analysis
Sensitivity
Limit of detection (LOD) and limit of quantitation (LOQ) were calculated by taking the AUC of standard and calculation is according to the 3.3s/m and 10s/m criterions, respectively, where “s” is the standard deviation of the AUC (n = 10) of the sample and “m” is the slope of the corresponding calibration curve.
Optimisation of Chromatographic Condition
Effects of different chromatographic conditions on the instrumental responses create a situation where one has to compromise between different experimental variables in order to achieve the best chromatographic separation. Chromatographic separations are significantly affected by the mobile phase composition, pH, and flow rate. Therefore before selecting the conditions for the optimization, a number of preliminary trials were conducted with different combinations of different organic solvents and buffers at various compositions, and flow rate to check the retention time, shape, resolution, and other chromatographic parameters. Various factors such as mobile phase composition, mobile phase ratio and flow rate. All mobile phases used in optimization study were prepared by mixing the buffer system with the organic solvent in the desired proportions. The apparent pH of the mixture was adjusted to desired value using OPA. Mobile phase was then filtered through 0.2 µm membrane filter and sonicated before being used for chromatography.
ESTIMATION OF SC
Estimation of SC in market formulation
Equal volumes, (20µL), of the standard preparations and the preparations to be assayed containing SC or related substances in the mobile phase were injected into the chromatograph and the chromatograms recorded. The responses (peak area) for the major peaks were measured and the quantity of SC was calculated.
Estimation of SC in Human seminal fluid
Equal volume (20µL), of the standard preparations and the assay preparations that contain SC and IS in methanol were injected into the chromatograph and the chromatograms were recorded. The responses (peak area) for the major peaks were measured and the quantity of SC and IS in the assay solution was calculated.
Validation of proposed Method
Once the chromatographic method had been developed and optimized, it must be validated. The validation of an analytical method verifies that the characteristics of the method satisfy the requirements of the application domain. The proposed method was validated in the light of ICH Guidelines for linearity, precision, sensitivity, and recovery. Consequently, the following were performed.
Calibration curve (Linearity curve)
The linearity of an analytical method is its ability within a definite range to obtain results directly proportional to the
concentrations (quantities) of an analyte in the sample. Six different concentrations of SC and calibration curve were constructed in the specified concentration range. The calibration plot (Area under curve (AUC) of SC versus SC concentration) was generated by replicate analysis (n = 6) at all concentration levels and the linear relationship was evaluated using the least square method within Microsoft Excel® program.
For Bioanalytical method six different concentrations of SC with IS and calibration curve were constructed in the specified concentration range. The calibration plot (Ratio of AUC of SC by AUC of IS versus SC concentration) was generated by replicate analysis (n = 6) at all concentration levels and the linear relationship was evaluated using the least square method within Microsoft Excel® program.
Accuracy
For studying the accuracy of the proposed analytical method, and for checking the interference from excipients used in the dosage forms, recovery experiments were carried out by the standard addition method. This study was performed by the addition of known amounts of SC to a known concentration of the commercial tablets. For the determination of accuracy of the analytical procedure three identical dilutions of market formulation were spiked with different concentrations of standard solution i.e., 80%, 100% and 120%. AUC of these solutions were then observed and plotted into calibration curve, concentration and accuracies were calculated.
For determining the accuracy of bioanalytical method solutions containing lowest, middle, and highest quantification concentrations (LQC MQC and HQC) of the calibration curve, i.e. 100ng/mL, 800ng/mL, 2000ng/mL were prepared. Six injections at each of the specified concentration levels were injected. Accuracy was calculated as the percent of ratio of SC amount found to that of the actual of LQC, MQC and HQC.
Precision
Intra-day and inter-day precision for the analytical developed method were measured in terms of % R.S.D. The experiments were repeated three times a day for intra-day precision and on three different days for inter-day precision. The concentration values for both intra-day and inter-day precision were calculated six times separately and percent relative standard deviation were calculated.
calibrated with standard curves concurrently prepared on the day of analysis. Intra-day precision and inter-day precision for the developed methods were measured in terms of % R.S.D. Finally, the mean of % R.S.D. (% R.S.D. = [S/X] 100, where S is standard deviation and X is mean of the sample analysed) were taken for conclusion.
Extraction Efficiency
The recovery of an analyte is the extraction efficiency of an analytical process, reported as a percentage of the known amount of an analyte carried through the sample extraction and processing steps of the method. Spiked biological samples were prepared in triplicate at three concentrations LQC, MQC, HQC of SC and 2000 ng/mL of IS, and assayed as described above. The extraction efficiency of SC was determined by comparing the peak areas measured after analysis of spiked plasma samples with those found after direct injection of non-biological (unextracted) samples or blank sample into the chromatographic system at the same concentration levels.
Stability
Blank plasma was spiked with the known amount of SC to achieve the concentration of LQC, MQC and HQC (n = 3) and stored at −4 ◦C. The stability of these samples was checked for up to 15 days by comparing the results with fresh stock prepared on the day of analysis. Further, the freeze–thaw (−20oC/room temperature) stability of the SC spiked plasma samples were determined for three cycles. Samples were considered to be stable, if the assay values were within the acceptable limits of accuracy and precision. No internal standard was added prior to the analysis.
System Suitability Parameter
According to CDER, (CDER, 1994) accuracy and precision of HPLC data collected begin with a well behaved chromatographic system. The system suitability specifications and tests are parameters that provide assistance in achieving this purpose.
RESULTS AND DISCUSSION
Optimisation of Chromatographic Condition
All mobile phases used in optimization study were prepared by mixing the buffer system with the organic solvent in the desired proportions. The apparent pH of the mixtures was adjusted to desired value using H3PO4. Mobile phase was then
filtered through 0.2µm membrane filter and sonicated before b\eing used for chromatography.
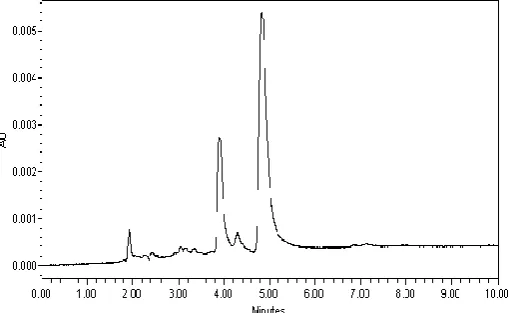
Looking at the different chromatographic parameters during the method development, the finally recommended mobile phase consisted of ACN: 0.2% TEA and pH adjusted to 3 using OPA 40:60 v/v. The best resolution and sensitivity of the method was obtained at 230 nm and mobile phase flow rate of 1 mL/min. typical chromatogram at the optimized condition gave sharp and symmetric peak with retention time of 5.01 min for SC. Thus, within very short time the system became ready for the next
sample injection without the need for additional wash time. The overlay chromatogram of SC in AMD is given below.
Fig. 1: Overlay Chromatogram of SC in Developed analytical method.
Validation of proposed Method
Calibration Curve (Linearity Curve)
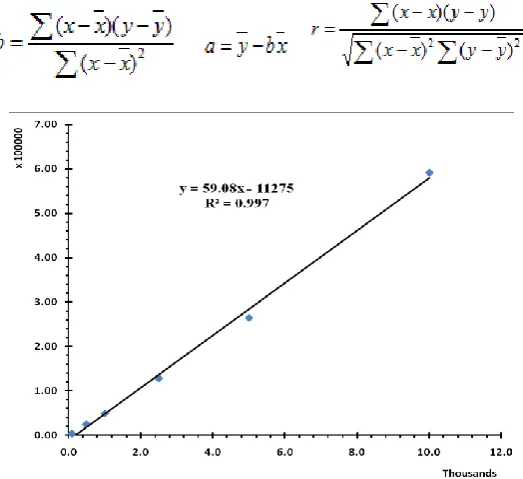
Calibration curve (peak area of SC) of analytical method was constructed by injecting six different concentrations of SC. The chromatographic responses were found to be linear over an analytical range of 100–10,000 ng/mL and found to be quite satisfactory and reproducible with time. The linear regression equation was calculated by the least squares method using Microsoft Excel® program. The calibration curve for linearity is given below.
Fig. 2: Calibration curve for linearity of SC for developed analytical method.
concentration) was generated by replicate analysis (n = 6) at all concentration levels and the linear relationship was evaluated using the least square method within Microsoft Excel® program. Chromatograms of SC working standard with IS and plasma peak is shown below in figure.
Fig. 3: Chromatogram of SC with Internal standard in Biological fluid.
Fig. 4: Calibration curve for linearity of SC for developed Bioanalytical method.
Percent Purity & Percent Recovery
For the determination of percentage purity of analytical method, approx. 2500ng/mL concentration of market formulation was injected and observed area was than plotted into the linearity curve and in the equation of line to calculate the concentration. The observed concentration of market formulation was 2570.3ng/mL and %age purity was obtained 102.8%.
Fig. 5: Chromatogram of SC in marketed formulation.
The recovery of an analyte is the extraction efficiency of an bioanalytical process, reported as a percentage of the known amount of an analyte carried through the sample extraction and processing steps of the method. Spiked biological samples were prepared in triplicate at three concentrations LQC, MQC, HQC of SC and 2000 ng/mL of IS, and assayed as described above. The extraction efficiency of SC was determined by comparing the peak areas measured after analysis of spiked plasma samples with those found after direct injection of non-biological (unextracted) samples or blank sample into the chromatographic system at the same concentration levels.
Table. 1: Percent purity of SC in market formulation and Percent recovery of SC in
seminal fluid.
Sr.
No.
Analytical Method Bioanalytical Method
Conc. (µg/mL)
approx
Conc. Calculated
%age recovery
Conc. (µg/mL)
approx
Conc. Calculate
d
%age recovery
1. 2500.00 2570.3 102.81 2000 1934.6 96.73
Accuracy
Accuracy data of analytical method in the present study ranged from 98.75 to 99.68% (Table) indicates that there was no interference from excipient components of market formulation.
Table. 2: Accuracy of developed analytical method.
Sr. No. Batch % Accuracy
1 80.0 99.68
2 100.0 99.56
3 120.0 98.75
Accuracy of bioanalytical method was calculated as the percent of ratio of SC amount found to that of the actual of LQC, MQC and HQC.
Table. 3: Accuracy of developed Bioanalytical method.
Sr. No. Conc. (ng/mL) Accuracy
1.0 200 93.12
2.0 800 93.83
3.0 2000 83.97
Precision
The concentration values for both intra-day precision and inter-day precision of analytical method were calculated six times separately and percent relative standard deviation were calculated. Finally, the mean of % R.S.D. (% R.S.D. = [S/X] 100, where S is standard deviation and X is mean of the sample analysed) were taken for conclusion.
Table. 4: Precision of developed analytical method.
Sr. No. Conc.
(ng/mL)
Intraday precision % RSD
Inter day precision % RSD
1 500 0.39 0.28
2 1000 0.41 0.53
3 2500 0.19 0.01
4 5000 0.19 0.08
quantification concentrations (LQC MQC and HQC) of the calibration curve, i.e. 100ng/mL, 800ng/mL, 2000ng/mL were prepared. Six injections at each of the specified concentration levels were injected within the same day for repeatability, and over a period of 3 days (6 injections/day) for reproducibility. Mean and relative standard deviation were calculated and used to judge accuracy and precision of the method. Both intra-day and inter-day samples were calibrated with standard curves concurrently prepared on the day of analysis. Intra-day precision and inter-day precision for the developed methods were measured in terms of % R.S.D. Finally, the mean of % R.S.D. (% R.S.D. = [S/X] 100, where S is standard deviation and X is mean of the sample analysed) were taken for conclusion.
Table. 5: precision of developed Bioanalytical method.
Sr. No. Conc.
(ng/mL)
Intraday precission % RSD
Inter day precission % RSD
2 800 0.4 1.723
3 2000 0.29 1.006
3 2000 0.29 1.006
Sensitivity
The LOD and LOQ were found to be 30.0 and 100.0 ng/mL, respectively.
System Suitability Parameter
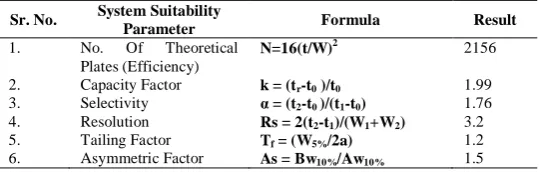
System suitability tests, an integral part of a chromatographic analysis are used to verify that the resolution and reproducibility of the chromatographic system are adequate for the analysis. A system suitability test according to USP and CDER US-FDA was performed on the chromatograms obtained from standard and test solutions to check different above mentioned parameters and the results obtained from six replicate injections of the standard solution are summarized in the table below.
Table. 6: System suitability parameter of Bioanalytical method.
Sr. No. System Suitability
Parameter Formula Result
1. No. Of Theoretical Plates (Efficiency)
N=16(t/W)2 2156
2. Capacity Factor k = (tr-t0 )/t0 1.99
3. Selectivity α = (t2-t0 )/(t1-t0) 1.76
4. Resolution Rs = 2(t2-t1)/(W1+W2) 3.2
5. Tailing Factor Tf = (W5%/2a) 1.2
6. Asymmetric Factor As = Bw10%/Aw10% 1.5
Stability Parameters
Blank seminal fluid was spiked with the known amount of SC to achieve the concentration of LQC, MQC and HQC (n = 3) and stored at −4 ◦C. The stability of these samples was checked for up to 15 days by comparing the results with fresh stock prepared on the day of analysis. Further, the freeze–thaw (−20 ◦C/room temperature) stability of the SC spiked plasma samples was determined for three cycles. Samples were considered to be stable, if the assay values were within the acceptable limits of accuracy and precision. No internal standard was added prior to the analysis.
Table. 7: Stability parameters of sildenafil citrate in Bioanalytical method.
Sr. No.
Conc. (ng/mL)
% RSD Post extractive
Short term Stability (3days)
Post extractive Long term Stability (15 days)
Freeze Thaw Stability
1 200 6.9 0.79 1.72
2 800 2.81 1.64 0.85
3 2000 0.79 1.01 0.47
CONCLUSION
In the present work, a new rapid, simple and sensitive reversed phase HPLC method has been developed, optimized and validated for the estimation of SC in market formulation and in seminal plasma using UV detector and isocratic elution. Optimization showed that the mobile phase pH and composition are more crucial parameters to be controlled than flow rate for reproducible and quantitative estimation of the SC. The short peak retention time of 5.01 min cuts down on overall time of sample analysis and thereby makes the method more cost effective. Methods were found to be linear over an analytical range of 100– 10,000 ng/mL and bioanalytical range of 100–2,000 ng/mL. LoD and LoQ of analytical and bioanalytical method were found to be 30.0 and 100.0 ng/mL, respectively. From the extraction efficiency data, the recovery of the active component was found to be quantitative. Selectivity of the method was demonstrated by the absence of any interfering peaks from other coexisting endogenous substances and excipients at the retention time of the drug as well as IS. Simple and reproducible sample extraction procedure along with reconstitution in minimum quantity of mobile phase offers the higher sensitivity (30 ng/mL) for bioanalytical studies and was successfully applied for determination of SC in seminal fluid. In summary, the optimized chromatographic estimation of SC with good resolution in a short time can be used for estimation of SC in market formulation and in seminal fluid.
ACKNOWLEDGEMENT
Drugs were procured from Sun Pharmaceuticals Industries Ltd., Mumbai and Kairav chemical Ltd., Gandhinagar. Authors are greatly thankful to the Chairman Sh. Parveen Garg and management of ISF college of Pharmacy and Lab in-charge of ISFAL for providing HPLC facility.
REFERENCES
Anonymous 1998, Drug Profile Distributed by Pfizer Labs, NY, USA, November 1998.
Anonymous 2010, Drug Profile Distributed by Pfizer Labs, NY, USA, January 2010.
Berzas J.J., Rodriguez J., Castaneda G., Villasenor M.J.. Voltammetric Behaviour of Sildenafil Citrate (Viagra) Using Square Wave and Adsorptive Stripping Square Wave Techniques. Determination in Pharmaceutical Products. Anal. chim. Acta, 2000, 417:143-148.
Bhoir I. C., Bhoir S. I., Bari V. R., Bhagwat A. M., Sundaresan M. An Assay Method for the Determination of Sildenafil in Human Plasma Using RP-HPLC, Indian Drugs 2000 37 (7): 319-322
Daniela D.O., Pellegrini M, E. Marchei, P. Nebuloni, B. Gallinella, G. Scaravelli. High performance liquid chromatography-diode array and electrospray-mass spectrometry analysis of vardenafil, sildenafil, tadalafil, testosterone and local anesthetics in cosmetic creams sold on the Internet web sites, Journal of Pharmaceutical and Biomedical Analysis. 2009 50: 362–369
Daraghmeh N., Al-Omari M., Badwan A.A., Jaber A.M.Y.. Determination of sildenafil citrate and related substances in the commercial products and tablet dosage form using HPLC, Journal of Pharmaceutical and Biomedical Analysis, 2001 25: 483–492.
Jeong C. K., Lee H.Y., Jang M.S., Kim W.B, Lee H. K.. Narrow Bore High-Performance Liquid Chromatography for the Simultaneous Determination of Sildenafil and Its Metabolite UK-103, 320 in Human Plasma Using Column Switching, Journal of Chromatography B, 2001 752: 141-147.
Kim N, Azadzoi K.M., Goldstein I, Tejada I.S.D.. A nitric
oxide-like factor mediates non-adrenergic non-cholinergic neurogenic relaxation of penile corpus cavernosum smooth muscle. J Clan Invest 1991, 88:112-8.
Lee M, Min D. Determination of Sildenafil Citrate in Plasma by High-Performance Liquid Chromatography and a Case for Potential Interaction of Grapefruit Juice With Sildenafil Citrate, Therapeutic Drug Monitoring, 2001, 23(1): 1-26
Pistos C., Papoutsis I., Dona A., Stefanidou M., Athanaselis S., Maravelias C., Spiliopoulou C.. Off-line HPLC method combined to LC– MS for the determination of sildenafil and its active metabolite in post-mortem human blood according to confirmation criteria. Forensic Science International 2008 178:192–198