Effects of Instantaneous Multiband Dynamic
Compression on Speech Intelligibility
Tobias Herzke
Medizinische Physik, Universit¨at Oldenburg, D-26111 Oldenburg, Germany
Email:[email protected]
Volker Hohmann
Medizinische Physik, Universit¨at Oldenburg, D-26111 Oldenburg, Germany
Email:[email protected]
Received 1 May 2004; Revised 26 January 2005
The recruitment phenomenon, that is, the reduced dynamic range between threshold and uncomfortable level, is attributed to the loss of instantaneous dynamic compression on the basilar membrane. Despite this, hearing aids commonly use slow-acting dynamic compression for its compensation, because this was found to be the most successful strategy in terms of speech quality and intelligibility rehabilitation. Former attempts to use fast-acting compression gave ambiguous results, raising the question as to whether auditory-based recruitment compensation by instantaneous compression is in principle applicable in hearing aids. This study thus investigates instantaneous multiband dynamic compression based on an auditory filterbank. Instantaneous envelope compression is performed in each frequency band of a gammatone filterbank, which provides a combination of time and frequency resolution comparable to the normal healthy cochlea. The gain characteristics used for dynamic compression are deduced from categorical loudness scaling. In speech intelligibility tests, the instantaneous dynamic compression scheme was compared against a linear amplification scheme, which used the same filterbank for frequency analysis, but employed constant gain factors that restored the sound level for medium perceived loudness in each frequency band. In subjective comparisons, five of nine subjects preferred the linear amplification scheme and would not accept the instantaneous dynamic compression in hearing aids. Four of nine subjects did not perceive any quality differences. A sentence intelligibility test in noise (Oldenburg sentence test) showed little to no negative effects of the instantaneous dynamic compression, compared to linear amplification. A word intelligibility test in quiet (one-syllable rhyme test) showed that the subjects benefit from the larger amplification at low levels provided by instantaneous dynamic compression. Further analysis showed that the increase in intelligibility resulting from a gain provided by instantaneous compression is as high as from a gain provided by linear amplification. No negative effects of the distortions introduced by the instantaneous compression scheme in terms of speech recognition are observed.
Keywords and phrases:hearing aids, automatic gain control, fast-acting dynamic compression, speech intelligibility.
1. INTRODUCTION
Dynamic compression is widely used in hearing aids for the compensation of the recruitment phenomenon, that is, the reduced dynamic range between threshold and uncom-fortable level, which is often observed in hearing losses of cochlear origin (sensorineural hearing loss). Dynamic com-pression maps a larger dynamic range of acoustic signals to the reduced dynamic range of hearing-impaired persons, en-abling them to perceive signals that would otherwise be be-low their threshold, while still not exposing them to un-comfortably loud sounds in response to high-level input sig-nals. Hearing aids implementing dynamic compression usu-ally divide the input signal into a small number of frequency bands, and perform dynamic compression in each of these bands. Several rationales for fitting the compression
the idea of applying slow-acting compression for subband signal-to-noise ratio (SNR) optimization. Other authors ar-gued that syllabic compression should lead to increased au-dibility of consonants and thus might improve the percep-tion of consonants [11]. Current hearing aids use compres-sion time constants in the range from a few milliseconds to several seconds. Compression usually sets in at low input lev-els, that is, a wide range of input levels is compressed.
All fitting rationales are mainly driven by empirical find-ings rather than by objective analysis of the physiological ef-fects of hearing loss. Recently, the physiological basis of sen-sorineural hearing loss was largely clarified (cf. [12]), which might help to improve fitting rationales in the future. Physi-ological data show that an instantaneous compression of the basilar membrane motion takes place, which is attributed to the action of the outer hair cells. The compression is active on a wide range of input levels and provides compression of the dynamic range by a factor of about two to three. In combination with the frequency-place transform provided by the micromechanical properties of the basilar membrane, the system is effectively described as a nonlinear filterbank, with an approximately logarithmic time and frequency reso-lution, and level-dependent filter shapes.
Given the finding that recruitment results from a loss of instantaneous compression on the basilar membrane, re-cruitment patients might benefit from instantaneous com-pression performed in a hearing aid. Probably due to the ambiguous results for fast-acting compression, the consider-ations of the SII, and due to the apparent signal distortions, instantaneous compression for hearing aids has rarely been evaluated. The few previous studies investigating instanta-neous compression for hearing aids have used, for example, broadband peak amplitude equalization [13] or octave band waveform compression [14] and reported increased speech intelligibility in quiet [13] or in noise [14], compared to more conventional hearing aids. In order to increase em-pirical findings in instantaneous compression, we assess the performance of a system which mimics the basic character-istics of the healthy cochlea. An auditory filterbank, that is, the gammatone filterbank [15], is used for frequency analy-sis and syntheanaly-sis, which assures an auditory-like combina-tion of time and frequency resolucombina-tion for all frequencies, which might help reducing perception of distortions. Since the (partial) loss of nonlinear functionality in the impaired cochlea cannot be compensated for by introducing another nonlinear system in the form of an external compressor [16], we do not expect the combined system to behave like the healthy cochlea alone. Audible distortions are still to be ex-pected from the combined system, as well as failure to re-store other deficiencies of the impaired cochlea, like reduced frequency selectivity. To avoid excessive distortions, instan-taneous envelope compression is used rather than waveform compression, as explained inSection 2.3.
The gain characteristics used for the instantaneous dy-namic compression aims at restoring loudness and was deduced, individually for each subject, from adaptive cate-gorical loudness scaling [17]. To investigate the effect of in-stantaneous multiband compression on speech
intelligibil-ity, tests were performed with nine sensorineural hearing-impaired subjects: The Oldenburg sentence test in noise [18], and a one-syllable rhyme test in quiet [19]. Tests were performed both with instantaneous dynamic compression and with linear amplification. Results for both amplification schemes were compared individually for each subject.
2. METHOD
2.1. Subjects
Nine sensorineural hearing-impaired subjects (4 males, 5 fe-males; aged 49–78 years; median 65 years) participated in the experiment. Eight subjects were regular hearing-aid users, while one subject (AK) had never used hearing aids. Thresh-old and uncomfortable level were measured for each sub-ject at the standard audiometric frequencies from 125 Hz to 8 kHz. The subjects showed different types and degrees of sensorineural hearing loss.Figure 1shows the audiograms of all subjects, that is, the threshold of hearing and the uncom-fortable level for sinusoids as a function of frequency. The gap between bone and air conduction thresholds was 10 dB or smaller, confirming true sensorineural hearing loss in all subjects. All subjects were paid for their participation on an hourly basis.
2.2. Procedure
Each subject participated in two experimental sessions, each lasting 1 to 1.5 hours. The two sessions were performed on different days within one week. In the first session, standard audiometry, adaptive categorical loudness scaling [17], the Oldenburg sentence test in noise [18,20], and a one-syllable rhyme test in quiet [19] were performed. Speech tests were performed to train the subjects on the task. In the second ses-sion, speech tests were performed after processing with dif-ferent amplification schemes.
Measurements were performed in two clusters: after fin-ishing experiments with subjects AK, BE, and FL, measure-ments were reviewed and refined for the remaining subjects. Thus, the frequencies used for loudness scaling and the sam-pling of preprocessed presentation levels and SNRs differ slightly between these groups of subjects, as described in the following subsections.
2.2.1. Loudness scaling
−10 0 10 20 30 40 50 60 70 80 90 100 110 120
×102
Sound le vel (dB HL) AK
1.25 2.5 5 10 20 40 80 Frequency (Hz)
AK HTL NH cu 25
AK cu 25 AK UCL (a) −10 0 10 20 30 40 50 60 70 80 90 100 110 120 Sound le vel (dB HL) BA
1.25 2.5 5 10 20 40 80 ×102 Frequency (Hz)
BA HTL NH cu 25
BA cu 25 BA UCL (b) −10 0 10 20 30 40 50 60 70 80 90 100 110 120 Sound le vel (dB HL) BE
1.25 2.5 5 10 20 40 80 ×102 Frequency (Hz)
BE HTL NH cu 25
BE cu 25 BE UCL (c) −10 0 10 20 30 40 50 60 70 80 90 100 110 120 Sound le vel (dB HL) BH
1.25 2.5 5 10 20 40 80 ×102 Frequency (Hz)
BH HTL NH cu 25
BH cu 25 BH UCL (d) −10 0 10 20 30 40 50 60 70 80 90 100 110 120 Sound le vel (dB HL) DF
1.25 2.5 5 10 20 40 80 ×102 Frequency (Hz)
DF HTL NH cu 25
DF cu 25 DF UCL (e) −10 0 10 20 30 40 50 60 70 80 90 100 110 120 Sound le vel (dB HL) FL
1.25 2.5 5 10 20 40 80 ×102 Frequency (Hz)
FL HTL NH cu 25
FL cu 25 FL UCL (f) −10 0 10 20 30 40 50 60 70 80 90 100 110 120 Sound le vel (dB HL) HA
1.25 2.5 5 10 20 40 80 ×102 Frequency (Hz)
HA HTL NH cu 25
HA cu 25 HA UCL (g) −10 0 10 20 30 40 50 60 70 80 90 100 110 120 Sound le vel (dB HL) LW
1.25 2.5 5 10 20 40 80 ×102 Frequency (Hz)
LW HTL NH cu 25
LW cu 25 LW UCL (h) −10 0 10 20 30 40 50 60 70 80 90 100 110 120 Sound le vel (dB HL) TE
1.25 2.5 5 10 20 40 80 ×102 Frequency (Hz)
TE HTL NH cu 25
TE cu 25 TE UCL (i)
Figure1: Audiograms showing air conduction hearing threshold (HTL) and uncomfortable level (UCL) of the subjects. Additionally, the sound level corresponding to medium perceived loudness (categorical unit 25—cu 25) is shown for each subject, and, for reference, also the mean sound levels for this loudness category in normal-hearing listeners (NH cu 25).
The data from the categorical loudness scaling mea-surements was used to individually fit the linear amplifica-tion and instantaneous compression schemes as described in Section 2.3.1.
2.2.2. Speech intelligibility
−10
0
10
20
30
40
50
60
70
80
90
100
110
120
Sound
le
vel
(dB
HL)
500 1000 2000 4000 8000
Frequency (Hz)
NH BH
cu 5
cu 15
cu 25
cu 35
cu 45
Figure2: Equal-loudness-level contours for subject BH from cate-gorical loudness scaling. For reference, the mean values for normal-hearing listeners are also shown.
quiet. The tests in the first session were performed unaided. Their purpose was to train the subjects on the intelligibility tests. Data were not evaluated.
In the second session, the subjects participated again in the one-syllable rhyme test in quiet and the Oldenburg sen-tence test in noise. No further training on the intelligibility tests was performed in the second session. For subjects BH, DF, and LW, dynamic compression was presented first, while for the other subjects, linear amplification was presented first. Preprocessed speech material from each of the two dif-ferent amplification schemes was used, thus simulating either a linear hearing aid or a hearing aid with instantaneous dy-namic compression. For the rhyme test, intelligibility in quiet was measured at several presentation levels in order to sam-ple several points on the intelligibility function (percentage of correct words as a function of presentation level). The jects were also asked for quality judgments and for their sub-jective preference regarding the speech material of the rhyme test processed with each amplification scheme. The questions asked were: “How would you describe the sound of this hear-ing aid simulation?” (free verbal description), “Would you accept this sound in hearing aids?” (yes/no), “Which hear-ing aid simulation do you prefer?” (first/second). The sen-tence test was performed in noise (speech simulating station-ary noise) at a presentation level of 65 dB SPL (input level, i.e., before amplification) and the speech reception thresh-old, that is, the SNR corresponding to 50% word intelligibil-ity, was measured.
Experimental details
To produce different SNRs, the presentation level of the speech was varied for the linear amplification scheme, while for the dynamic compression, the presentation level of the noise was varied. As confirmed in [20], this difference in pre-sentation mode does not influence the result of this sentence test for normal-hearing or hearing-impaired subjects.
The speech test material was processed offline for each subject. For the linear amplification, the processing was done for all signals separately at a fixed level. Signal configura-tion, that is, presentation level and SNR, was set afterwards by amplifying and/or mixing preprocessed speech and noise for each subject. In case of the instantaneous compression scheme, this procedure was not possible due to the nonlin-earity of the processing. In this case, mixtures of signals and noise at different SNRs and presentation levels needed to be preprocessed by the compressor. The sentence test material for the compression scheme was processed for a presentation level of 65 dB SPL input, with noise added at different lev-els. In this way, conditions with different SNRs were prepared with steps of 2.5 dB in SNR for the subjects AK, BE, and FL. For all other subjects, the step size was 1 dB. The speech ma-terial of the rhyme test was prepared at input presentation levels from 25 dB SPL to 75 dB SPL with steps of 10 dB for the subjects AK and FL. For all other subjects, including BE, input presentation levels of 15 dB SPL, 20 dB SPL, and 30 dB SPL were additionally prepared, since it became obvious that lower levels were needed. For each data point of the rhyme test, one test list consisting of 47 monosyllable words was presented with constant level. Level would be varied between lists to sample data points near and above 50% intelligibil-ity, thus the number of lists per subject varies. Not all pre-processed presentation levels were actually presented during measurements.
Gain selection ∗
ABS Gammatone
FB
Inverse gammatone
FB
Figure3: Block diagram illustrating the processing of speech data. The source signal is split into critical bands using a gammatone fil-terbank. In each band, instantaneous envelope compression is per-formed. A weighted sum, combined with different delays in differ-ent bands, is then used to resynthesize the signal.
A psychometric function was fitted to the data points, which was used to determine the SNR corresponding to 50% word intelligibility. The error of this procedure is also in the or-der of 0.5 dB [22]. According to [22], no systematic bias is introduced by the adaptive SNR variation. We may therefore assume that data from adaptive and nonadaptive procedures can be compared.
2.3. Algorithm
Amplification schemes were implemented using the algo-rithm sketched inFigure 3. The input signal was split into critical bands using the gammatone filterbank. In each filter-bank band, the signal was multiplied with a gain factor and then the subband signals were resynthesized. In the case of the linear amplification scheme, the gain factor was the same for all input levels; it only varied across frequency. For the dynamic compression, the gain factor varied with the input level and the filter’s center frequency. The calculation of the gain factor was implemented as follows. The instantaneous envelope of the signal was computed for each sample as the absolute value of the complex-valued output1of the respec-tive gammatone filter. The envelope value was then used to lookup the corresponding gain factor from a gain table (gain as a function of input level). The compression was thus
in-1The gammatone filters used here feature complex-valued filter coeffi -cients and provide complex-valued output which is, in the filter’s pass-band, a good approximation of the analytical signal [15]. The gammatone filters thus provide a causal, nonideal Hilbert transform.
stantaneous on the signal’s envelope in each band. The inher-ent time constant is equal to the filter ringing time. Instan-taneous envelope compression introduces fewer distortions than instantaneous waveform compression, since the signal’s envelope changes more slowly than the waveform itself. De-spite this, the distortions introduced by instantaneous enve-lope compression were clearly audible. The gammatone fil-terbank and the corresponding frequency resynthesis proce-dure were the same as in [15], except that they were adjusted to support a sound sampling rate of 44.1 kHz. The filterbank had 30 bands with center frequencies at 73.2, 107.7, 146.0, 188.7, 236.3, 289.4, 348.4, 414.2, 487.5, 569.1, 660.1, 761.4, 874.3, 1000, 1140, 1296, 1470, 1663, 1879, 2119, 2387, 2685, 3017, 3387, 3799, 4259, 4770, 5340, 5974, 6681 Hz.
2.3.1. Fitting of gaintables
Both amplification schemes were fitted with the objective of restoring loudness perception to that of a normal-hearing listener, using loudness functions derived from categorical loudness scaling. In order to individually fit the gain tables, the subject-specific loudness functions were compared with the mean loudness functions from normal-hearing listen-ers. For dynamic compression, the level difference between narrowband sounds evoking the same loudness perception in normal-hearing listeners and the hearing-impaired sub-ject was used as the gain factor for this level and frequency for dynamic compression. For the linear amplification, the gain factor is constant regardless of the sound level and was chosen to restore loudness perception for the loudness cate-gory “medium” (cu 25). Sound levels corresponding to this category for all subjects (measured in this study) and mean sound levels for normal-hearing listeners for this category (taken from [21]) are displayed within the audiogram plots ofFigure 1as dashed curves. The gains used for linear am-plification correspond to the level differences between these curves.
Because the center frequency of a gammatone filterbank band was usually between two frequencies of the loudness scaling, the gain factors for that frequency band were com-puted by first computing the gain factors at the adjacent fre-quencies where loudness scaling was performed. Then, the gain factors were interpolated to the center frequency of the filterbank band. The interpolation was linear on a logarith-mic frequency axis and on a logarithlogarith-mic gain scale. For fil-terbank bands with a center frequency outside the range of frequencies used in the categorical loudness scaling, the gain factors for the nearest loudness scaling frequency were used. For low input levels, that is, below 20 dB SPL in each sub-band, a noise gate was introduced. For 0 dB SPL input level, the output level was set to 0 dB SPL in each band. For 20 dB SPL input and above, the gain factor was deduced as previ-ously described. Between 0 dB and 20 dB SPL, the gain fac-tors were chosen to grow with a constant dB/dB rate so that the prescribed gain at 20 dB SPL input is reached.
2.4. Apparatus
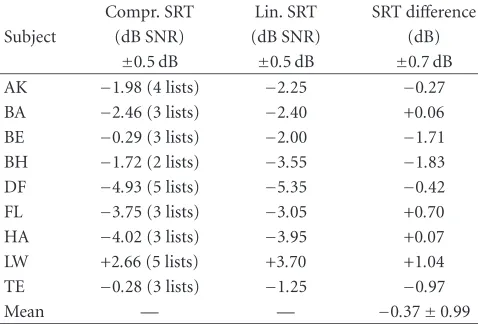
Table1: Speech reception thresholds (SRT) for the Oldenburg sen-tence tests. The signal-to-noise ratios (SNR) for 50% word intelligi-bility are shown for linear processing (mean result from 2 adaptive runs with test lists of 20 sentences each) and for the instantaneous dynamic compression, together with the number of test lists of 10 sentences used to sample points of the intelligibility function. The last column shows individual differences in SRT with the different processing schemes. The difference given here is positive if compres-sion resulted in a lower (better) SRT, and negative if linear process-ing resulted in a lower SRT. Given accuracies denote the accuracies of the procedures [22]. Accuracy of SRT difference stems from
er-ror propagation. Accuracy for mean SRT difference is the standard deviation.
Compr. SRT Lin. SRT SRT difference
Subject (dB SNR) (dB SNR) (dB)
±0.5 dB ±0.5 dB ±0.7 dB AK −1.98 (4 lists) −2.25 −0.27 BA −2.46 (3 lists) −2.40 +0.06 BE −0.29 (3 lists) −2.00 −1.71 BH −1.72 (2 lists) −3.55 −1.83 DF −4.93 (5 lists) −5.35 −0.42 FL −3.75 (3 lists) −3.05 +0.70 HA −4.02 (3 lists) −3.95 +0.07 LW +2.66 (5 lists) +3.70 +1.04 TE −0.28 (3 lists) −1.25 −0.97
Mean — — −0.37±0.99
categorical loudness scaling, Oldenburg sentence test, and one-syllable rhyme test were performed using a personal computer running self-developed audiological testing soft-ware. The sounds were presented using an RME DIGI96 sound card, an RME ADI-8 pro D/A converter, a Tucker-Davis HB7 headphone driver, and Sennheiser HDA200 head-phones.
Calibration was done using Br¨uel & Kjær equipment: Artificial ear 4153, 0.5-inch microphone 4192, microphone preamplifier 2669, and measuring amplifier 2610. For cali-bration of each intelligibility test, a speech-shaped station-ary noise was used which had the same long-term spectrum as the speech material of the respective test. The mean root-mean-square (RMS) of the speech material, without pauses at the beginning and the end of the sentences (sentence test) or words (rhyme test), was the same as the RMS of the noise used for calibration.
3. RESULTS
The SRT results of the Oldenburg sentence test in noise (50% word intelligibility) are shown inTable 1. For the dynamic compression scheme, the number of test lists used during measurements is also indicated. Subjects show a large in-terindividual variation in SRT between +2.7 dB SNR and
−4.9 dB SNR when using instantaneous dynamic compres-sion and between +3.7 dB SNR and−5.4 dB SNR for linear amplification. The reference value of normal-hearing
listen-ers is about−6.2 dB SNR [22]. This indicates a significantly reduced intelligibility in noise, which cannot be compensated by the amplification schemes employed. The difference in speech intelligibility thresholds resulting from both amplifi-cation schemes is given in the last column. A negative diff er-ence value indicates a lower threshold when the linear ampli-fication was used, and vice versa. The mean of the threshold differences between amplification schemes is−0.4 dB. The threshold differences between amplification schemes are not significant (paired t-test, df = 8, ˆt =1.12 < t8,0.05 = 2.31, p>0.05).
Asked for their subjective preference, subjects AK, BA, BH, FL, and TE expressed a strong preference for the linear amplification scheme over the instantaneous dynamic com-pression scheme and would not accept the instantaneous dy-namic compression scheme in hearing aids. Subjects BE, DF, HA, and LW had no preference for either scheme, and would accept both schemes in hearing aids. No subject preferred the instantaneous dynamic compression scheme.
Figure 4shows results from the one-syllable rhyme test in quiet for linear amplification and for instantaneous dynamic compression. Data show the intelligibility, in percentage, of correct words over the presentation level. Triangles show the data for instantaneous compression, and circles show the data for linear amplification. All intelligibility data are de-picted twice in each subfigure. The curves are plotted as func-tions of input sound levels (open symbols), and additionally as functions of output sound levels (closed symbols), that is, the mean presentation level of a list after either linear am-plification or instantaneous dynamic compression have been applied to the speech material. Vertical error bars denote the accuracy of the intelligibility measurement with a rhyme test list of 47 words (Bernoulli experiment with n = 47 trials, σp =
p(1−p)/n, cf. [22]). Horizontal error bars show the standard deviation of the gains (broadband) applied to indi-vidual words of the rhyme test. These gains were computed by comparing the RMS values of the rhyme test words before and after amplification.
100 90 80 70 60 50 40 30 20 W o rd int ellig ibilit y (%) AK
20 30 40 50 60 70 80 90 Sound pressure level (dB SPL)
Compr. in Linear in Compr. out Linear out (a) 100 90 80 70 60 50 40 30 20 W o rd int ellig ibilit y (%) BA
20 30 40 50 60 70 80 90 Sound pressure level (dB SPL)
Compr. in Linear in Compr. out Linear out (b) 100 90 80 70 60 50 40 30 20 W o rd int ellig ibilit y (%) BE
20 30 40 50 60 70 80 90 Sound pressure level (dB SPL)
Compr. in Linear in Compr. out Linear out (c) 100 90 80 70 60 50 40 30 20 W o rd int ellig ibilit y (%) BH
20 30 40 50 60 70 80 90 Sound pressure level (dB SPL)
Compr. in Linear in Compr. out Linear out (d) 100 90 80 70 60 50 40 30 20 W o rd int ellig ibilit y (%) DF
20 30 40 50 60 70 80 90 Sound pressure level (dB SPL)
Compr. in Linear in Compr. out Linear out (e) 100 90 80 70 60 50 40 30 20 W o rd int ellig ibilit y (%) FL
20 30 40 50 60 70 80 90 Sound pressure level (dB SPL)
Compr. in Linear in Compr. out Linear out (f) 100 90 80 70 60 50 40 30 20 W o rd int ellig ibilit y (%) HA
20 30 40 50 60 70 80 90 Sound pressure level (dB SPL)
Compr. in Linear in Compr. out Linear out (g) 100 90 80 70 60 50 40 30 20 W o rd int ellig ibilit y (%) LW
20 30 40 50 60 70 80 90 Sound pressure level (dB SPL)
Compr. in Linear in Compr. out Linear out (h) 100 90 80 70 60 50 40 30 20 W o rd int ellig ibilit y (%) TE
20 30 40 50 60 70 80 90 Sound pressure level (dB SPL)
Compr. in Linear in
Compr. out Linear out
(i)
Figure4: Results of the intelligibility test in quiet for all subjects. Diagrams show the percentage of correct words as a function of the presentation level. Triangles show the data of the instantaneous compression, and circles show the data of the linear amplification scheme. Open symbols refer to the input level of the amplification systems, whereas closed symbols refer to the respective output levels. Vertical error bars denote the accuracy of the test for one list, while horizontal error bars show the standard deviation of the average gains applied to individual words of the rhyme test.
Although presentation levels were generally not high enough to reach 100% intelligibility for every subject, results do not indicate increased discrimination loss with either am-plification scheme.
4. DISCUSSION
The data from the Oldenburg sentence test in noise ex-hibit a slightly lower speech intelligibility threshold for linear amplification than for instantaneous dynamic compression. The mean difference in thresholds between both schemes is
0.4 dB, which was found not significant. Because the exposi-tion to the (unfamiliar) instantaneous compression was only short, we expect to see acclimatization effects in speech in-telligibility for longer exposition times [23]. Whether these effects exceed the acclimatization effects for the linear ampli-fication is not clear, though.
18
16
14
12
10
8
6
4
2
0
Gain
di
ff
er
enc
e
(dB)
125 250 500 1000 2000 4000
Frequency (Hz)
Gain difference
Figure5: Gain differences seen in the sentence test between ampli-fication schemes for−2 dB SNR, averaged over all subjects in third-octave bands. Positive gain difference means that dynamic compres-sion provided higher gain.
To determine whether the fittings used for the different amplification schemes for the sentence test in noise were comparable, we compare average gain factors resulting from both schemes. Figure 5 shows average gain differences be-tween amplification schemes in dB for different frequencies, computed for a typical SNR of−2 dB, that is, a speech level of 65 dB SPL and a noise level of 67 dB SPL. To obtain aver-age gain differences between amplification schemes, intensity spectra of the output signals of a complete test list (10 sen-tences) were summed over third-octave bands, then divided and thereafter averaged over subjects (mean on a dB scale). The dynamic compression exhibits 2–7 dB higher gains at frequencies relevant for speech intelligibility. In the range of presentation levels used here, the SRT is independent of level [20], thus the comparison made here is reasonable.
Four subjects did not perceive any quality difference be-tween amplification schemes, whereas five subjects clearly perceived the apparent distortion introduced by instanta-neous compression. It is unclear whether perceived quality difference could diminish by acclimatization. The audiologi-cal data also do not provide evidence, why some subjects did perceive quality differences and other subjects with similar hearing loss did not. The obvious assumption that subjects with high speech reception thresholds in noise should also have difficulties to perceive distortions is not confirmed by the data. Quality factors thus seem to be largely indepen-dent of speech intelligibility and should be further investi-gated.
For the rhyme test in quiet, the similarity of the intel-ligibility curves with respect to output levels for subjects
LW and TE suggests that these subjects can make use of the gains from linear amplification and from instantaneous dy-namic compression with equal effectivity, and are not ob-structed by the distortions introduced by the nonlinearity of the dynamic compression scheme. For subjects AK, BH, and HA, the intelligibility curves for the dynamic compres-sion scheme exhibit, for low input levels, lower intelligibil-ity for the dynamic compression scheme than for linear am-plification. This relation is reversed for higher input levels. It is possible that the expansion that was introduced in the dynamic compression scheme for low input levels plays a role in this effect and that the subjects would have had bet-ter intelligibility results in these cases without expansion. In subject BA, the output level difference between linear and compression schemes at the same intelligibility is about 12 dB, indicating that the subject cannot exploit the addi-tional gain provided by instantaneous compression at all. The reason for this result might be that gain is mainly pro-vided outside the main frequency range of speech due to the unusual hearing loss of this subject. In this case, compres-sion increases the broadband output level, but does not in-crease audibility of relevant speech segments. Further anal-ysis of this assumption could be carried out by narrow-band output level analysis in combination with speech-based frequency band importance weighting. This is not pursued here because of the clear-cut results found in the other sub-jects.
The aim of the fitting of the linear amplification was to restore loudness perception for medium loudness. However, the presentation levels used during the rhyme test in quiet were well below this category most of the time. This might raise the question as to whether the comparison between in-stantaneous dynamic compression and linear amplification was fair after all, since dynamic compression uses higher gains at lower levels. Even when comparing speech intelli-gibility at the same output level of both processing schemes, as was done here, the frequency shape of the output signals will be different, and part of the speech spectrum was most likely inaudible with linear amplification for low presenta-tion levels. One could assume that the similarity of the re-sults that we observe would stem from a tradeoffbetween in-audibility for linear amplification and distortions for instan-taneous dynamic compression. But if audibility of these parts of the spectrum played a role, we would expect to see an ad-vantage for linear amplification over instantaneous dynamic compression with increased level, where audibility is assured, but distortions are still present. Since we do not see such an advantage for linear amplification for high levels in the re-sults, we may assume that the audibility question for linear amplification plays only a minor role in this setup. Regard-less of the audibility question, results show that the distor-tions do not lead to a discrimination loss. However, further studies should use a linear reference response which is ad-justed to the average response of the compression system for each specific condition and level, similar to what was done post hoc inFigure 5.
methods to further reduce apparent distortions should be further investigated. One possibility is to restrict the band-width of the compressed subband signals to the respective frequency band before resynthesis, as it is done in [14]. This postfiltering attenuates distortion components outside the frequency band in which they are generated and thus should lead to less audible distortions.
Gain characteristics were individually fitted to normal-ize loudness in this study. Other fitting rationales, for exam-ple, loudness equalization or SNR maximization, might lead to a slightly different absolute performance of the amplifica-tion schemes. However, the main finding of this study, that is, that instantaneous compression performs as good as lin-ear amplification regarding speech intelligibility despite the distortions and the modulation reductions, is likely to be not altered when varying the fitting rationale.
Speech reception thresholds in noise were found to be higher in normal-hearing listeners than in all hearing-impaired subjects, which confirms other studies on speech reception in noise conditions in the hearing-impaired. De-graded speech reception in speech-simulating noise is gener-ally attributed to loss of frequency selectivity and increased internal noise in the impaired auditory system. It can be as-sumed that this type of information loss cannot be compen-sated for by amplification or compression, which is the con-sequence of the fact that the combination of two nonlinear systems generally cannot be made equivalent to another non-linear system, that is, the healthy cochlea. This stresses the ne-cessity of combining proper amplification schemes and true SNR improvement by noise reduction when pursuing full re-habilitation of hearing impairment.
5. CONCLUSION
Sentence intelligibility tests performed with nine sensorineu-ral hearing-impaired subjects showed that instantaneous dy-namic compression has no effect on speech intelligibility in noise, when compared to reasonably well-fitted linear ampli-fication.
Word intelligibility tests in quiet showed that, compared to a linear amplification system, additional amplification provided by instantaneous compression can be exploited and turned into increased speech intelligibility by the subject.
Distortions introduced by instantaneous compression have a negative impact on acceptance, but not on intelligi-bility.
ACKNOWLEDGMENTS
We thank Birger Kollmeier for his continuous support and all the members of the working group Medizinische Physik for fruitful discussions. We especially thank T. Brand, D. Berg, and K. Wagener for their help with the audiometric testing setup. We also thank three anonymous reviewers for helpful comments on earlier versions of the manuscript. This work is supported by the centre of excellence on hearing aid tech-nology (BMBF 01EZ0212).
REFERENCES
[1] H. Dillon, Hearing Aids, Thieme Medical Publishers, New York, NY, USA, 2001.
[2] R. Plomp, “The negative effect of amplitude compression in multichannel hearing aids in the light of the modulation-transfer function,”Journal of the Acoustical Society of America, vol. 83, no. 6, pp. 2322–2327, 1988.
[3] I. V. N´abˇelek, “Performance of hearing-impaired listeners un-der various types of amplitude compression,”Journal of the
Acoustical Society of America, vol. 74, no. 3, pp. 776–791, 1983.
[4] G. Walker, D. Byrne, and H. Dillon, “The effects of multichan-nel compression/expansion amplification on the intelligibility of nonsense syllables in noise,”Journal of the Acoustical Society
of America, vol. 76, no. 3, pp. 746–757, 1984.
[5] V. Hohmann and B. Kollmeier, “The effect of multichannel dynamic compression on speech intelligibility,”Journal of the
Acoustical Society of America, vol. 97, no. 2, pp. 1191–1195,
1995.
[6] J. Verschure, E. J. Benning, M. Van Cappellen, W. A. Dreschler, and P. P. Boeremans, “Speech intelligibility in noise with fast compression hearing aids,”Audiology, vol. 37, no. 3, pp. 127– 150, 1998.
[7] B. C. J. Moore, R. W. Peters, and M. A. Stone, “Benefits of lin-ear amplification and multichannel compression for speech comprehension in backgrounds with spectral and temporal dips,”Journal of the Acoustical Society of America, vol. 105, no. 1, pp. 400–411, 1999.
[8] M. Hansen, “Effects of multi-channel compression time con-stants on subjectively perceived sound quality and speech in-telligibility,” Ear and Hearing, vol. 23, no. 4, pp. 369–380, 2002.
[9] M. A. Stone and B. C. J. Moore, “Effects of the speed of a single-channel dynamic range compressor on intelligibility in a competing speech task,”Journal of the Acoustical Society of
America, vol. 114, no. 2, pp. 1023–1034, 2002.
[10] ANSI S3.5—1997, “Methods for the calculation of the speech intelligibility index,” American National Standards Institute, New York, NY, USA, 1997.
[11] L. Hickson and D. Byrne, “Consonant perception in quiet: ef-fect of increasing the consonant-vowel ratio with compression amplification,”Journal of the American Academy of Audiology, vol. 8, no. 5, pp. 322–332, 1997.
[12] B. C. J. Moore,Perceptual Consequences of Cochlear Damage, Oxford University Press, Oxford, UK, 1995.
[13] K. Kaneko, K. Shoji, H. Kojima, et al., “Nonlinear digital hear-ing aid with near-instantaneous amplitude compression,”
Eu-ropean Archives of Oto-Rhino-Laryngology, vol. 258, no. 10,
pp. 523–528, 2001.
[14] J. L. Goldstein, M. Oz, P. Gilchrist, and M. Valente, “Signal processing strategies and clinical outcomes for gain and wave-form compression in hearing aids,” inProc. 37th IEEE
Asilo-mar Conference on Signals, Systems, and Computers, pp. 391–
398, Pacific Grove, Calif, USA, November 2003.
[15] V. Hohmann, “Frequency analysis and synthesis using a Gam-matone filterbank,” Acustica / acta acustica, vol. 88, no. 3, pp. 433–442, 2002.
[16] C. Gigu`ere and G. F. Smoorenburg, “Computational Mod-eling of outer haircell damage: implications for hearing and signal processing,” inPsychophysics, Physiology, and Models of
Hearing, T. Dau, V. Hohmann, and B. Kollmeier, Eds., pp.
155–164, World Scientific, Singapore, 1999.
[17] T. Brand and V. Hohmann, “An adaptive procedure for cat-egorical loudness scaling,”Journal of the Acoustical Society of
[18] K. Wagener, T. Brand, and B. Kollmeier, “Development and evaluation of a German sentence test,” inContributions to Psy-chological Acoustics - 8th Oldenburg Symposium on
Psycholog-ical Acoustics, pp. 439–466, bis-Verlag, Oldenburg, Germany,
2000.
[19] E. L. v. Wallenberg and B. Kollmeier, “Sprachverst¨and-lichkeitsmessungen f¨ur die Audiologie mit einem Reimtest in deutscher Sprache: Erstellung und Evaluation von Testlisten,”
Audiologische Akustik, vol. 28, no. 2, pp. 50–65, 1989.
[20] K. C. Wagener and T. Brand, “Sentence intelligibility in noise for listeners with normal hearing and hearing impairment: in-fluence of measurement procedure and masking parameters,”
International Journal of Audiology, vol. 44, no. 3, pp. 144–156,
2005.
[21] B. Kollmeier,H¨orfl¨achenskalierung - Grundlagen und Anwen-dungen der kategorialen Lautheitsskalierung f¨ur H¨ordiagnostik
und H¨orger¨ateversorgung, Median-Verlag, Heidelberg,
Ger-many, 1997.
[22] T. Brand and B. Kollmeier, “Efficient adaptive procedures for threshold and concurrent slope estimates for psychophysics and speech intelligibility tests,”Journal of the Acoustical Society
of America, vol. 111, no. 6, pp. 2801–2810, 2002.
[23] S. Gatehouse, “The time course and magnitude of percep-tual acclimatization to frequency responses: Evidence from monaural fitting of hearing aids,”Journal of the Acoustical
So-ciety of America, vol. 92, no. 3, pp. 1258–1268, 1992.
Tobias Herzkereceived his Physics degree (Dipl.-Phys.) from the University of Olden-burg, Germany, in 2003. Since 2003, he has been a faculty member of the Institute of Physics at the University of Oldenburg, Ger-many, and member of the Medical Physics Group (Prof. Dr. Dr. B. Kollmeier), where he works on the development, implementa-tion, and evaluation of different signal pro-cessing algorithms for hearing aids.
Volker Hohmannreceived the Physics de-gree (Dipl.-Phys.) and the Doctorate in physics (Dr. rer. nat.) from the University of G¨ottingen, G¨ottingen, Germany, in 1989 and 1993, respectively. Since 1993, he has been a faculty member of the Institute of Physics at the University of Oldenburg, Ger-many, and member of the Medical Physics Group (Prof. Dr. Dr. B. Kollmeier), teach-ing activities in physics for undergraduate