University of South Carolina
Scholar Commons
Theses and Dissertations
Fall 2018
Characterization of the Spatial and Temporal
Changes in River Geometry and Sand Load with
Field Data Analysis and 1D Numerical Modeling
Zeyad Ayoob SulaimanFollow this and additional works at:https://scholarcommons.sc.edu/etd
Part of theCivil Engineering Commons
This Open Access Dissertation is brought to you by Scholar Commons. It has been accepted for inclusion in Theses and Dissertations by an authorized administrator of Scholar Commons. For more information, please [email protected].
Recommended Citation
C
HARACTERIZATION OF THE SPATIAL AND TEMPORAL CHANGES IN RIVER GEOMETRY AND SAND LOAD WITH FIELD DATA ANALYSISAND
1
D NUMERICAL MODELINGby
Zeyad Ayoob Sulaiman
Bachelor of Water Resources Engineering University of Mosul, 2004
Master of Irrigation & Drainage Engineering University of Mosul, 2007
Submitted in Partial Fulfillment of the Requirements
For the Degree of Doctor of Philosophy in
Civil Engineering
College of Engineering and Computing
University of South Carolina
2018
Accepted by:
Enrica Viparelli, Major Professor
Raymond Torres, Major Professor
Jasim Imran, Committee Member
Shamia Hoque, Committee Member
DEDICATION
To my parents
My beloved wife and sibling
And all my teachers and friends
ACKNOWLEDGEMENTS
I would like to express my sincere gratitude to my dissertation advisor Dr. Enrica Viparelli
and Prof. Raymond Torres for their great support and encouragement throughout my
doctoral study on the scientific and personal level. Without their advice and persistent help,
this dissertation would not have been possible. I would like to extend my gratitude to my
dissertation committee members Prof. Jasim Imran and Dr. Shamia Hoque for their
guidance and discussion. Also, I would like to thank Prof. M. Hanif Chaudhary for his
invaluable suggestions during water resources group meetings.
I gratefully acknowledge the financial support provided by the Iraqi Ministry of
Higher Education and Scientific Research for covering all tuitions of my study at the
University of South Carolina. I owe my appreciation to my professors and colleagues at
the University of Mosul and the Iraqi Cultural Office at Washington DC for their
continuous encouragement during the course of my study. Special thanks to Dr. Basim M.
Al-Zaidifor his cooperation. Many thanks to my former and current colleagues in the water
resources group for their friendship and sharing ideas. Thank you Mrs. Karen Ammeral for
your kindness secretarial services.
No words can describe my deepest gratitude to my father, mother, sisters and
brothers for being always with me and for me. From deep in my heart where she is, I would
love to express my heartful thanks to my wife Nabaa for her patience, support and
ABSTRACT
The quantification of the changes in channel geometry and sand load that have occurred on
the Missouri River after engineering works and that characterize the Altamaha River in the
fluvial-tidal transition zone is the main objective of this research. Dam construction and
channelization on the Missouri River resulted in flow regulation, sediment shortage by dam
reservoir trapping, channel straightening and narrowing. Quantifying the morphodynamic
response of the Lower Missouri River to these engineering projects at short and long-time
scales is a difficult problem that we approach with the analysis of the available field data
and with the aid of a one-dimensional morphodynamic model. The results show that the
peak discharge and suspended sand load have reduced remarkably downstream of Gavins
Point Dam, i.e. the lowermost dam on the Missouri River mainstem, and have recovered
gradually to pre-dam levels downstream of the junctions with major tributaries. The
analysis of mean daily flows reveals no observable change in high flow magnitude and
frequency downstream of the Missouri River – Grand River confluence. Model results
show no significant change in mean annual sand load in the downstream-most part of the
study reach for short and long-term simulations. Recent studies on river morphology in the
fluvial tidal transition zone show significant changes in channel geometry and sediment
size over relatively short distances with the cross-sectional area and the sediment size
decreasing the oceanward direction. The collection and analysis of field data in the
the characteristics and causes of these spatial changes. Stream power and Shields number
were used to explain the observed changes, which occur over a distance ranging from 1 to
4 km. The analysis showed a sharp decline in stream power and Shields number at the
boundary between the fluvial and tidal dominated reaches. This decline is thought to be
TABLE OF CONTENTS
DEDICATION ... iii
ACKNOWLEDGEMENTS ... iv
ABSTRACT ... v
LIST OF TABLES ... ix
LIST OF FIGURES ... x
LIST OF SYMBOLS ... xiii
CHAPTER 1 : INTRODUCTION ... 1
1.1 IMPACT OF FLOW REGULATION AND RIVER MODIFICATION ON RIVER MORPHOLOGY AND HYDROLOGY ... 2
1.2 IMPACT OF TIDAL OSCILLATIONS ON CHANNEL MORPHOLOGY ... 4
1.3 RESEARCH OBJECTIVES ... 5
CHAPTER 2: NUMERICAL SIMULATION OF MISSOURI RIVER BED EVOLUTION AND SAND LOAD DOWNSTREAM OF GAVINS POINT DAM ... 9
2.1 INTRODUCTION ... 9
2.2 THE LOWER MISSOURI RIVER ... 12
2.3 MODEL FORMULATION ... 19
2.4 NUMERICAL IMPLEMENTATION AND BOUNDARY CONDITIONS ... 25
2.5 PRE-DAM MODEL ZEROING ... 28
2.6 POST-DAM SIMULATIONS ... 30
CHAPTER 3: THE FLUVIAL-TIDAL TRANSITION ZONE OF A COASTAL PLAIN
RIVER ... 71
3.1 INTRODUCTION ... 71
3.2 STUDY SITE ... 73
3.3 DATA AND METHODS ... 75
3.4 RESULTS ... 79
3.5 DISCUSSION ... 87
3.6 CONCLUSIONS ... 92
CHAPTER 4: SUMMARY AND CONCLUSIONS ... 104
4.1 CHANGES IN RIVER MORPHOLOGY AND HYDROLOGY DUE TO IMPACT OF DAM CONSTRUCTION AND CHANNEL MODIFICATION: CASE STUDY OF THE LOWER MISSOURI RIVER, USA ... 104
4.2 CHANGES IN CHANNEL MORPHOLOGY AND SEDIMENT CHARACTERISTICS ACROSS A FLUVIAL TIDAL TRANSITION ZONE: CASE STUDY OF THE ALTAMAHA RIVER, USA ... 107
REFERENCES ... 111
LIST OF TABLES
Table 2.1: Major Lower Missouri River Tributaries. ... 49
Table 2.2: U.S Geological Survey (USGS) Gaging Stations in the Lower Missouri River considered in this study. ... 49
Table 2.3: Pre- and Post-dam Mean Annual Suspended Sand Load in the Lower Missouri River. The asterisks identify measurements for which the volume fraction content of sand was not recorded... 50
Table 2.4: Pre- and Post-dam Mean Annual Suspended Sand Load in the Lower Missouri River main Tributaries. The asterisks identify measurements for which the volume fraction content of sand was not recorded . Also, the number with asterisks means the number of measurements belongs to the period of record that has also asterisked. All number of measurements regardless with asterisks or not are used in the calculations of the mean annual suspended sand load. ... 51
Table 2.5: Model input parameters for the zeroing runs. ... 52
Table 3.1: Coverage of field work data used in this paper. ... 93
Table 3.2: Maximum and minimum tidal ranges with their corresponding discharges.... 93
Table 3.3: Statistical summary of the unit stream power estimates. ... 94
Table 3.4: Statistical summary of the Shields number. ... 94
LIST OF FIGURES
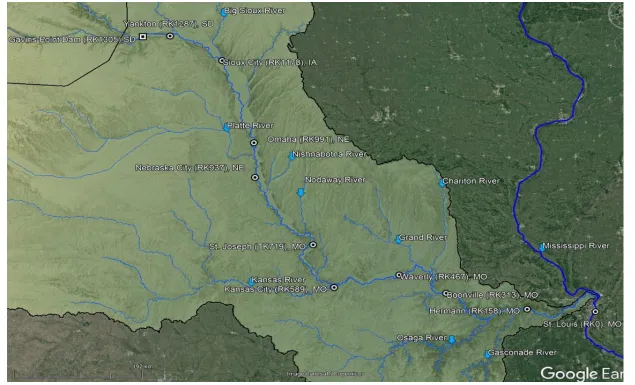
Figure 2.1: The Lower Missouri River, its main tributaries (blue arrows) and the USGS stations used in this study (dots) (from USGS, google earth and GIS) ... 53
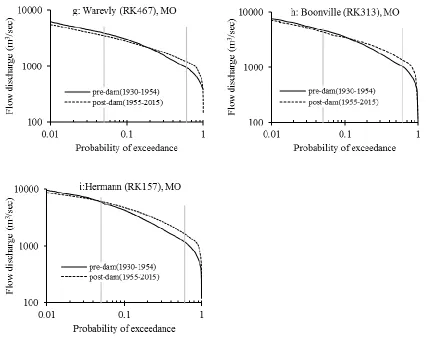
Figure 2.2: pre-dam and post-dam flow duration curves for selected USGS gage stations at Lower Missouri mainstem. Continuous horizontal gray lines represent probabilities of exceedance are equal to 0.05 and 0.6... 55
Figure 2.3: pre-dam (1930-1954) and 20 year-long period post-dam flow duration curves for Lower Missouri River at the USGS gage stations of Table 2.2. the continuous gray and black lines represent the pre-dam 1995-974 periods respectively. The continuous dashed and dotted black lines represent the post-dam periods between 1975 and 1994 and between 1995 and 2015 respectively. Continuous horizontal gray lines represent probabilities of exceedance are equal to 0.05 and 0.6. In subfigure a, there is a gap in data from 1996 to 2016, therefore, data of 1995, 2017, and 2018 are used as a post-dam (1995-2015). ... 57
Figure 2.4: Schematic representation of the study reach. Gray and orange arrows represent the flow and sediment load inputs at computational nodes respectively, and green dots represent the U. S Geological Survey gage stations that used to validate the model sand load predictions. ... 58
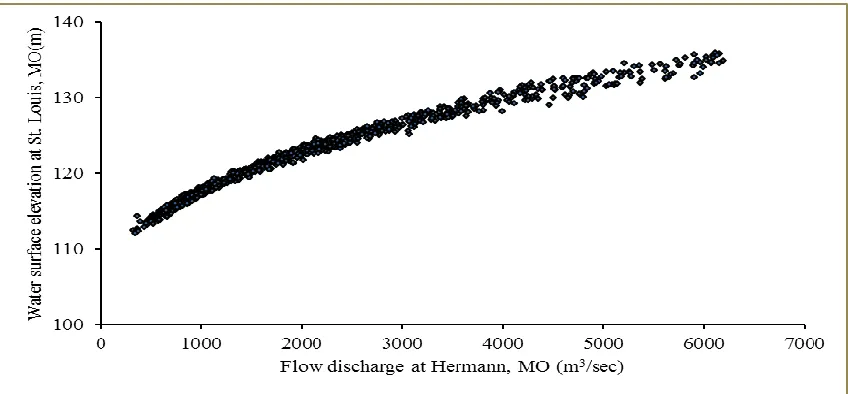
Figure 2.5: Relationship between water surface elevation above NAVDD88 at St. Louis, MO and flow discharge at Hermann, MO at the confluence of Missouri-Mississippi River system. ... 58
Figure 2.6: Comparison between numerical and measured (black square and cross dots) average channel bed elevation above NAVDD88 at mobile bed equilibrium. The numerical channel bed elevation with present of tributaries is represented by a continuous black line and dashed black line for numerical bed elevation with no including tributaries. A gray dash line represents the locations of tributaries. The black square dots are measurements of thalweg elevation in 1954 reported by the USACE (U.S Army Corps of Engineers: Omaha District, 1993) and the black cross dots are thalweg elevation measurements in 1952 reported by the USACE (U.S Army Corps of Engineers, 2012). ... 59
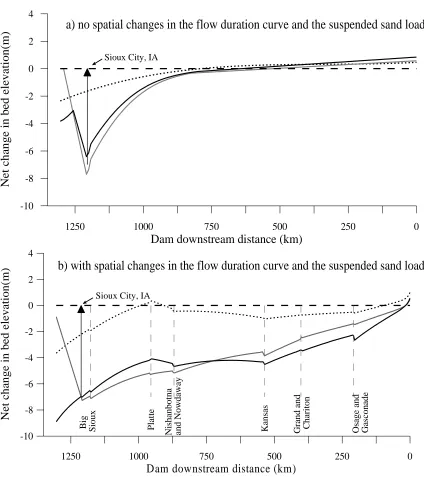
Figure 2.8: Long term changes in channel bed elevation associated with the closure of Gavins Point Dam (dash line), channel narrowing (grey line), and dam closure associated with channel narrowing (continuous black line). The vertical gray line represents the location of the main tributaries and horizontal continues dashed line represents the condition of no net change in channel bed elevation. The vertical arrow refers to the most upstream of the channelized portion of the Lower Missouri River at Sioux City, IA. The results in panel (a) pertain to simulations in which the flow duration curve and the sand load were specified at the upstream end of the modeled reach. The results of the panel (b) accounted for changes in flow duration curve and sand load downstream of the confluences with major tributaries. ... 62
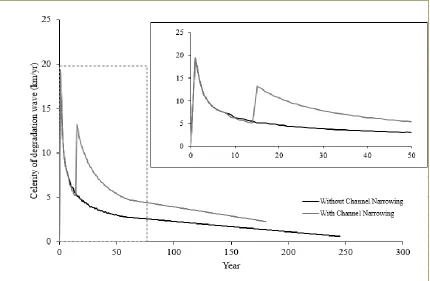
Figure 2.9: Celerity of the wave of degradation in the case of dam closure (black line) and dam closure associated with channel narrowing (grey line). ... 63
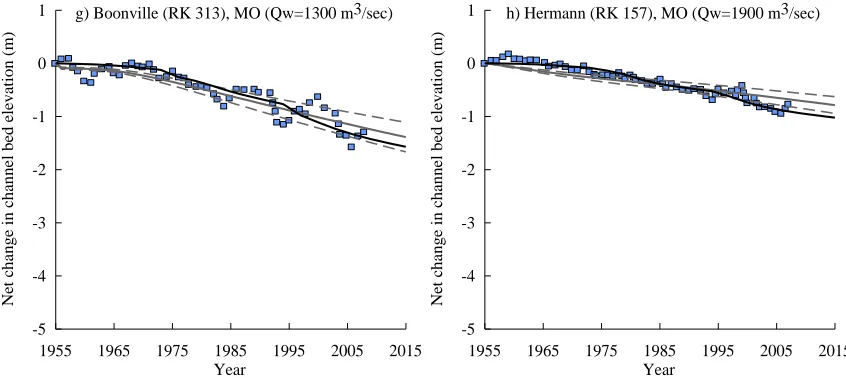
Figure 2.10: Comparison between numerical (lines) and measured (blue square) for net change in channel bed elevation along the modeled reach. The continuous gray and black lines respectively represent the model results obtained with a single post-dam flow duration curve, and three flow duration curves are describing 20 year-long post-dam time intervals. The continues dashed gray lines indicate the ±20% of the value predicted with a single post-dam flow duration curve (continuous grey line). ... 65
Figure 2.11: measured (blue triangles) and predicted (black dots) suspended sand loads. The error bars represent a ±15% difference from the numerical value. ... 69
Figure 2.12: Pre- and post-dam mean annual sand load. Field estimates and model results are respectively represented with colored bar and black dots. The error bars indicate ±15% of the numerical value. ... 70
Figure 2.13: Long term prediction of the ratio between the post-dam and the pre-dam suspended sand load at Hermann, MO. ... 70
Figure 3.1: The main stem of the lower Altamaha River. The U.S. Geological Survey (USGS) gauging station (USGS ID:02226160, Altamaha River near Everett City, 31º25ʹ37ʺ N, 81º36ʹ20ʺW) is on a bridge pier at km41 from the river mouth. ... 95
Figure 3.2: Flow discharge duration curve of the Altamaha River for available mean daily recorded data (2008-2017). ... 96
Figure 3.4: Water surface slope at four subreaches between km56 and km36 S1, S2, S3
and S4 respectively represent water surface slopes between km56-km51,
km51-km45, km45-km41 and km41-km36. ... 98
Figure 3.5: Along-channel variations in channel bed elevation and sinuosity. A- Main axis is the riverbed long profile elevation (black points) as a function of the along-channel distance. Secondary axis (inset) is the 3km running average long profile standard deviation. The cross sign is used to identify the location of the bridge. B- 2km average sinuosity (black points) along the study reach. Sinuosity here is used to describe the meandering of the study reach and defined as a ratio of channel length measured between two points along the river to straight-line length between the two selected points. ... 99
Figure 3.6: A long-channel variation in: A- Channel width w, B- The cross-section area A, C- Hydraulic radius Rh and D- Width to depth ratio w/d. ... 101
Figure 3.7: Downstream change in median grain size distribution along the study reach. Positive and negative errors bars represent D90 and D10 respectively. ... 102
Figure 3.8: Cross-sectional stream power per unit channel width at five sites between km56 and km36. ... 103
Figure 3.9: Shields number estimates at five sites between km56 and km36. ... 103
Figure A.1: Pre- and post-dam suspended sediment concentration rating curve of Missouri River at Hermann (RK 157), MO. ... 132
Figure A.2: Pre- and post-dam suspended sediment concentration rating curve of Missouri River at Kansas City (RK 589), MO. ... 132
Figure A.3: Pre- and post-dam suspended sediment concentration rating curve of Missouri River at St. Joseph (RK 719), MO. ... 133
Figure A.4: Pre- and post-dam suspended sediment concentration rating curve of Missouri River at Omaha (RK 991), NE. ... 133
LIST OF SYMBOLS
B coefficient of the entrainment relation (1);
Bc channel width (L);
Cf friction coefficient (1);
C5 near-bed volumetric suspended sediment concentration averaged over turbulence at a distance zb from the channel bed equal to 0.05H (1);
D geometric mean diameter (L);
D90 grain diameter such that 90% of the bed material is finer (L);
E total energy (L);
Eb non-dimensional entrainment rate of sediment in suspension (1);
Fr Froude Number (1);
g acceleration of gravity (LT-2);
H cross-sectionally averaged flow depth (L);
Hs cross-sectionally averaged flow depth associated with skin friction (L);
kc composite roughness height associated with flow resistances associated with skin friction and form drag (1);
ks roughness height associated with skin friction (1);
N number of characteristics discharges bin in the flow duration curve (1);
pi average fraction of the year in which the flow was equal to characteristic discharge(1);
q volumetric flow rate per unit channel width (L2/T);
Qbm total volumetric bed material transport capacity (L3/T);
Qbm,b volumetric bedload transport capacity (L3/T);
Qbm,s volumetric suspended bed material (L3/T);
Qs suspended sand transport capacity (L3/T);
Q water discharge (L3/T);
R submerged specific gravity of the bed material (1);
Rp particle Reynolds number (1);
S channel bed slope (1);
Sf friction slope (1);
t temporal coordinate (T);
U depth-averaged flow velocity (L/T);
𝑢∗𝑠 shear velocity associated with skin friction (L/T);
vs particle settling velocity (L/T);
x downchannel coordinate (L);
X non-dimensional entrainment parameter of sediment (1);
𝑍𝑟 Rouse number (1);
⍺ parameter that accounts for stratification effects associated with suspended sediment transport (1);
η channel bed elevation (L);
ηi channel bed elevation at the downstream end of the modeled reach (L);
κ Von Karman constant (1);
λp bulk porosity of bed (1);
v kinematic viscosity of water (L2 T-1);
ξ water surface elevation (L);
ρ water density (M L-3);
ρs sediment density (M L-3);
τ bed shear stress (M L-1 T-2);
τ* Shields number (1);
τ*
s Shields number associated with skin friction (1);
CHAPTER 1
INTRODUCTION
Rivers transport water and sediment from continents to the ocean. Depending on the
system slope, the flow regime, the sediment supply and the sediment characteristics, river
morphology varies, adjusts, and adapts over multiple spatial and temporal scales (Leopold
and Maddock, 1953; Julien and Wargadalam, 1995). Natural and anthropogenic events
may induce changes in hydrology, sediment load and/or caliber that induce changes in river
shape and form (Lane, 1937; Mackin, 1948; Gurnell, 1997; Schumm, 1968; Church, 1995).
Rivers respond to natural and human-induced changes with a series of channel
adjustments, e.g. changes in channel geometry and morphology, in slope or in channel
pattern (Lane, 1955; Simon, 1989; Ortega et al., 2014; Boix-Fayos, 2007; Gregory, 2006;
Lane et al., 2007). Examples of anthropogenic activities that result in changes in river
characteristics include changes in land use, flow regulation, river engineering works. The
adjustments to these activities are generally confined within the watershed and its river
network. Natural conditions that can control channel shapes and processes include changes
in flow characteristics due to e.g. the interaction between unidirectional river flows and
bidirectional tidal currents or the confluence with a major tributary (Gurnell, 1997),
changes in climate and sea level. The response to these factors varies over temporal scales
that are much longer than those characterizing the response of a river reach to human
River adjustments to natural and anthropogenic forcing occur at different spatial
and temporal scales. Small scale adjustments can be associated with changes in channel
characteristics such as the changes in grain size distribution, channel width, and channel
depth. The large scale response of a river can be characterized by changes in channel
pattern, reach morphology and slope, and usually reflects the cumulative effect small scale
processes (Church, 1995; Buffington, 2012).
The research work presented in this dissertation focuses on the response of the
Missouri River to flow regulation and channel narrowing-straightening, and on the impacts
that the interaction between river flow and tidal oscillations have on river morphology in
the fluvial-tidal transition zone of the Altamaha River.
1.1IMPACT OF FLOW REGULATION AND RIVER MODIFICATION ON RIVER
MORPHOLOGY AND HYDROLOGY
More than 40,000 dams higher than 15 m have been built around the world for e.g. flood
control, hydropower generation, navigation control, irrigation, industrial development,
municipal water supply and sediment control (ICOLD, 1988). Further, river engineering
works such as channel stabilization and straightening associated with the construction of
dikes and other structures are realized for e.g. flood control, navigation, and prevention of
bank erosion (Horsak et al., 2009; Painter and Heine, 2005).
With the increasing number of dam projects and river engineering works, the
awareness of the impacts that these projects have on natural systems has grown as well.
Thereby, the characterization of the impacts of imposed changes in flow regime, sediment
attention last few decades (Williams and Wolman, 1984; Brandt, 2000; Benn and Erskine,
1994; Petts and Gurnell, 2005; Galay, 1983; Andrews, 1986; Gregory, 2006; Pišút, 2002;
Horsak et al., 2009; Painter and Heine, 2005).
Morphological and hydrological changes associated with dam construction are
generally characterized by 1) changes in flow rates and sediment loads delivered to the
downstream reaches, and 2) a sudden increase in base level for the upstream reaches. Flow
regulation downstream of dams is generally characterized by a reduction in the peak flood
discharges. Flow management to ensure safe navigation may be associated with increasing
magnitude in medium and low flows. In other words, the regulated flow regime
downstream of a dam is characterized by changes in shape, magnitude, and frequency of
the flow hydrograph compared to the natural conditions (Magilligan and Nislow, 2005).
The response of different river reaches to these changes depends on the reach
characteristics and as such it is very a complex problem that has to be approached with the
study of a significant amount of field data (Petts, 1979; Church, 1995).
The closure and the operation of a dam not only impacts the flow regime, it also
results in a reduction of the sediment that is supplied to the regulated reaches. In other
words, the majority of the sediment contributed from the basin upstream of the dam is
trapped in the reservoir and does not reach the regulated portion of a river. Depending on
the reservoir size and on the dam operational rules, the sediment trapping efficiency of a
reservoir may be as high as 95% (Williams and Wolman, 1984). As a result, the sediment
transport capacity of the flow released from the dam is in general higher than the sediment
supplied to the regulated reach and this may result in channel bed erosion and/or in the
downstream of the dam, the post-dam sediment supply and channel hydrology may recover
to pre-dam level (Li et al., 2009).
1.2IMPACT OF TIDAL OSCILLATIONS ON CHANNEL MORPHOLOGY
The interaction between tidal oscillations at the downstream end of a river channel and the
sediment transport processes plays an important control on channel forms and processes.
In rivers, bankfull channel width and depth increase in the streamwise direction as the flow
discharges increases from the mountains to the ocean (Leopold et al., 1964). Predicting
the spatial changes in channel geometry becomes more complex in tide-dominated settings
due to the complex interactions between river flows and tidal oscillations.
The fluvial-tidal transition zone identifies the portion of a river at the boundary
between the river-dominated reach, where the flow hydrodynamics is significantly
impacted by the tidal oscillations (Dalrymple and Choi, 2007; Dalrymple et al., 2012;
Ensign et al., 2013; van den Berg et al., 2007; Wright et al., 1973). The location of the
fluvial-tidal transition zone depends on the flow regime, the channel morphology, and the
characteristics of the tides (Dalrymple et al., 2015, Freitas et al., 2012).
Yankovsky et al. (2012) described the tidal-fluvial transition as the portion of the
river in which the interaction between the unidirectional river flow and the bidirectional
tidal flow becomes significant. Progressing from the ocean towards land, tidal amplitude,
and current speed increase due to channel convergence. As the tide travels landward,
energy is gradually dissipated due to bed friction and the interaction with the river
discharge. In the transition zone significant dissipation of tidal energy occurs (Ensign et
unidirectional river flow from the land to ocean and bidirectional tidal flows, channel
morphology in the fluvial-tidal transition zone is characterized by noticeable changes over
relatively short distances (Gurnell, 1997; Sassi et al., 2012; Yankovsky et al., 2012).
Recent observations in tidal settings documented changes in channel morphology
through the fluvial-tidal transition zone (Torres, 2017; Kastner et al., 2017; Yankovsky et
al., 2012; Gurnell, 1997; Sassi et al., 2012; Ganju et al., 2004; Dashtgard and La Croix,
2017; Dalrymple and Choi, 2007; Lawrence et al., 2015). In particular, Yankovsky et al.
(2012) and Torres (2017) reported on a sharp change in cross-section geometry in this part
of the river (see also Kastner et al., 2017; Sassi et al., 2012). Ganju et al. (2004) and
Dashtgard and La Croix (2017) used suspended sediment concentration measurements to
determine the location of the fluvial-tidal transition over a tidal cycle. During flood flow
the transition migrates landward and corresponds to the location of a maximum suspended
sediment concentration. These studies notwithstanding, changes in channel morphology
and sedimentary processes in the fluvial-tidal transition are still poorly characterized and
interpreted due to the complex flow hydrodynamics and its interaction with sediment
transport processes.
1.3RESEARCH OBJECTIVES
The overall objective of this dissertation is the study of how temporal changes in flow
regime, sediment supply and base level impact channel morphology. In particular, two
field cases are considered. The first field study focuses on the impacts of dam construction
narrowing/straightening. The second field study focuses on the impacts of tidal oscillations
(i.e. periodic, natural changes in base level) on the morphology and flow hydrodynamics
of the fluvial-tidal transition zone in the unregulated Altamaha River in Georgia, USA.
The Lower Missouri River is the ~1300 km long reach of the Missouri River
starting at Gavins Point Dam, SD, and ending at the Mississippi River – Missouri River
confluence, MO. Water resources management in the Lower Missouri River basin focuses
on different purposes including flood control, hydropower generation, irrigation, water
supply and maintenance of navigation flows. Dam construction in the 1950s coincided
with extensive engineering works such as channel alignment and bank stabilization, on
more than 90% of the total reach length (Pinter and Heine, 2005; Simon and Rinaldi 2000,
2006; Halberg, 1981).
The impacts of the engineering works on the Lower Missouri River morphology
can be summarized as widespread channel bed erosion and changes in sediment load, as
well documented in previous studies (Pinter and Heine, 2005; Jacobson and Galat, 2008;
Holly and Karim, 1986; Simon and Rinaldi 2000, 2006; Halberg, 1981). Due to the
problem complexity, however, there are still questions on 1) the impact of dam closure
and channelization works on the sand load delivered to the Mississippi River (e.g.,
Nittrouer and Viparelli, 2014; Blum and Roberts, 2014; Meade and Moody, 2010;
Horowitz et al, 2001; Kemp et al., 2016; Syvitski et al., 2009), 2) the role of tributaries and
the streamwise increase in drainage area on the regulated flow regime and sand loads, and
3) the response of the Missouri River channel to the engineering works.
The objectives of the proposed research on the impacts of changes in flow regime
a- Quantify, analyze, and discuss the spatial and temporal changes in flow regime
and suspended sand load in the study reach.
b- Quantify the morphodynamic response of the Lower Missouri River to the
engineering works at short and long time scales.
c- Determine the role of tributaries on the short and long term morphodynamic
evolution of the study reach.
The second part of the proposed research is an investigation on the morphological
and hydrodynamic characteristics in the fluvial-tidal transition zone. The study area is
located on a 47 km long reach of the Altamaha River, USA, located ~30 km upstream of
the river mouth. The flow regime in the study reach is non-regulated and tidally influenced
in the lowermost part of the reach, in other words the fluvial-tidal transition occurs within
the study reach.
The upper limit of the transition zone is generally identified by the tidal limit, i.e.
the point where the influence of tidal oscillations on the river flow becomes negligible.
The tidal limit does not have a fix position in time, it migrates upstream or downstream
during a tidal cycle and due to the variability of the river discharge (Freitas et al., 2012;
Dalrymple and Choi 2007; Dalrymple et al., 2012; Kastner et al., 2017; Gurnell, 1997;
Sassi et al., 2012; Ganju et al., 2004; Dashtgard and La Croix, 2017; Lawrence et al., 2015).
Spatial changes in channel geometry and sediment characteristics have been
observed across the fluvial-tidal transition zones (Torres, 2017; Kastner et al., 2017;
Gurnell, 1997; Sassi et al., 2012; Ganju et al., 2004; Dashtgard and La Croix, 2017;
Dalrymple and Choi, 2007; Lawrence et al., 2015). However, the physic processes that are
observed changes in channel geometry and sediment grain size is the main objective of the
proposed second study.
Specific objectives of the proposed research are to combine field observations and
one-dimensional calculations to:
a- Investigate the spatial changes in channel morphology and grain size
distribution across the fluvial-tidal transition zone; and
b- Interpret the change in channel geometry and grain size distribution with respect
to the spatial distribution of stream power and Shields number respectively.
The remainder of this document is organized as follows. The study on the short
and long term morphodynamic evolution of the Lower Missouri River is presented in
Chapter 2. The study on the changes in channel morphology and grain size distribution of
a fluvial-tidal transition presented in Chapter 3. The summary and conclusion of the two
CHAPTER 2
NUMERICAL SIMULATION OF MISSOURI RIVER BED EVOLUTION AND
SAND LOAD DOWNSTREAM OF GAVINS POINT DAM
12.1INTRODUCTION
The Missouri River originates in the Rocky Mountains in southwestern Montana and flows
southeastward for ~3800 km before it joins the Mississippi River near St. Louis, Missouri.
The US Army Corp of Engineers manages water resources in the Missouri River basin with
particular attention to flood control, navigation, hydropower generation, irrigation and
water supply. Dams and other engineering structures were built to regulate the Missouri
River and its tributaries (Ferrell, 1993, Pinter and Heine, 2005). Dam construction started
in the 1930s and about 100 dams have been built since the 1950s as part of the Pick-Sloan
water development project (Ferrell, 1993, Pinter and Heine, 2005; Skalak et al., 2013).
Gavins Point Dam, SD, is the most recent and downstream most dam on the Missouri River
mainstem and was closed in 1954.
This study focuses on the ~1300 km of the Missouri River from Gavins Point Dam
to the confluence with the Mississippi River, MO. This reach is generally called the Lower
Missouri River and it is represented in Figure 2.1 with the main tributaries, USGS gaging
stations, and locations that are relevant for this study. Downchannel distances in Figure 2.1
and throughout this chapter are measured in river kilometers, RK, upstream of the
Mississippi River – Missouri River confluence, with RK= 0 indicating the Mississippi
River – Missouri River confluence and RK = 1305 indicating the location of Gavins Point
Dam.
Channelization works on the Lower Missouri River were performed in the 1960s
from Sioux City, Iowa, to St. Louis, Missouri, to create a stable channel for navigation and
to reduce flood magnitude and frequency. In particular, the channel width was narrowed to
220 m – 360 m, equal to one half to one third of the original width, the main channel was
re-aligned, meanders were removed and the banks were armored to prevent lateral
migration (Pinter and Heine, 2005; Heine and Lant, 2009; Jacobson and Galat, 2008;
Simon and Rinaldi 2000, 2006; Halberg, 1981; Branyan, 1974). As a result, the Missouri
River mainstem was shortened of ~110 km and the sinuosity was reduced (U.S Army Corps
of Engineers, 2017).
Field observations show that the Missouri River response to these engineering
works has been complex. The Missouri River from Gavins Point Dam (RK 1305) to Sioux
City (RK 1178), IA and from St. Joseph (RK 719), MO to Kansas City (RK 589), MO
experienced 2.0 m - 4.0 m of bed degradation (see locations in Figure 2.1), while the reach
from Omaha (RK 991), NE, to Nebraska City (RK 937), NE, changed little since dam
closure (U.S Army Corps of Engineers, 2012; Pinter and Heine, 2005).
Quantifying the morphodynamic response of the Lower Missouri River to the
engineering works at short (decadal) and long (centennial) time scales is a difficult problem
that we approach with the analysis of the available field data and with the aid of a
1) the streamwise changes in the Lower Missouri River daily flows, 2) the spatial and
temporal changes in suspended sand load in the study reach, 3) the morphodynamic
evolution of the Lower Missouri River channel, and 4) the role of tributaries on the short
and long term morphodynamics of the study reach.
The changes of the Lower Missouri River hydrology associated with the
construction of dams have been thoroughly studied (Pegg et al. 2003; Pegg and Pierce,
2002; Galat and Lipkin, 2002; Jacobson and Galat, 2008). The vast majority of these
studies, however, primarily focused on the changes in flow regime at few gaging stations
and did not consider the impacts of water resources management on the flow regime of the
entire Lower Missouri River. Here we present an analysis of the daily flow data collected
at nine USGS stations to determine 1) the length of the Lower Missouri River where the
flow regime has been significantly impacted by the closure of Gavins Point Dam, and 2)
how the flow regime has changed in the Lower Missouri River due to flow regulation in
the river basin.
It is well accepted that historically the Missouri River contributed roughly 12% of
the total water and 50% of the total (sand and mud) sediment load to the Mississippi River
(Meade and Moody, 2010). However, the impacts of flow regulation in the Missouri River
basin on the sand and mud loads delivered to the Mississippi River are still a matter of
debate (e.g., Nittrouer and Viparelli, 2014; Blum and Roberts, 2014). The uncertainties
associated with the predictions of the sand load in the Lower Missouri River further
complicate the interpretation of the field observations. Here we use the available field data
upstream of the Mississippi River – Missouri River confluence from the closure of Gavins
Point Dam at short (decadal) and long (centennial) time scales.
Finally, to the best of our knowledge the role of the main tributaries on the
morphodynamic evolution of a large, regulated river is a largely overlooked problem in the
engineering literature (Blom et al., 2016). Here a model of river morphodynamics is used
to investigate the role of the Missouri River tributaries on the evolution of the regulated
and engineered Lower Missouri River mainstem.
2.2THE LOWER MISSOURI RIVER
The Missouri River basin occupies ~137,000 km2 of the United States from South West
Montana to Missouri (Galat and Lipkin, 2002). For water resources management the
Missouri River is divided into three reaches, the Upper Missouri River from the headwater
to Fort Peck Dam, MT, the Middle Missouri River from Fort Peck Dam, MT, to Gavins
Point Dam (RK 1305) near Yankton, SD, and the Lower Missouri River from Gavins Point
Dam to the confluence with the Mississippi River near St. Louis, MO (Jacobson and Galat,
2008; Holly and Karim, 1986; Alexander et al., 2013). It is worth mentioning here that in
some studies the upstream end of the Lower Missouri River is located at Sioux City (RK
1178), IA (Pegg et al. 2003; Pegg and Pierce, 2002; Galat and Lipkin, 2002).
The major tributaries of the Lower Missouri River are listed in Table 2.1 with
indication of the confluence location, tributary drainage area and confluence side, i.e. on
the hydraulically left or right of the Missouri River. In general, the tributaries on the
hydraulic left have low slopes and fine sediment load. The tributaries on the hydraulic right
The US Army Corps of Engineers conducted extensive bed sampling in the 1970s
from Yankton (RK 1305), SD, to St. Joseph (RK 719), MO, and showed that the median
bed material size ranges between 0.2 and 0.4 mm (Holly and Karim, 1986). Further,
Keown et al. (1986) reported that there was no significant change in the bed material (sand)
size at Hermann (RK 157) for the last 50 years, where the characteristics sand size varies
between 0.2 mm and 0.45 mm.
2.2.1Lower Missouri River hydrology
The hydrology of the Lower Missouri River is analyzed using daily flows recorded at nine
USGS gaging stations on the Missouri River main channel. These stations are listed in
Table 2.2 with their USGS ID number, location in RKM, period of record and watershed
area. These stations were chosen based on the length of the period of record, the type of
available measurements and on the location.
The USGS stations with daily flow measurements and with a record of suspended
sediment measurements starting prior to 1954 were used to characterize the flow regime
and sediment loads. The USGS stations located on the mainstem immediately downstream
of the junctions with major tributaries were used to determine the streamwise changes in
flow regime. The downstream most USGS stations on the major tributaries were considered
to determine the input of sediment from major tributaries.
The majority of the Missouri River mainstem dams were completed in the 1950s
and 1960s, and the flow record at the USGS stations on the Lower Missouri River
into two periods: pre-1954 or pre-Garrison Dam (pre-dam), and post-1954 or post-Garrison
Dam (post-dam).
Garrison Dam was completed in 1953 and it was the first large dam built on the
Missouri River mainstem after the closure of Fort Peck Dam, MT, in 1937. The area of the
Missouri River basin upstream of Fort Peck Dam is equal to 20% of the drainage area of
the Missouri River basin at Gavins Point Dam. We thus assume that the construction of the
Fort Peck Dam did not have a significant impact on the Lower Missouri River.
The same assumption cannot be made for Garrison Dam, ND, located ~610 km
downstream of Fort Peck Dam and ~930 km upstream of Gavins Point Dam. The area of
the Missouri River basin at Garrison Dam is equal to the 65% of the Missouri River basin
area at Gavins Point Dam, and the assumption that the construction of Garrison Dam did
not impact the flow regime at Gavins Point Dam cannot be reasonably made (Meade and
Moody, 2010; Shalak et al., 2013). Thus, the pre-1954, i.e. pre-Garrison Dam closure, daily
flow data are used to characterize the pre-dam flow regime of the Lower Missouri River.
The flow regime of the Lower Missouri River is here described with flow duration
curves based on the mean daily flows measured at the nine USGS stations listed in Table
2.2. Pre- and post-dam flow duration curves are presented in Figure 2.2, where the
continuous and the dashed lines respectively represent pre- and post-dam conditions. For
analysis and comparison purposes, high flows are characterized by probabilities of
exceedance are greater than 0.05 and low flows have probabilities of exceedance smaller
than 0.6.
After the completion of the engineering works on the Lower Missouri River, dams
agriculture (Simon et al., 2004; Ferrell, 1993; Meade and Moody, 2010). To determine if
the engineering works and the changes in land use and management practices in the Lower
Missouri River basin had an influence on the daily flows of the Lower Missouri River, we
compared the post-dam flow duration curves at the USGS stations of Table 2.1 for 20-year
intervals (1955-1974, 1975-1994, 1995-2015) with the pre-dam flow duration curve.
The flow duration curves for the 20-year time intervals are presented in Figure 2.3,
where the gray and black lines represent the pre-dam and the 1995-974 periods
respectively. The continuous dashed and dotted black lines represent the post-dam periods
between 1975 and 1994 and between 1995 and 2015 respectively.
The post-dam flow regime at Yankton (RK 1287), SD, immediately downstream of
Gavins Point Dam, did not significantly change from a 20-year period to the other (Figure
2.3a). The only noticeable difference between the flow duration curves is an increase of
the low flows (probability of exceedance greater than 0.6) for the period between 1975 to
2015.
From Sioux City (RK 1178), IA to Waverly (RK 467), MO, the 1955-1974 period
has the lowest flow rates (Figure 2.3b to 2.3g). This decline in the post-dam flow regime
is associated with impoundment of the large reservoirs that extended until the end of the
1960s (Galat et al., 1996; Pegg et al., 2003; Blevins et al., 2014). The 1975-2015 flow rates
with a probability of exceedance larger than ~0.3 are of the same order of magnitude of the
pre-dam flows with the same probability of exceedance (Figures 2.3c to 2.3h). Downstream
of the Grand River – Missouri River confluence at Hermann (RK 158), MO, the 1975-2015
intermediate and high flow rates reach the pre-dam flow level with no significant
In summary, Figure 2.2 and 2.3 show that 1) the effects of the dams on the Lower
Missouri River flows gradually decrease as major tributaries enter the mainstem, 2)
post-dam low flows are generally larger than the pre-post-dam flows with the same probability of
exceedance, 3) upstream of the Missouri River -Grand River confluence post-dam flows
with a probability of exceedance greater than ~0.1 are smaller than the pre-dam flows with
the same probability of exceedance, and 4) downstream of the Missouri River -Grand River
confluence, the 1975-2015 post-dam flows with probability of exceedance smaller than
~0.1 are higher than pre-dam flows.
2.2.2Mean annual suspended sand loads
The mean annual suspended sand loads are calculated using two approaches. The first
approach uses the power relation between the daily flow and suspended sand load, as
illustrated and discussed in the continuing of this section. The second approach uses the
suspended sediment concentration rating curve. The calculation procedure and the
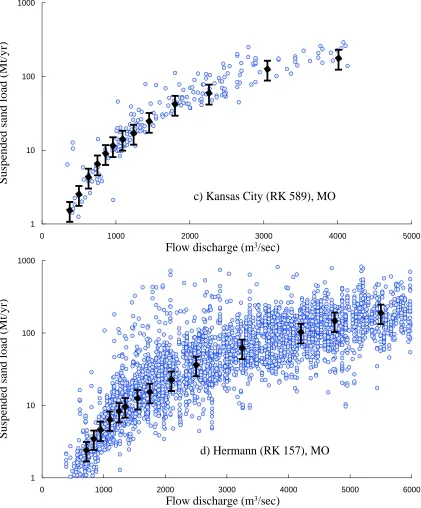
estimated mean annual sand loads are reported in the Appendix A. The comparison
between the mean annual sand loads at the USGS stations on the Missouri River mainstem
(Table 2.3) using these two methods shows that the maximum reported difference between
the calculated loads was less than 20% of the mean annual sand load based on the
suspended sand rating curve, which is used for the calculations presented in the continuing
of this chapter.
Mean annual suspended sand loads are calculated from the available data collected
at five USGS stations on the Missouri River mainstem (Table 2.3) and at the downstream
information (name and USGS ID) is reported in Tables 2.3 and 2.4 with the estimated pre-
and post-dam suspended sand loads based on the power relation between daily flow and
suspended sand load, the period of record of suspended sediment concentration and the
number of measurements used in the analysis. The procedures used to estimate the mean
annual suspended sand loads is illustrated below.
2.2.2.1 Pre-dam mean annual sand load
A limited number of suspended sediment concentration measurements are available at four
stations on the Missouri River (Omaha, NE, St. Joseph, MO, Kansas City, MO, and
Hermann, MO) for the pre-dam period, but the volume fraction content of sand in
suspension is not reported. To determine a pre-dam suspended sand rating curve the
suspended sediment discharges were estimated as the product of the measured suspended
sediment concentration, the discharge and the volume fraction content of sand in
suspension (Grey and Simoes, 2008). Heimann et al. (2011) reported that the average
fractions of sand in suspension was 0.43 at Omaha, NE, (39 samples); 0.26 at St. Joseph,
MO, (13 samples); 0.15 at Kansas City, MO, (9 samples); and 0.2 at Hermann, MO, (12
samples). These fractions were used to estimate the pre-dam suspended sand rating curves.
At Yankton, SD, where pre-dam suspended sand data are not available, the suspended sand
rating curve based on data collected between 2000 and 2008 was assumed to be
representative of pre- and post-dam suspended sand transport. At Omaha, NE, the pre-dam
mean annual sand load is estimated based on the 14 available values. The mean annual
suspended sand load was estimated by averaging the suspended sand rating curve over the
2.2.2.2 Post-dam mean annual sand load
The post-dam suspended sand rating curves at the five stations on the Missouri River of
Table 2.3 were built with all the available data collected after 1954 for which the volume
fraction content of sand in suspension was reported. Due to the lack of measurements of
instantaneous discharge for a significant number of post-dam data and for all the pre-dam
data, the suspended sand load was estimated by multiplying the daily discharge by the
suspended sand concentration. Although this method does not provide an accurate estimate
of the instantaneous suspended sand load, it will give a reasonable estimate of the daily
loads (Joshi and Xu, 2015).
The pre- and post-dam mean annual suspended sand loads of Table 2.3 were
computed as the average sand transport rate over the pre- and post-dam flow duration
curves. In particular, the flow duration curves of Figure 2.2 were modeled in terms of 36
characteristics discharges, Qi, with pi being the average fraction of the year in which the
flow was equal to Qi. The suspended sand transport capacity, Qsi, for each characteristic
discharge was then computed with the suspended sand rating curves (USACE, 2006). The
mean annual suspended sand load, Qbm,s was finally estimated as:
𝑄𝑏𝑚,𝑠 = ∑ 𝑝𝑖𝑄𝑠𝑖 𝑛
𝑖=1
(2.1)
After 1954 the mean annual suspended sand load decreased from 8.8 Mt/yr to 0.5
Mt/yr at Yankton, SD. The post-dam reduction in mean annual suspended sand load
gradually diminishes in the downstream direction with the post-dam suspended sand load
The same procedure was used to estimate the suspended sand loads at the lower
most stations on the major tributaries of Table 2.4. Due to the lack of pre-dam data on
suspended sand transport and daily flows, only post-dam sand loads could be estimated.
Thus, in the model simulations presented in the continuing of this chapter we assumed that
the pre-dam loads were equal to the post-dam suspended sand loads.
Field measurements of bedload transport on the Lower Missouri River are scarce.
Based on measurements and observations performed by the USACE in 2012 the bedload
transport was assumed to be equal to ~10% of the suspended sand load (Joshi and Xu,
2015; USACE, 2012).
2.3MODEL FORMULATION
Model governing equations are the shallow water equations of conservation of flow mass
and momentum (Chaudhry, 2008) and the equation of conservation of bed material (sand),
the Exner equation. Flow resistances and suspended sand loads are computed with the
Wright and Parker (2004) formulation for large, low slope sand bed rivers and the bedload
transport rate is estimated with the Ashida and Michiue relation, which was derived based
on experiments performed with sand and pea gravel (Parker, 2008).
For the model application to the ~1300 km long Lower Missouri River the problem
is simplified as follows:
1. The bed material load is assumed to be orders of magnitude smaller than the flow
rate so that the quasi-steady approximation holds (De Vries, 1965).
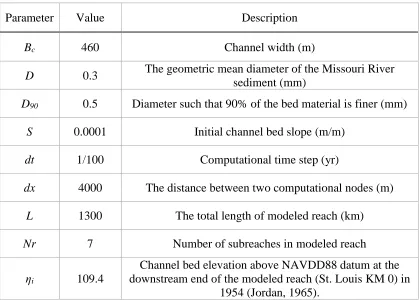
3. The grain size distribution of the channel bed material is assumed to be uniform
with characteristic grain size D equal to 0.3 mm.
4. The sediment fluxes between the Missouri River channel and its floodplain are
not accounted for in the calculations. In other words, a perfect balance between
erosion and deposition associated with channel migration and overbank
deposition of suspended sediment is assumed (Lauer and Parker, 2008a, b).
2.3.1Flow equations
The one-dimensional form of the shallow water equations for open channel flow is
(Chaudhry, 2008)
𝜕𝐻
𝜕𝑡 +
𝜕𝑈𝐻
𝜕𝑥 = 0 (2.2)
𝜕𝑈𝐻
𝜕𝑡 +
𝜕𝑈2𝐻
𝜕𝑥 = −𝑔𝐻
𝜕𝐻
𝜕𝑥+ 𝑔𝐻𝑆 − 𝐶𝑓𝑈2 (2.3)
where H and U respectively denote the cross-sectionally averaged flow depth and
depth-averaged flow velocity, 𝐶𝑓 is a non-dimensional friction coefficient, 𝑆 is channel bed slope
and equal to − 𝜕𝜂 𝜕𝑥⁄ with η being the channel bed elevation, 𝑔 is the acceleration of
gravity and 𝑥 and 𝑡 respectively are the downchanneland temporal coordinates.
Equations (2.2) and (2.3) are simplified with the aid of the quasi-steady
approximation (DeVries, 1965). The time dependence is dropped, and the one-dimensional
shallow water equation reduces to
𝑞 = 𝑈𝐻 (2.4)
𝑈 𝑔
𝜕𝑈
𝜕𝑥+
𝜕𝐻
𝜕𝑥 +
𝜕𝜂
𝜕𝑥= −
𝐶𝑓𝑈2
where 𝑞 denotes the volumetric flow rate per channel width and is equal to 𝑄 𝐵⁄ 𝑐 with 𝑄 being the flow discharge.
Recalling the friction slope 𝑆𝑓 is equal to 𝐶𝑓𝐹𝑟2with 𝐹𝑟denoting the Froude
Number defined as √𝑈 𝑔𝐻⁄ , equation (2.5) can be rewritten as
𝜕𝐸
𝜕𝑥 = −𝑆𝑓 (2.6)
where E denotes to the total energy defined as
𝐸 = η + 𝐻 + 𝑈2/2𝑔 (2.7)
𝜂 + 𝐻 in equation (2.7) is equal to water surface elevation 𝜉.
2.3.2Equation of conservation of bed material
The one-dimensional equation of conservation of bed material is used to compute the
changes in channel bed elevation as
(1 − 𝜆𝑝)𝐵𝑐𝜕η
𝜕𝑡 = −
𝜕𝑄𝑏𝑚
𝜕𝑥 (2.8)
where 𝑄𝑏𝑚 denotes the mean annual bed material (sand) load and is equal to the sum of
the suspended sand load and of the sand load transported as bedload, and 𝜆𝑝 denotes the bulk porosity of bed.
2.3.3Flow resistance calculation
To numerically integrate equation (2.6), the friction slope, Sf, has to be computed as a
function of the flow characteristics. The Wright and Parker (2004) formulation is here
1 √𝐶𝑓 = 𝑈 𝑢∗ = 8.32 ⍺ ( 𝐻 𝑘𝑐) 1/6 (2.9)
where kc represents the composite roughness height, i.e. the roughness height-associated
with skin friction and form drag, 𝑢∗ denotes the shear velocity defined as 𝑢∗= √𝜏 𝜌⁄ with
𝜏 denoting the bed shear stress, and ⍺ is a parameter that accounts for stratification effects
associated with suspended sediment transport.
Based on field data collected in the Mississippi River basin Wright and Parker
(2004b) proposed the following relation to compute ⍺ as a function of the near-bed
volumetric suspended sediment concentration averaged over turbulence 𝐶5 at a distance zb from the channel bed equal to 0.05H and the channel bed slope 𝑆, which is substituted here
with the friction slope Sf to account for gradually varying flow (Viparelli et al., 2015)
⍺ =
{
1 − 0.06 (𝐶5
𝑆𝑓)
0.77
, 𝐶5
𝑆𝑓 ≤ 10 0.67 − 0.0025 (𝐶5
𝑆𝑓) ,
𝐶5 𝑆𝑓 > 10
(2.10)
Under the assumption of equilibrium suspension 𝐶5 is equal to the entrainment rate of sediment in suspension, 𝐸𝑏. In the Wright and Parker formulation 𝐸𝑏 is function of the shear velocity associated with skin friction 𝑢∗𝑠, defined as the square root of the ratio
between the bed shear stress associated with skin friction, s, and the water density, the
characteristics of the bed material, and the friction slope Sf, as reported in Equation (2.11)
𝐸𝑏= 𝐵𝑋5
1 +0.3 𝑋𝐵 5 (2.11)
𝑋 = (𝑢∗𝑠 𝑣𝑠 𝑅𝑝
0.6) 𝑆
𝑓0.08 (2.12)
with vs being the particle settling velocity and 𝑅𝑝denoting the particle Reynolds number
defined as (𝑅𝑔𝐷)0.5𝐷/𝜈 where 𝜈 is the kinematic viscosity of water, and 𝑅 is the submerged specific gravity of the bed material (1.65 for quartz).
The Wright and Parker criterion to partition the flow resistances between skin
friction and form drag is expressed as follows
𝜏𝑠∗ = 0.05 + 0.7(𝜏∗𝐹
𝑟0.7) 0.8 (2.13)
where 𝜏∗ and 𝜏𝑠∗are the Shields numbers respectively defined as 𝜏/𝜌𝑅𝑔𝐷 and 𝜏𝑠/𝜌𝑅𝑔𝐷. The flow resistance calculation is characterized by four equations, i.e. (2.9)-(2.11)
and (2.13), in the six unknowns Sf, kc, u*s, , Eb, Cf. Two more equations are thus needed
to close the problem.
The first equation is analogous to equation (2.9) but it links the mean flow velocity
with the values of water depth, shear velocity and roughens height associated with skin
friction as
𝑈 𝑢∗𝑠 =
8.32
⍺ (
𝐻𝑠
𝑘𝑠) 1/6
(2.14)
where 𝑘𝑠 is the roughness height associated with skin friction as it is equal to 3𝐷90 with
𝐷90 denoting the diameter such that 90% of the bed material is finer.
The second equation to close the problem links the roughness heights with the flow
depths H and Hs as follows
𝐾𝑐 𝐾𝑠 = (
𝐻 𝐻𝑠)
4
Equations (2.9)-(2.11) and (2.13)-(2.15) are iteratively solved to determine the flow
resistance and the entrainment rate of sand in suspension.
2.3.4Calculation of mean annual bed material load
The bedload transport capacity is computed with the Ashida and Michiue (1972)relation:
𝑄𝑏𝑚,𝑏 = 17√𝑅𝑔𝐷𝐷𝐵𝑐(𝜏𝑠∗− 0.05)(√𝜏𝑠∗− √0.05) (2.16)
The suspended-sand load 𝑄𝑏𝑚,𝑠 is computed as (Wright and Parker, 2004)
𝑄𝑏𝑚,𝑠 =
9.7
⍺ 𝐶5𝑢∗𝐻𝐵𝑐( 𝐻 𝑘𝑐)
1/6
𝐼 (2.17)
where 𝐼 is the integral and can be defined as
𝐼 = ∫ 𝑦 1 1/6 𝑦5
(1 − 𝑦 𝑦
𝑦5 𝑦5− 1)
𝑍𝑟
𝑑𝑦 (2.18)
where 𝑍𝑟 denotes the Rouse number defined as 𝑣𝑠/ ⍺ ĸ 𝑢∗ with ĸ being the von Karman constant set equal to 0.41, 𝑦 a non-dimensional upward oriented coordinate normal to the
channel bed such that y = 0 on the channel bed and y = 1 at the water surface, 𝑦5 the non-dimensional distance from the channel bed where the concentration of suspended sediment
is equal to 𝐶5 (y5 = 0.05) and I was numerically computed by Wright and Parker (2004b)
as:
𝐼 ≈ {0.679 exp(−2.23𝑍𝑟) , 𝑍𝑟 ≤ 1
0.073𝑍𝑟−1.44 , 𝑍𝑟 > 1 (2.19)
The volumetric mean annual sand load, Qbm, is equal the average over the flow
duration curve of the transport capacity of sand in suspension (equations 2.17 and 2.19)
𝑄𝑏𝑚 = ∑(𝑄𝑏𝑚,𝑏,𝑖+ 𝑄𝑏𝑚,𝑠,𝑖)
𝑀
𝑖=1
𝑝𝑖 (2.20)
where M denotes the number of discharge bins used to discretize the flow duration curve,
equal to 24 in the simulations presented below.
2.4NUMERICAL IMPLEMENTATION AND BOUNDARY CONDITIONS
Equations 2.6 – 2.8 are solved with a first order Euler scheme. The computational time step
∆𝑡 and the distance between two computational nodes ∆𝑥 for pre-and post-dam simulations
are equal to 1/100 year and 4 km respectively. The channel bed porosity p is assumed to
be constant and equal to 0.35.
The schematic representation of the study reach is presented in Figure 2.4. In
Figure 2.4, input flow discharge and sand loads at the upstream boundary of the reach and
at the confluence with the major tributaries of Table 2.1 are respectively represented with
blue and orange arrows. The green dots represent the USGS stations that are used to
validate the model sand load predictions. In summary, the entire reach is divided into seven
subreaches and the flow discharge and sand load are specified at the upstream end of each
subreach.
Nine major tributaries are reported in Table 2.1 thus the modeled reach should have
been divided into 11 subreaches. Due to the lack of information on daily flows and
suspended sand loads between the confluences of the Missouri River with the Nishnabotna
River (RK 870) and the Nodaway River (RK 745), with the Grand River (RK 402) and the
in Figure 2.4, and the modeled reach is divided into 7 subreaches. Each model confluence
is located where the Missouri River meets the largest tributary, i.e. at RK 870 (Missouri
River – Nishnabotna River confluence), and RK 402 (Missouri River – Chariton River
confluence) and at RK 209 (Missouri River – Osage River confluence).
The flow discharge and the input sand load are specified as boundary conditions at
the upstream end of the computational domain and at the confluences with major
tributaries. At each confluence a flow duration curve is specified based on the USGS
records at the stations of Table 2.2. Due to the lack of confluences with major tributaries
between the stations at Sioux City, IA, and Omaha, NE, the flow duration curves at Omaha,
NE, are not used in the numerical simulations. For same reason, flow duration curves at
Waverly, MO, downstream Kansas City, MO, station are also not used in the calculations
presented below.
The sand load at the upstream end of the modeled reach is equal to the mean annual
sand loads estimated at Yankton, SD. At each confluence, the sand load is equal to the
sum of the sand load supplied to the subreach upstream of the confluence plus the input
sand from the main tributary (Table 2.4). The mean annual sand load computed at the
USGS stations on the Missouri River mainstem downstream of Yankton, SD listed in Table
2.3 are not used as model input, but are used for model verification.
The hydraulic calculations at each confluence impose the conservation of energy
and flow mass in the absence of local head losses (for details see Chaudhry, 2008).
Equation (2.6) is integrated in the upstream direction, so that the energy level and the water
The downstream boundary condition for equation (2.6) is a specified water surface
elevation at the Mississippi River – Missouri River confluence, which is a function of the
discharges in the Mississippi River, in the Missouri River, of the hydrodynamic conditions
in the Mississippi River, and of the confluence geometry. In other words, predicting the
water surface elevation at the Mississippi River – Missouri River confluence is not an easy
task.
The problem was simplified as follows: the average daily flow measured at the
USGS station on the Missouri River at Hermann, MO, (158 km upstream of the Mississippi
River – Missouri River confluence) and the gage height measured on the Mississippi River
at St. Louis, MO, (~24 km downstream of the Mississippi River - Missouri River
confluence) in the same day have been plotted to find a relationship to express the
downstream boundary condition as a function of the flow rate in the Missouri River.
The data points presented in Figure 2.5 show that the water surface elevation at
USGS station at St. Louis, MO, can be reasonably approximated as a function of the flow
rate at Hermann, MO, as 𝜉𝑆𝑡.𝐿𝑜𝑢𝑖𝑠 = 68𝑄𝐻𝑒𝑟𝑚𝑎𝑛0.07 with St.Louis denoting the water surface elevation at St. Louis and QHermann denoting the daily flow at Hermann, MO. To express
the model downstream boundary condition, it is further assumed that the water surface
elevation at the Mississippi River – Missouri River confluence is not much different from
the water surface elevation measured at the USGS station in St. Louis, and the power low
2.5PRE-DAM MODEL ZEROING
Model zeroing is the first and necessary step in field scale applications of morphodynamic
models. Depending on the problem of interest, these runs are performed with different
objectives, e.g. parameter calibration (e.g. Lauer and Parker, 2008; Viparelli et al., 2011),
definition of pre-disturbance conditions (e.g. Viparelli et al., 2015), characterization of an
initial equilibrium (steady-state) for the model runs (e.g. Cui et al., 2006; Viparelli et al.,
2013; Lauer et al., 2016). ). Here the pre-dam model zeroing was performed to determine
a reasonable equilibrium condition by comparing model results with the available field
data. This equilibrium condition was then used as initial condition for the post-dam runs.
The seven subreaches of the Missouri River presented in Figure 4 were modeled as
sediment-feed flume analogues, i.e. the flow rates and the bed material loads were specified
at the upstream end of each subreach and the water surface elevation was specified at the
downstream end of each subreach. Under these conditions the equilibrium profile is
independent from the initial condition of the simulations (Parker and Wilcock, 1993). The
channel width of the pre-dam Missouri River is assumed to be 460 m (Pinter and Heine,
2005).
Two types of zeroing runs were performed, one in which the streamwise increase
of the drainage area was neglected and the flow rate and sediment loads at equilibrium did
not change from Yankton, SD, to the Mississippi River – Missouri River confluence, and
the other in which the streamwise increase in drainage areas was accounted for as illustrated
in the previous section. Starting from an initial longitudinal bed profile with constant slope
conditions of equilibrium, i.e. when the longitudinal profile did not change in time. Model
input parameters for the zeroing runs are summarized in Table 2.5.
Pre-dam equilibrium channel bed profiles are presented in Figure 2.6, where the
dotted black line represents the equilibrium profile with spatially constant flow rates and
sand load, and the continuous black line is the equilibrium profile that accounts for the
streamwise increase in flow rate and sand load. The vertical dashed lines denote the
location of the major tributaries, where changes in the flow duration curves and sand loads
were specified. The black square dots are measurements of thalweg elevation in 1954
reported by the USACE (U.S Army Corps of Engineers: Omaha District, 1993) and the
black cross dots are thalweg elevation measurements in 1952 reported by the USACE (U.S
Army Corps of Engineers, 2012).
The equilibrium profile in the case of spatially constant flow duration curve and
sand load has a constant slope of 0.00009 m/m, and sand transport capacity equal to the
upstream input rate. The equilibrium profile in the simulation with input of water and sand
from the main tributaries shows an upward concavity, i.e. decreasing slope in the
downstream direction, that is commonly observed in alluvial rivers (Blom et al., 2016) and
a reach averaged channel slope of 0.00022 m/m.
The comparison between predicted and measured pre-dam bed elevations of Figure
2.6 shows a reasonable agreement between measured and predicted bed elevations when
the streamwise changes in flow rate and sediment loads are accounted for in the
calculations suggesting that the model is able to reasonably reproduce the 1D
The comparison between the numerical predictions and field measurements of
pre-dam suspended sand loads at the USGS stations at Omaha (RK 991), NE, St. Joseph (RK
719), MO, Kansas City (RK 589), MO and Hermann (RK 158), MO, are presented in
Figure 2.7 for the simulation in which the spatial changes in flow duration curve and sand
load are accounted for. In this figure the numerical predictions at equilibrium are
represented with the black square dots and the measured data are represented with blue
square dots. The vertical bars on the numerical predictions indicate an error of ±15 of the
numerical value showing that the model reasonably reproduces the suspended sand load at
the four USGS stations along the Lower Missouri River.
2.6POST-DAM SIMULATIONS
In 1950s major engineering works were performed on the Lower Missouri River for water
resources management, flood control and navigation. Gavins Point Dam was closed in
1954, and channel straightening and narrowing was completed prior to 1960 on 90% of the
Lower Missouri River. Due to the lack of details on the channel straightening works, here
channel narrowing only is considered in the post-dam simulations as a reduction in channel
width from 460 m to 320 m from Sioux City (RK 1178), IA, to Mississippi River – Missouri
River confluence.
Two sets of post-dam simulations were performed to investigate 1) how the
equilibrium of the Lower Missouri River changes due to the closure of Gains Point dam
and/or channel narrowing, and 2) the combined effect of the engineering works and the